
Waterfall charts in Excel are graphs that visually show how a series of consecutive positive or negative values contribute to the final outcome. They are a useful tool for tracking company profits or cash flow, comparing product revenues, analyzing sales and inventory changes over time, etc. In this article, you will learn how to create a waterfall chart in Excel in C# and VB.NET using Spire.XLS for .NET.
Install Spire.XLS for .NET
To begin with, you need to add the DLL files included in the Spire.XLS for .NET package as references in your .NET project. The DLL files can be either downloaded from this link or installed via NuGet.
PM> Install-Package Spire.XLS
Create a Waterfall Chart in Excel in C# and VB.NET
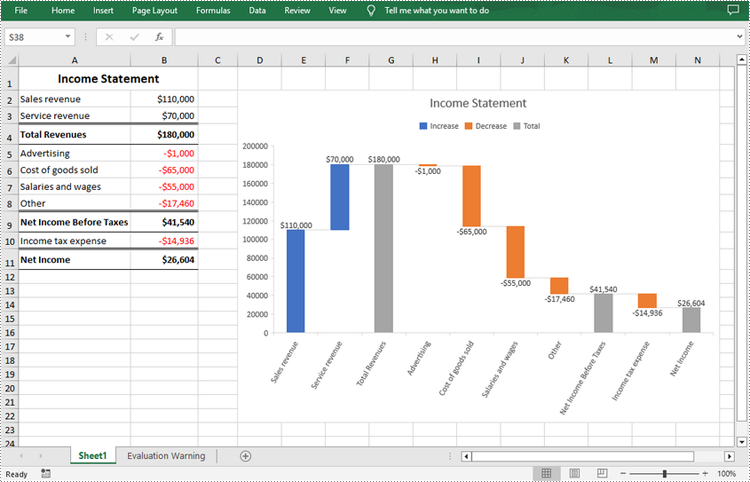
Waterfall/bridge charts are ideal for analyzing financial statements. To add a waterfall chart to an Excel worksheet, Spire.XLS for .NET provides the Worksheet.Charts.Add(ExcelChartType.WaterFall) method. The following are the detailed steps.
- Create a Workbook instance.
- Load a sample Excel document using Workbook.LoadFromFile() method.
- Get a specified worksheet by its index using Workbook.Worksheets[sheetIndex] property.
- Add a waterfall chart to the worksheet using Worksheet.Charts.Add(ExcelChartType.WaterFall) method.
- Set data range for the chart using Chart.DataRange property.
- Set position and title of the chart.
- Get a specified data series of the chart and then set specific data points in the chart as totals or subtotals using ChartSerie.DataPoints[int index].SetAsTotal property.
- Show the connector lines between data points by setting the ChartSerie.Format.ShowConnectorLines property to true.
- Show data labels for data points, and set the legend position of the chart.
- Save the result document using Workbook.SaveToFile() method.
- C#
- VB.NET
using Spire.Xls;

namespace WaterfallChart
{
    class Program
    {
        static void Main(string[] args)
        {
            //Create a Workbook instance
            Workbook workbook = new Workbook();

            //Load a sample Excel document
            workbook.LoadFromFile("Data.xlsx");

            //Get the first worksheet
            Worksheet sheet = workbook.Worksheets[0];

            //Add a waterfall chart to the the worksheet
            Chart chart = sheet.Charts.Add(ExcelChartType.WaterFall);

            //Set data range for the chart
            chart.DataRange = sheet["A2:B11"];

            //Set position of the chart
            chart.LeftColumn = 4;
            chart.TopRow = 2;
            chart.RightColumn = 15;
            chart.BottomRow = 23;

            //Set the chart title
            chart.ChartTitle = "Income Statement";

            //Set specific data points in the chart as totals or subtotals
            chart.Series[0].DataPoints[2].SetAsTotal = true;
            chart.Series[0].DataPoints[7].SetAsTotal = true;
            chart.Series[0].DataPoints[9].SetAsTotal = true;

            //Show the connector lines between data points
            chart.Series[0].Format.ShowConnectorLines = true;

            //Show data labels for data points
            chart.Series[0].DataPoints.DefaultDataPoint.DataLabels.HasValue = true;
            chart.Series[0].DataPoints.DefaultDataPoint.DataLabels.Size = 8;

            //Set the legend position of the chart
            chart.Legend.Position = LegendPositionType.Top;

            //Save the result document
            workbook.SaveToFile("WaterfallChart.xlsx");
        }
    }
}
Apply for a Temporary License
If you'd like to remove the evaluation message from the generated documents, or to get rid of the function limitations, please request a 30-day trial license for yourself.
