
The leader line on Excel chart is very helpful since it gives a visual connection between a data label and its corresponding data point. Spire.XLS offers a property of DataLabels.ShowLeaderLines to enable developers to show or hide the leader lines easily. This article will focus on demonstrating how to show the leader line on Excel stacked bar chart in C#.
Note: Before Start, please ensure that you have download the latest version of Spire.XLS (V7.8.64 or above) and add Spire.xls.dll in the bin folder as the reference of Visual Studio.
Here comes to the code snippet of how to show the leader line on Excel stacked bar chart in C#.
Step 1: Create a new excel document instance and get the first worksheet.
Workbook book = new Workbook();
Worksheet sheet = book.Worksheets[0];
Step 2: Add some data to the Excel sheet cell range.
sheet.Range["A1"].Value = "1";
sheet.Range["A2"].Value = "2";
sheet.Range["A3"].Value = "3";
sheet.Range["B1"].Value = "4";
sheet.Range["B2"].Value = "5";
sheet.Range["B3"].Value = "6";
Step 3: Create a bar chart and define the data for it.
Chart chart = sheet.Charts.Add(ExcelChartType.BarStacked);
chart.DataRange = sheet.Range["A1:B3"];
Step 4: Set the property of HasValue and ShowLeaderLines for DataLabels.
foreach (ChartSerie cs in chart.Series)
  {
    cs.DataPoints.DefaultDataPoint.DataLabels.HasValue = true;
    cs.DataPoints.DefaultDataPoint.DataLabels.ShowLeaderLines = true;
  }
Step 5: Save the document to file and set the excel version.
book.Version = ExcelVersion.Version2013;
book.SaveToFile("result.xlsx", FileFormat.Version2013);
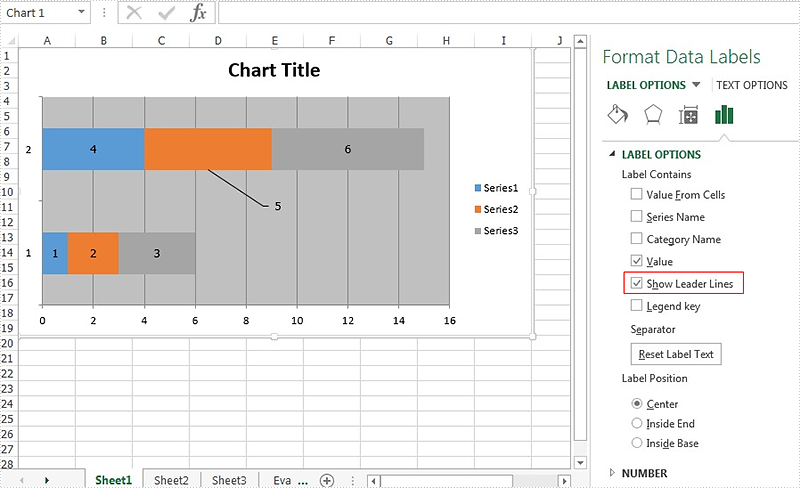
Effective screenshots:
Full codes:
using Spire.Xls;
using Spire.Xls.Charts;
using Spire.Xls.Core.Spreadsheet.Charts;
using System.Drawing;
namespace ShowLeaderLine
{
    class Program
    {

        static void Main(string[] args)
        {
            Workbook book = new Workbook();
            Worksheet sheet = book.Worksheets[0];

            sheet.Range["A1"].Value = "1";
            sheet.Range["A2"].Value = "2";
            sheet.Range["A3"].Value = "3";
            sheet.Range["B1"].Value = "4";
            sheet.Range["B2"].Value = "5";
            sheet.Range["B3"].Value = "6";

            Chart chart = sheet.Charts.Add(ExcelChartType.BarStacked);
            chart.DataRange = sheet.Range["A1:B3"];

            foreach (ChartSerie cs in chart.Series)
            {
                cs.DataPoints.DefaultDataPoint.DataLabels.HasValue = true;
                cs.DataPoints.DefaultDataPoint.DataLabels.ShowLeaderLines = true;
            }

            book.Version = ExcelVersion.Version2013;
            book.SaveToFile("result.xlsx", FileFormat.Version2013);
        }

    }
}
