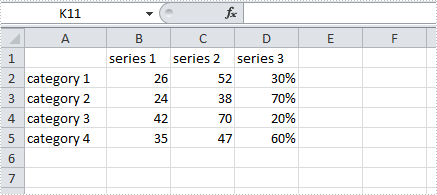
A combination chart that combines two or more chart types in a single chart is often used to emphasize different types of information in that chart. As is shown in the below Excel sheet, we have different type of data in series 3. To clearly display data of different types, it can be helpful to plot varying data sets either with different chart types or on different axes.
In this article, we will introduce how to combine different chart types in one chart and how to add a secondary axis to a chart using Spire.XLS in C#, VB.NET.
Code Snippet:
Step 1: Create a new instance of Workbook class and the load the sample Excel file.
Workbook workbook = new Workbook();
workbook.LoadFromFile("data.xlsx");
Step 2: Get the first worksheet from workbook.
Worksheet sheet=workbook.Worksheets[0];
Step 3: Add a chart to worksheet based on the data from A1 to D5.
Chart chart = sheet.Charts.Add();
chart.DataRange = sheet.Range["A1:D5"];
chart.SeriesDataFromRange = false;
Step 4: Set position of chart.
chart.LeftColumn = 6;
chart.TopRow = 1;
chart.RightColumn = 12;
chart.BottomRow = 13;
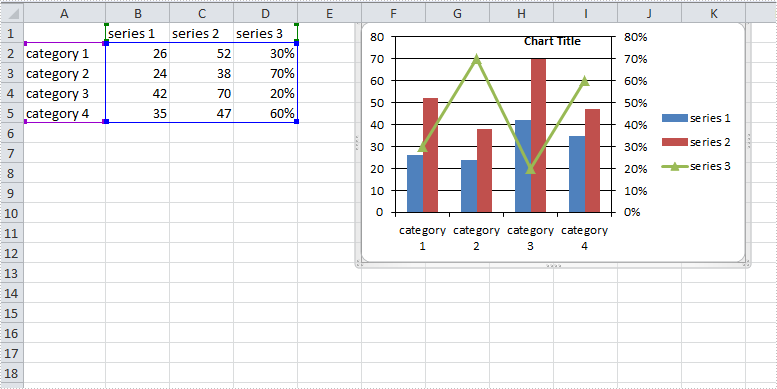
Step 5: Apply Column chart type to series 1 and series 2, apply Line chart type to series 3.
var cs1 = (ChartSerie)chart.Series[0];
cs1.SerieType = ExcelChartType.ColumnClustered;

var cs2 = (ChartSerie)chart.Series[1];
cs2.SerieType = ExcelChartType.ColumnClustered;

var cs3 = (ChartSerie)chart.Series[2];
cs3.SerieType = ExcelChartType.LineMarkers;
Step 6: Add a secondary axis to the chart, plot data of series 3 on the secondary axis.
chart.SecondaryCategoryAxis.IsMaxCross = true;
cs3.UsePrimaryAxis = false;
Step 7: Save and launch the file
workbook.SaveToFile("result.xlsx",ExcelVersion.Version2010);
System.Diagnostics.Process.Start("result.xlsx");
Result:
Full Code:
using Spire.Xls;
using Spire.Xls.Charts;
namespace CreateCombinationExcel
{
    class Program
    {

        static void Main(string[] args)
        {
            Workbook workbook = new Workbook();
            workbook.LoadFromFile("data.xlsx");
            Worksheet sheet = workbook.Worksheets[0];

            //add a chart based on the data from A1 to D5
            Chart chart = sheet.Charts.Add();
            chart.DataRange = sheet.Range["A1:D5"];
            chart.SeriesDataFromRange = false;

            //set position of chart
            chart.LeftColumn = 6;
            chart.TopRow = 1;
            chart.RightColumn = 12;
            chart.BottomRow = 13;

            //apply different chart type to different series
            var cs1 = (ChartSerie)chart.Series[0];
            cs1.SerieType = ExcelChartType.ColumnClustered;
            var cs2 = (ChartSerie)chart.Series[1];
            cs2.SerieType = ExcelChartType.ColumnClustered;
            var cs3 = (ChartSerie)chart.Series[2];
            cs3.SerieType = ExcelChartType.LineMarkers;

            //add a secondary axis to chart
            chart.SecondaryCategoryAxis.IsMaxCross = true;
            cs3.UsePrimaryAxis = false;

            //save and launch the file
            workbook.SaveToFile("result.xlsx", ExcelVersion.Version2010);
            System.Diagnostics.Process.Start("result.xlsx");
        }
    }
}
Imports Spire.Xls
Imports Spire.Xls.Charts
Namespace CreateCombinationExcel
	Class Program

		Private Shared Sub Main(args As String())
			Dim workbook As New Workbook()
			workbook.LoadFromFile("data.xlsx")
			Dim sheet As Worksheet = workbook.Worksheets(0)

			'add a chart based on the data from A1 to D5
			Dim chart As Chart = sheet.Charts.Add()
			chart.DataRange = sheet.Range("A1:D5")
			chart.SeriesDataFromRange = False

			'set position of chart
			chart.LeftColumn = 6
			chart.TopRow = 1
			chart.RightColumn = 12
			chart.BottomRow = 13

			'apply different chart type to different series
			Dim cs1 = DirectCast(chart.Series(0), ChartSerie)
			cs1.SerieType = ExcelChartType.ColumnClustered
			Dim cs2 = DirectCast(chart.Series(1), ChartSerie)
			cs2.SerieType = ExcelChartType.ColumnClustered
			Dim cs3 = DirectCast(chart.Series(2), ChartSerie)
			cs3.SerieType = ExcelChartType.LineMarkers

			'add a secondary axis to chart
			chart.SecondaryCategoryAxis.IsMaxCross = True
			cs3.UsePrimaryAxis = False

			'save and launch the file
			workbook.SaveToFile("result.xlsx", ExcelVersion.Version2010)
			System.Diagnostics.Process.Start("result.xlsx")
		End Sub
	End Class
End Namespace
