
Spire.XLS offers multiple functions to enable developers to set the font for the text for Excel chart. We have already demonstrated how to set the font for the text on legend and datalable in Excel chart by using the SetFont() in C#. This article will focus on showing how to set font for the text on Chart title and Chart Axis.
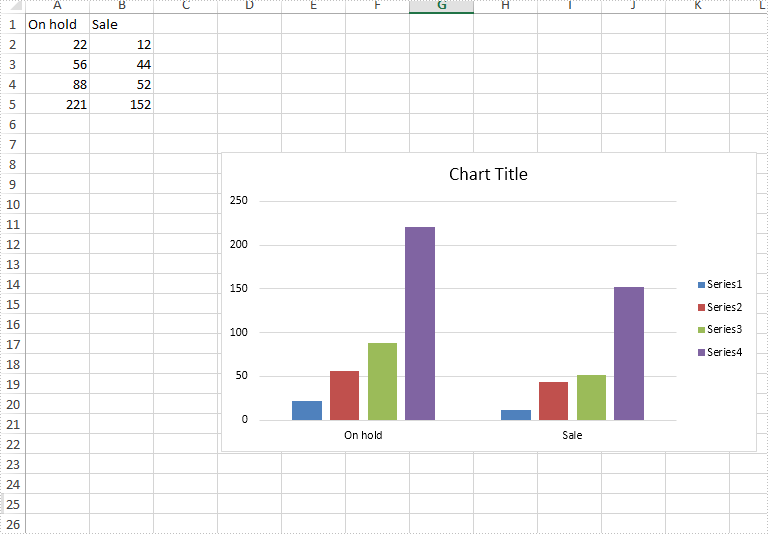
Firstly, please view the Excel worksheet with chart which the font will be changed later:
Note: Before Start, please download the latest version of Spire.XLS and add Spire.Xls.dll in the bin folder as the reference of Visual Studio.
Step 1: Create a new Excel workbook and load from file.
Workbook workbook = new Workbook();
workbook.LoadFromFile("Sample.xlsx");
Step 2: Get the first worksheet from workbook.
Worksheet worksheet = workbook.Worksheets[0];
Spire.Xls.Chart chart = worksheet.Charts[0];
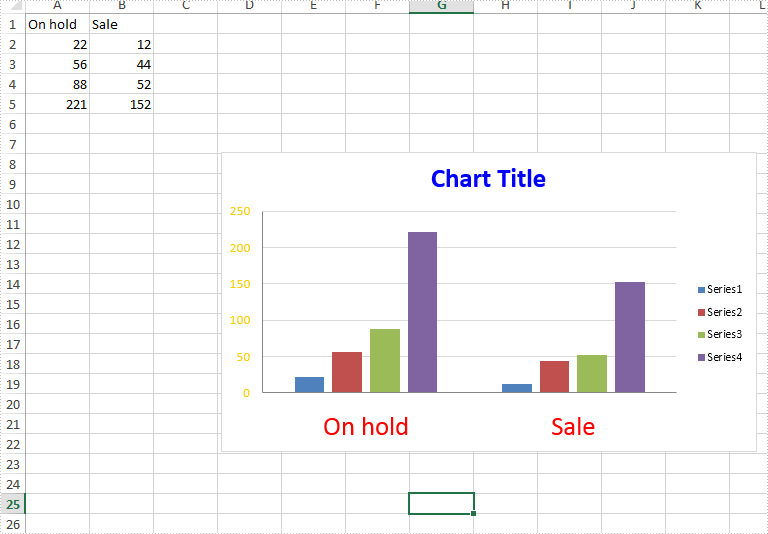
Step 3: Format the font for the chart title.
chart.ChartTitleArea.Font.Color = Color.Blue;
chart.ChartTitleArea.Font.Size = 20.0;
Step 4: Format the font for the chart Axis.
chart.PrimaryValueAxis.Font.Color = Color.Gold;
chart.PrimaryValueAxis.Font.Size = 10.0;

chart.PrimaryCategoryAxis.Font.Color = Color.Red;
chart.PrimaryCategoryAxis.Font.Size = 20.0;
Step 5: Save the document to file.
workbook.SaveToFile("result.xlsx", FileFormat.Version2010);
Effective screenshot after formatting the font for the chart title and chart axis.
Full codes:
using Spire.Xls;
using System.Drawing;
namespace SetFont
{

    class Program
    {

        static void Main(string[] args)
        {
            Workbook workbook = new Workbook();
            workbook.LoadFromFile("Sample.xlsx");

            Worksheet worksheet = workbook.Worksheets[0];
            Spire.Xls.Chart chart = worksheet.Charts[0];

            chart.ChartTitleArea.Font.Color = Color.Blue;
            chart.ChartTitleArea.Font.Size = 20.0;

            chart.PrimaryValueAxis.Font.Color = Color.Gold;
            chart.PrimaryValueAxis.Font.Size = 10.0;

            chart.PrimaryCategoryAxis.Font.Color = Color.Red;
            chart.PrimaryCategoryAxis.Font.Size = 20.0;

            workbook.SaveToFile("result.xlsx", FileFormat.Version2010);

        }

    }
}
