Apart from creating chart with continuous data range, Spire.XLS also supports to create chart with discontinuous data range by calling the XlsRange.AddCombinedRange(CellRange cr) method. This example explains a quick solution of how to achieve this task in C# with the help of Spire.XLS.
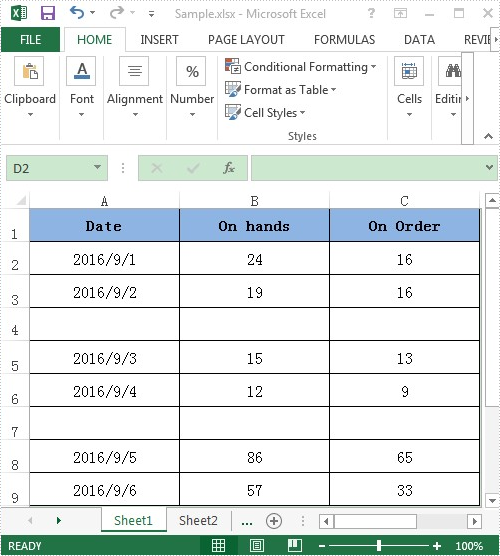
For demonstration, here we used a template excel document, in which you can see there are some blank rows among the data, in other words, the data range is discontinuous.
Here comes to the detail steps:
Step 1: Instantiate a Wordbook object, load the excel document and get its first worksheet.
Workbook book = new Workbook();
book.LoadFromFile("Sample.xlsx");
Worksheet sheet = book.Worksheets[0];
Step 2: Add a column chart to the first worksheet and set the position of the chart.
Chart chart = sheet.Charts.Add(ExcelChartType.ColumnClustered);
chart.SeriesDataFromRange = false;
//Set chart position
chart.LeftColumn = 5;
chart.TopRow = 1;
chart.RightColumn = 13;
chart.BottomRow = 10;
Step 3: Add two series to the chart, set data source for category labels and values of the series with discontinuous data range.
//Add the first series
var cs1 = (ChartSerie)chart.Series.Add();
//Set name of the serie
cs1.Name = sheet.Range["B1"].Value;
//Set data source for Category Labels and Values of the serie with discontinuous data range
cs1.CategoryLabels = sheet.Range["A2:A3"].AddCombinedRange(sheet.Range["A5:A6"]).AddCombinedRange(sheet.Range["A8:A9"]);
cs1.Values = sheet.Range["B2:B3"].AddCombinedRange(sheet.Range["B5:B6"]).AddCombinedRange(sheet.Range["B8:B9"]);
//Specify the serie type
cs1.SerieType = ExcelChartType.ColumnClustered;

//Add the second series
var cs2 = (ChartSerie)chart.Series.Add();
cs2.Name = sheet.Range["C1"].Value;
cs2.CategoryLabels = cs2.CategoryLabels = sheet.Range["A2:A3"].AddCombinedRange(sheet.Range["A5:A6"]).AddCombinedRange(sheet.Range["A8:A9"]);
cs2.Values = sheet.Range["C2:C3"].AddCombinedRange(sheet.Range["C5:C6"]).AddCombinedRange(sheet.Range["C8:C9"]);
cs2.SerieType = ExcelChartType.ColumnClustered;
Step 4: Save the excel document.
book.SaveToFile("Result.xlsx", FileFormat.Version2010);
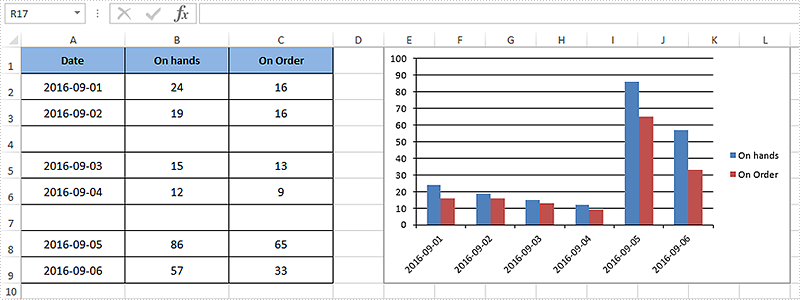
After executing the above example code, a column chart with discontinuous data range was added to the worksheet as shown below.
Full code:
using Spire.Xls;
using Spire.Xls.Charts;

namespace Assign_discontinuous_range_for_chart
{
    class Program
    {
        static void Main(string[] args)
        {
            Workbook book = new Workbook();
            book.LoadFromFile("Sample.xlsx");
            Worksheet sheet = book.Worksheets[0];

            Chart chart = sheet.Charts.Add(ExcelChartType.ColumnClustered);
            chart.SeriesDataFromRange = false;
            chart.LeftColumn = 5;
            chart.TopRow = 1;
            chart.RightColumn = 13;
            chart.BottomRow = 10;

            var cs1 = (ChartSerie)chart.Series.Add();
            cs1.Name = sheet.Range["B1"].Value;
            cs1.CategoryLabels = sheet.Range["A2:A3"].AddCombinedRange(sheet.Range["A5:A6"]).AddCombinedRange(sheet.Range["A8:A9"]);
            cs1.Values = sheet.Range["B2:B3"].AddCombinedRange(sheet.Range["B5:B6"]).AddCombinedRange(sheet.Range["B8:B9"]);
            cs1.SerieType = ExcelChartType.ColumnClustered;

            var cs2 = (ChartSerie)chart.Series.Add();
            cs2.Name = sheet.Range["C1"].Value;
            cs2.CategoryLabels = sheet.Range["A2:A3"].AddCombinedRange(sheet.Range["A5:A6"]).AddCombinedRange(sheet.Range["A8:A9"]);
            cs2.Values = sheet.Range["C2:C3"].AddCombinedRange(sheet.Range["C5:C6"]).AddCombinedRange(sheet.Range["C8:C9"]);
            cs2.SerieType = ExcelChartType.ColumnClustered;

            chart.ChartTitle = string.Empty;

            book.SaveToFile("Result.xlsx", FileFormat.Version2010);
            System.Diagnostics.Process.Start("Result.xlsx");
        }
    }
}
