This article will show you how to use Spire.XLS for .NET to create a bubble chart in Excel in C# and VB.NET.
C#
using Spire.Xls;

namespace BubbleChart
{
    class Program
    {
        static void Main(string[] args)

        {
            //Create a new workbook
            Workbook workbook = new Workbook();

            //Add a worksheet and set name
            workbook.CreateEmptySheets(1);
            Worksheet sheet = workbook.Worksheets[0];
            sheet.Name = "Chart data";
            //Initialize chart and set its type
            Chart chart = sheet.Charts.Add(ExcelChartType.Bubble);

            //Set the position of the chart in the worksheet
            chart.LeftColumn = 1;
            chart.RightColumn = 10;
            chart.TopRow = 1;
            chart.BottomRow = 20;

            //Set title for the chart and values
            Spire.Xls.Charts.ChartSerie cs1 = chart.Series.Add("Bubble Chart");
            cs1.EnteredDirectlyValues = new object[] { 2.2, 5.6 };
            cs1.EnteredDirectlyCategoryLabels = new object[] { 1.1, 4.4 };
            cs1.EnteredDirectlyBubbles = new object[] { 3, 6 };

            //Save the document to file
            workbook.SaveToFile("Output.xlsx", ExcelVersion.Version2010);
        }
    }

}
VB.NET
Imports Spire.Xls

Namespace BubbleChart

    Class Program

        Private Shared Sub Main(ByVal args() As String)
            'Create a new workbook
            Dim workbook As Workbook = New Workbook
            'Add a worksheet and set name
            workbook.CreateEmptySheets(1)
            Dim sheet As Worksheet = workbook.Worksheets(0)
            sheet.Name = "Chart data"
            'Initialize chart and set its type
            Dim chart As Chart = sheet.Charts.Add(ExcelChartType.Bubble)
            'Set the position of the chart in the worksheet
            chart.LeftColumn = 1
            chart.RightColumn = 10
            chart.TopRow = 1
            chart.BottomRow = 20
            'Set title for the chart and values
            Dim cs1 As Spire.Xls.Charts.ChartSerie = chart.Series.Add("Bubble Chart")
            cs1.EnteredDirectlyValues = New Object() {2.2, 5.6}
            cs1.EnteredDirectlyCategoryLabels = New Object() {1.1, 4.4}
            cs1.EnteredDirectlyBubbles = New Object() {3, 6}
            'Save the document to file
            workbook.SaveToFile("Output.xlsx", ExcelVersion.Version2010)
        End Sub
    End Class
End Namespace
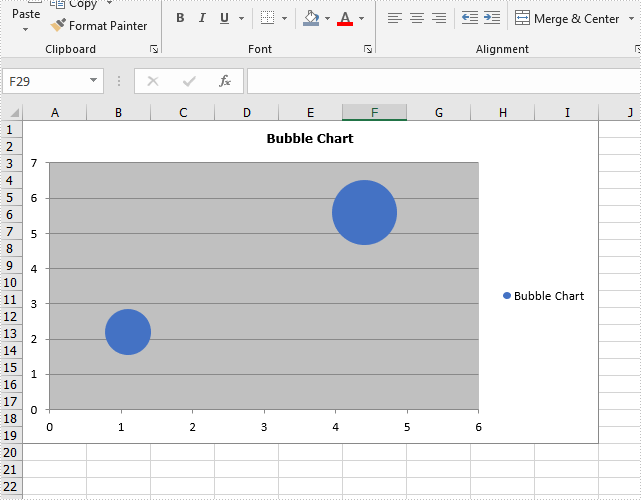
Effective screenshot of Excel Bubble chart: