
The different border color and styles on the Excel Chart can distinguish the chart categories easily. Spire.XLS offers a property of LineProperties to enables developers to set the color and styles for the data point. This article is going to introduce the method of how to format data series for Excel charts in C# using Spire.XLS.
Note: Before Start, please download the latest version of Spire.XLS and add Spire.xls.dll in the bin folder as the reference of Visual Studio.
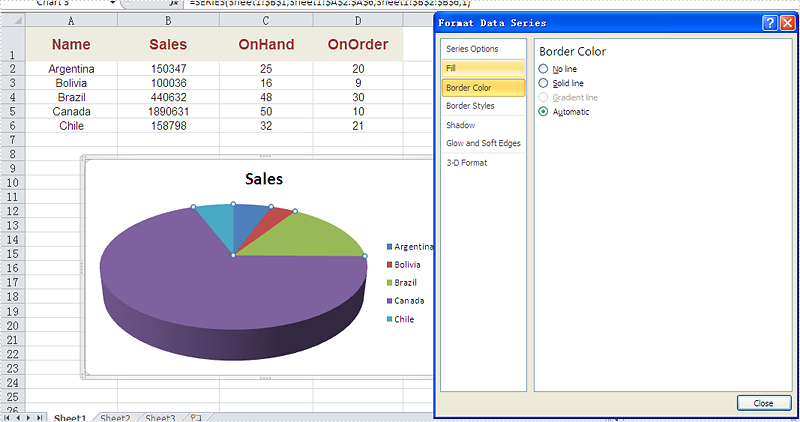
Firstly, please check the original screenshot of excel chart with the automatic setting for border.
Code Snippet of how to set the border color and border styles for Excel chart data series.
Step 1: Create a new workbook and load from file.
Workbook workbook = new Workbook();
workbook.LoadFromFile("sample.xlsx");
Step 2: Get the first worksheet from workbook and then get the first chart from the worksheet.
Worksheet ws = workbook.Worksheets[0];
Chart chart = ws.Charts[0];
Step 3: Set CustomLineWeight property for Series line.
(chart.Series[0].DataPoints[0].DataFormat.LineProperties as XlsChartBorder).CustomLineWeight = 1.5f;
Step 4: Set Color property for Series line.
(chart.Series[0].DataPoints[0].DataFormat.LineProperties as XlsChartBorder).Color = Color.Red;
Step 5: Save the document to file.
workbook.SaveToFile("result.xlsx", FileFormat.Version2013);
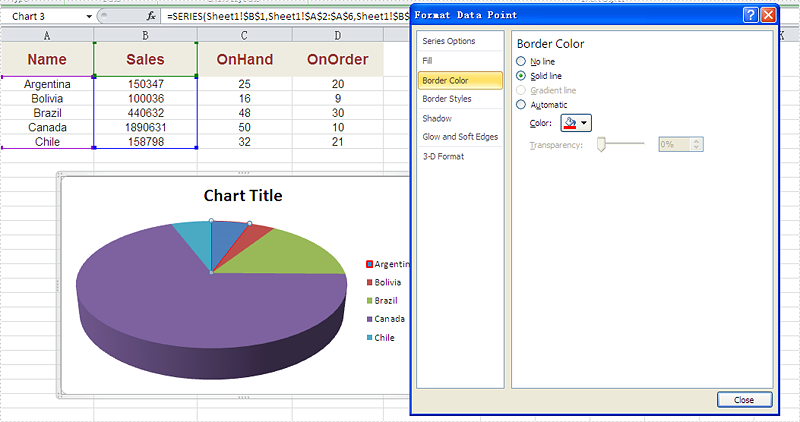
Effective screenshot after set the color and width of excel chart border.
Full codes:
using Spire.Xls;
using Spire.Xls.Charts;
using Spire.Xls.Core.Spreadsheet.Charts;
using System.Drawing;
namespace SetBoarderColor
{

    class Program
    {

        static void Main(string[] args)
        {
            Workbook workbook = new Workbook();
            workbook.LoadFromFile("sample.xlsx");
            Worksheet ws = workbook.Worksheets[0];
            Chart chart = ws.Charts[0];

            (chart.Series[0].DataPoints[0].DataFormat.LineProperties as XlsChartBorder).CustomLineWeight = 1.5f;
            (chart.Series[0].DataPoints[0].DataFormat.LineProperties as XlsChartBorder).Color = Color.Red;

            workbook.SaveToFile("result.xlsx", FileFormat.Version2013);


        }
    }
}
