
Gridlines are often added to charts to help improve the readability of the chart itself, but it is not a necessary to display the gridlines in every chart especially when we do not need to know the exact value of each data point from graphic. This article will present how to hide gridlines in Excel chart using Spire.XLS.
Code Snippet:
Step 1: Initialize a new instance of Workbook class and load a sample Excel file that contains some data in A1 to C5.
Workbook workbook = new Workbook();
workbook.LoadFromFile("data.xlsx");
Step 2: Create a Column chart based on the data in cell range A1 to C5.
Worksheet sheet = workbook.Worksheets[0];
Chart chart = sheet.Charts.Add(ExcelChartType.ColumnClustered);
chart.DataRange = sheet.Range["A1:C5"];
chart.SeriesDataFromRange = false;
Step 3: Set chart position.
chart.LeftColumn = 1;
chart.TopRow = 6;
chart.RightColumn = 8
chart.BottomRow = 19;
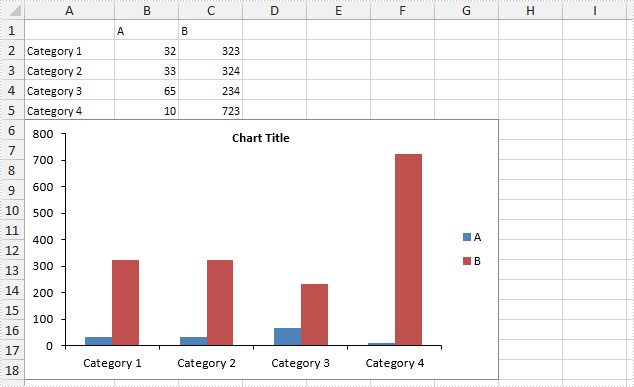
Step 4: Set the PrimaryValueAxis.HasMajorGridLines property to false.
chart.PrimaryValueAxis.HasMajorGridLines = false;
Step 5: Save and launch the file.
workbook.SaveToFile("result.xlsx", ExcelVersion.Version2010);
System.Diagnostics.Process.Start("result.xlsx");
Output:
Full Code:
[C#]
using Spire.Xls;
namespace HideGridLine
{

    class Program
    {

        static void Main(string[] args)
        {
            Workbook workbook = new Workbook();
            workbook.LoadFromFile("data.xlsx");

            Worksheet sheet = workbook.Worksheets[0];
            Chart chart = sheet.Charts.Add(ExcelChartType.ColumnClustered);
            chart.DataRange = sheet.Range["A1:C5"];
            chart.SeriesDataFromRange = false;
            chart.LeftColumn = 1;
            chart.TopRow = 6;
            chart.RightColumn = 8;
            chart.BottomRow = 19;

            chart.PrimaryValueAxis.HasMajorGridLines = false;

            workbook.SaveToFile("result.xlsx", ExcelVersion.Version2010);
            System.Diagnostics.Process.Start("result.xlsx");
        }

    }
}
[VB.NET]
Imports Spire.Xls
Namespace HideGridLine

	Class Program

		Private Shared Sub Main(args As String())
			Dim workbook As New Workbook()
			workbook.LoadFromFile("data.xlsx")

			Dim sheet As Worksheet = workbook.Worksheets(0)
			Dim chart As Chart = sheet.Charts.Add(ExcelChartType.ColumnClustered)
			chart.DataRange = sheet.Range("A1:C5")
			chart.SeriesDataFromRange = False
			chart.LeftColumn = 1
			chart.TopRow = 6
			chart.RightColumn = 8
			chart.BottomRow = 19

			chart.PrimaryValueAxis.HasMajorGridLines = False

			workbook.SaveToFile("result.xlsx", ExcelVersion.Version2010)
			System.Diagnostics.Process.Start("result.xlsx")
		End Sub

	End Class
End Namespace
