
Knowledgebase (2523)
Children categories
The sample demonstrates how to convert Excel workbook to PDF file via Spire.XLS.
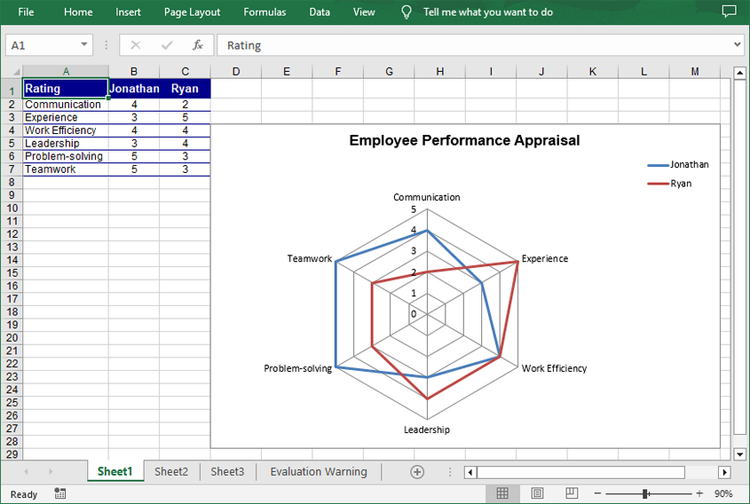
Excel radar charts, also known as spider charts or web charts, are used to compare multiple data series in different categories. By plotting data points on a multi-axis chart, radar charts provide a clear and intuitive representation of data balance and skewness. This makes them particularly useful for visualizing performance metrics, market analysis, and other situations where multiple dimensions need to be compared. In this article, you will learn how to create a radar chart in Excel in C# using Spire.XLS for .NET.
Install Spire.XLS for .NET
To begin with, you need to add the DLL files included in the Spire.XLS for .NET package as references in your .NET project. The DLL files can be either downloaded from this link or installed via NuGet.
PM> Install-Package Spire.XLS
Create a Simple Radar Chart in Excel in C#
Spire.XLS for .NET provides the Worksheet.Charts.Add(ExcelChartType.Radar) method to add a standard radar chart to an Excel worksheet. The following are the detailed steps:
- Create a Workbook instance.
- Get a specified worksheet using Workbook.Worksheets[sheetIndex] property.
- Add the chart data to specified cells and set the cell styles.
- Add a simple radar chart to the worksheet using Worksheet.Charts.Add(ExcelChartType.Radar) method.
- Set data range for the chart using Chart.DataRange property.
- Set the position, legend and title of the chart.
- Save the result file using Workbook.SaveToFile() method.
- C#
using Spire.Xls;
using System.Drawing;

namespace ExcelRadarChart
{
    class Program
    {
        static void Main(string[] args)
        {
            //Create a Workbook instance
            Workbook workbook = new Workbook();

            //Get the first worksheet
            Worksheet sheet = workbook.Worksheets[0];

            //Add chart data to specified cells
            sheet.Range["A1"].Value = "Rating";
            sheet.Range["A2"].Value = "Communication";
            sheet.Range["A3"].Value = "Experience";
            sheet.Range["A4"].Value = "Work Efficiency";
            sheet.Range["A5"].Value = "Leadership";
            sheet.Range["A6"].Value = "Problem-solving";
            sheet.Range["A7"].Value = "Teamwork";

            sheet.Range["B1"].Value = "Jonathan";
            sheet.Range["B2"].NumberValue = 4;
            sheet.Range["B3"].NumberValue = 3;
            sheet.Range["B4"].NumberValue = 4;
            sheet.Range["B5"].NumberValue = 3;
            sheet.Range["B6"].NumberValue = 5;
            sheet.Range["B7"].NumberValue = 5;

            sheet.Range["C1"].Value = "Ryan";
            sheet.Range["C2"].NumberValue = 2;
            sheet.Range["C3"].NumberValue = 5;
            sheet.Range["C4"].NumberValue = 4;
            sheet.Range["C5"].NumberValue = 4;
            sheet.Range["C6"].NumberValue = 3;
            sheet.Range["C7"].NumberValue = 3;

            //Set font styles
            sheet.Range["A1:C1"].Style.Font.IsBold = true;
            sheet.Range["A1:C1"].Style.Font.Size = 11;
            sheet.Range["A1:C1"].Style.Font.Color = Color.White;

            //Set row height and column width
            sheet.Rows[0].RowHeight = 20;
            sheet.Range["A1:C7"].Columns[0].ColumnWidth = 15;

            //Set cell styles
            sheet.Range["A1:C1"].Style.Color = Color.DarkBlue;
            sheet.Range["A2:C7"].Borders[BordersLineType.EdgeBottom].LineStyle = LineStyleType.Thin;
            sheet.Range["A2:C7"].Style.Borders[BordersLineType.EdgeBottom].Color = Color.DarkBlue;
            sheet.Range["B1:C7"].HorizontalAlignment = HorizontalAlignType.Center;
            sheet.Range["A1:C7"].VerticalAlignment = VerticalAlignType.Center;

            //Add a radar chart to the worksheet
            Chart chart = sheet.Charts.Add(ExcelChartType.Radar);

            //Set position of chart
            chart.LeftColumn = 4;
            chart.TopRow = 4;
            chart.RightColumn = 14;
            chart.BottomRow = 29;

            //Set data range for the chart
            chart.DataRange = sheet.Range["A1:C7"];
            chart.SeriesDataFromRange = false;

            //Set and format chart title
            chart.ChartTitle = "Employee Performance Appraisal";
            chart.ChartTitleArea.IsBold = true;
            chart.ChartTitleArea.Size = 14;

            //Set position of chart legend
            chart.Legend.Position = LegendPositionType.Corner;

            //Save the result file
            workbook.SaveToFile("ExcelRadarChart.xlsx", ExcelVersion.Version2016);

        }
    }
}
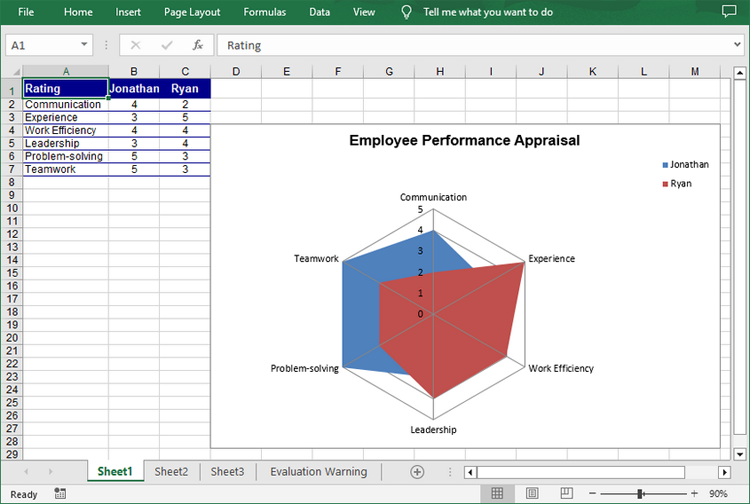
Create a Filled Radar Chart in Excel in C#
A filled radar chart is a variation of a standard radar chart, with the difference that the area between each data point is filled with color. The following are the steps to create a filled radar chart using C#:
- Create a Workbook instance.
- Get a specified worksheet using Workbook.Worksheets[sheetIndex] property.
- Add the chart data to specified cells and set the cell styles.
- Add a filled radar chart to the worksheet using Worksheet.Charts.Add(ExcelChartType.RadarFilled) method.
- Set data range for the chart using Chart.DataRange property.
- Set the position, legend and title of the chart.
- Save the result file using Workbook.SaveToFile() method.
- C#
using Spire.Xls;
using System.Drawing;

namespace ExcelRadarChart
{
    class Program
    {
        static void Main(string[] args)
        {
            //Create a Workbook instance
            Workbook workbook = new Workbook();

            //Get the first worksheet
            Worksheet sheet = workbook.Worksheets[0];

            //Add chart data to specified cells
            sheet.Range["A1"].Value = "Rating";
            sheet.Range["A2"].Value = "Communication";
            sheet.Range["A3"].Value = "Experience";
            sheet.Range["A4"].Value = "Work Efficiency";
            sheet.Range["A5"].Value = "Leadership";
            sheet.Range["A6"].Value = "Problem-solving";
            sheet.Range["A7"].Value = "Teamwork";

            sheet.Range["B1"].Value = "Jonathan";
            sheet.Range["B2"].NumberValue = 4;
            sheet.Range["B3"].NumberValue = 3;
            sheet.Range["B4"].NumberValue = 4;
            sheet.Range["B5"].NumberValue = 3;
            sheet.Range["B6"].NumberValue = 5;
            sheet.Range["B7"].NumberValue = 5;

            sheet.Range["C1"].Value = "Ryan";
            sheet.Range["C2"].NumberValue = 2;
            sheet.Range["C3"].NumberValue = 5;
            sheet.Range["C4"].NumberValue = 4;
            sheet.Range["C5"].NumberValue = 4;
            sheet.Range["C6"].NumberValue = 3;
            sheet.Range["C7"].NumberValue = 3;

            //Set font styles
            sheet.Range["A1:C1"].Style.Font.IsBold = true;
            sheet.Range["A1:C1"].Style.Font.Size = 11;
            sheet.Range["A1:C1"].Style.Font.Color = Color.White;

            //Set row height and column width
            sheet.Rows[0].RowHeight = 20;
            sheet.Range["A1:C7"].Columns[0].ColumnWidth = 15;

            //Set cell styles
            sheet.Range["A1:C1"].Style.Color = Color.DarkBlue;
            sheet.Range["A2:C7"].Borders[BordersLineType.EdgeBottom].LineStyle = LineStyleType.Thin;
            sheet.Range["A2:C7"].Style.Borders[BordersLineType.EdgeBottom].Color = Color.DarkBlue;
            sheet.Range["B1:C7"].HorizontalAlignment = HorizontalAlignType.Center;
            sheet.Range["A1:C7"].VerticalAlignment = VerticalAlignType.Center;

            //Add a filled radar chart to the worksheet
            Chart chart = sheet.Charts.Add(ExcelChartType.RadarFilled);

            //Set position of chart
            chart.LeftColumn = 4;
            chart.TopRow = 4;
            chart.RightColumn = 14;
            chart.BottomRow = 29;

            //Set data range for the chart
            chart.DataRange = sheet.Range["A1:C7"];
            chart.SeriesDataFromRange = false;

            //Set and format chart title
            chart.ChartTitle = "Employee Performance Appraisal";
            chart.ChartTitleArea.IsBold = true;
            chart.ChartTitleArea.Size = 14;

            //Set position of chart legend
            chart.Legend.Position = LegendPositionType.Corner;

            //Save the result file
            workbook.SaveToFile("FilledRadarChart.xlsx", ExcelVersion.Version2016);

        }
    }
}
Apply for a Temporary License
If you'd like to remove the evaluation message from the generated documents, or to get rid of the function limitations, please request a 30-day trial license for yourself.
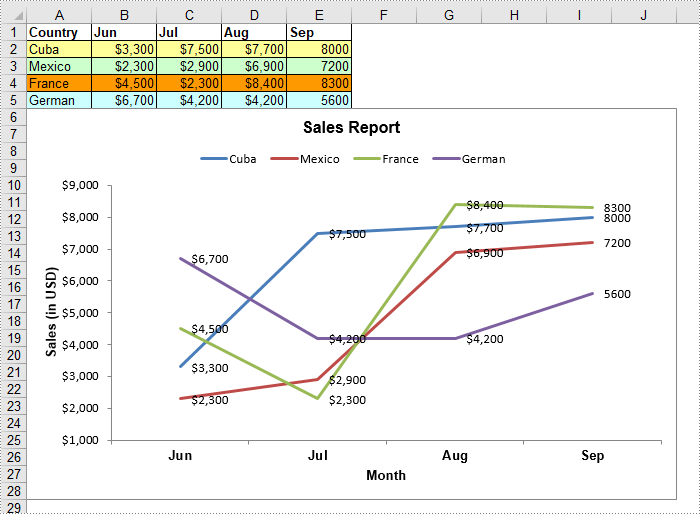
A line chart, also known as a line graph, is a type of chart that displays information as a series of data points connected by straight line segments. It is generally used to show the changes of information over a period of time, such as years, months or days. In this article, you will learn how to create a line chart in Excel in C# and VB.NET using Spire.XLS for .NET.
Install Spire.XLS for .NET
To begin with, you need to add the DLL files included in the Spire.XLS for .NET package as references in your .NET project. The DLL files can be either downloaded from this link or installed via NuGet.
PM> Install-Package Spire.XLS
Create a Line Chart in Excel using C# and VB.NET
The following are the main steps to create a line chart:
- Create an instance of Workbook class.
- Get the first worksheet by its index (zero-based) though Workbook.Worksheets[sheetIndex] property.
- Add some data to the worksheet.
- Add a line chart to the worksheet using Worksheet.Charts.Add(ExcelChartType.Line) method.
- Set data range for the chart through Chart.DataRange property.
- Set position, title, category axis title and value axis title for the chart.
- Loop through the data series of the chart, show data labels for the data points of each data series by setting the ChartSerie.DataPoints.DefaultDataPoint.DataLabels.HasValue property as true.
- Set the position of chart legend through Chart.Legend.Position property.
- Save the result file using Workbook.SaveToFile() method.
- C#
- VB.NET
using Spire.Xls;
using Spire.Xls.Charts;
using System.Drawing;

namespace CreateLineChart
{
    class Program
    {
        static void Main(string[] args)
        {
            //Create a Workbook instance
            Workbook workbook = new Workbook();

            //Get the first worksheet
            Worksheet sheet = workbook.Worksheets[0];
            //Set sheet name
            sheet.Name = "Line Chart";
            //Hide gridlines
            sheet.GridLinesVisible = false;

            //Add some data to the the worksheet
            sheet.Range["A1"].Value = "Country";
            sheet.Range["A2"].Value = "Cuba";
            sheet.Range["A3"].Value = "Mexico";
            sheet.Range["A4"].Value = "France";
            sheet.Range["A5"].Value = "German";

            sheet.Range["B1"].Value = "Jun";
            sheet.Range["B2"].NumberValue = 3300;
            sheet.Range["B3"].NumberValue = 2300;
            sheet.Range["B4"].NumberValue = 4500;
            sheet.Range["B5"].NumberValue = 6700;

            sheet.Range["C1"].Value = "Jul";
            sheet.Range["C2"].NumberValue = 7500;
            sheet.Range["C3"].NumberValue = 2900;
            sheet.Range["C4"].NumberValue = 2300;
            sheet.Range["C5"].NumberValue = 4200;

            sheet.Range["D1"].Value = "Aug";
            sheet.Range["D2"].NumberValue = 7700;
            sheet.Range["D3"].NumberValue = 6900;
            sheet.Range["D4"].NumberValue = 8400;
            sheet.Range["D5"].NumberValue = 4200;

            sheet.Range["E1"].Value = "Sep";
            sheet.Range["E2"].NumberValue = 8000;
            sheet.Range["E3"].NumberValue = 7200;
            sheet.Range["E4"].NumberValue = 8300;
            sheet.Range["E5"].NumberValue = 5600;

            //Set font and fill color for specified cells
            sheet.Range["A1:E1"].Style.Font.IsBold = true;
            sheet.Range["A2:E2"].Style.KnownColor = ExcelColors.LightYellow;
            sheet.Range["A3:E3"].Style.KnownColor = ExcelColors.LightGreen1;
            sheet.Range["A4:E4"].Style.KnownColor = ExcelColors.LightOrange;
            sheet.Range["A5:E5"].Style.KnownColor = ExcelColors.LightTurquoise;

            //Set cell borders
            sheet.Range["A1:E5"].Style.Borders[BordersLineType.EdgeTop].Color = Color.FromArgb(0, 0, 128);
            sheet.Range["A1:E5"].Style.Borders[BordersLineType.EdgeTop].LineStyle = LineStyleType.Thin;
            sheet.Range["A1:E5"].Style.Borders[BordersLineType.EdgeBottom].Color = Color.FromArgb(0, 0, 128);
            sheet.Range["A1:E5"].Style.Borders[BordersLineType.EdgeBottom].LineStyle = LineStyleType.Thin;
            sheet.Range["A1:E5"].Style.Borders[BordersLineType.EdgeLeft].Color = Color.FromArgb(0, 0, 128);
            sheet.Range["A1:E5"].Style.Borders[BordersLineType.EdgeLeft].LineStyle = LineStyleType.Thin;
            sheet.Range["A1:E5"].Style.Borders[BordersLineType.EdgeRight].Color = Color.FromArgb(0, 0, 128);
            sheet.Range["A1:E5"].Style.Borders[BordersLineType.EdgeRight].LineStyle = LineStyleType.Thin;

            //Set number format
            sheet.Range["B2:D5"].Style.NumberFormat = "\"$\"#,##0";

            //Add a line chart to the worksheet
            Chart chart = sheet.Charts.Add(ExcelChartType.Line);

            //Set data range for the chart
            chart.DataRange = sheet.Range["A1:E5"];

            //Set position of the chart
            chart.LeftColumn = 1;
            chart.TopRow = 6;
            chart.RightColumn = 11;
            chart.BottomRow = 29;

            //Set and format chart title
            chart.ChartTitle = "Sales Report";
            chart.ChartTitleArea.IsBold = true;
            chart.ChartTitleArea.Size = 12;

            //Set and format category axis title
            chart.PrimaryCategoryAxis.Title = "Month";
            chart.PrimaryCategoryAxis.Font.IsBold = true;
            chart.PrimaryCategoryAxis.TitleArea.IsBold = true;

            //Set and format value axis title
            chart.PrimaryValueAxis.Title = "Sales (in USD)";
            chart.PrimaryValueAxis.HasMajorGridLines = false;
            chart.PrimaryValueAxis.TitleArea.TextRotationAngle = -90;
            chart.PrimaryValueAxis.MinValue = 1000;
            chart.PrimaryValueAxis.TitleArea.IsBold = true;

            //Loop through the data series of the chart
            foreach (ChartSerie cs in chart.Series)
            {
                cs.Format.Options.IsVaryColor = true;
                //Show data labels for data points
                cs.DataPoints.DefaultDataPoint.DataLabels.HasValue = true;
            }

            //Set position of chart legend
            chart.Legend.Position = LegendPositionType.Top;

            //Save the result file
            workbook.SaveToFile("LineChart.xlsx", ExcelVersion.Version2016);
        }
    }
}
Apply for a Temporary License
If you'd like to remove the evaluation message from the generated documents, or to get rid of the function limitations, please request a 30-day trial license for yourself.
