Monday, 25 July 2011 09:12
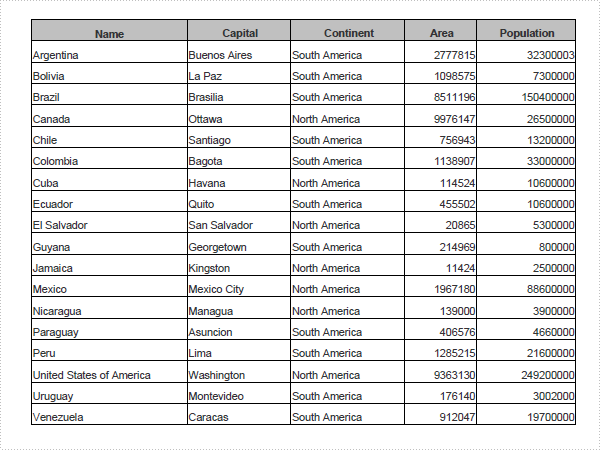
XLS to PDF in C#, VB.NET
The sample demonstrates how to convert Excel workbook to PDF file via Spire.XLS.
static void Main()
{
    Spire.Xls.Workbook workbook = new Spire.Xls.Workbook();

    workbook.LoadFromFile(@"DataTableSample.xls");

    Spire.Xls.Converter.PdfConverter pdfConverter
        = new Spire.Xls.Converter.PdfConverter(workbook);
    Spire.Pdf.PdfDocument pdfDocument = new Spire.Pdf.PdfDocument();
    Spire.Xls.Converter.PdfConverterSettings settings
        = new Spire.Xls.Converter.PdfConverterSettings();
    settings.EmbedFonts = true;
    settings.TemplateDocument = pdfDocument;
    pdfDocument = pdfConverter.Convert(settings);

    pdfDocument.SaveToFile("XLS-to-PDF.pdf");
    pdfDocument.Close();
}
Shared Sub Main()
    Dim workbook As New Spire.Xls.Workbook()

    workbook.LoadFromFile("DataTableSample.xls")

    Dim pdfConverter As New Spire.Xls.Converter.PdfConverter(workbook)
    Dim pdfDocument As New Spire.Pdf.PdfDocument()
    Dim settings As New Spire.Xls.Converter.PdfConverterSettings()
    settings.EmbedFonts = True
    settings.TemplateDocument = pdfDocument
    pdfDocument = pdfConverter.Convert(settings)

    pdfDocument.SaveToFile("XLS-to-PDF.pdf")
    pdfDocument.Close()
End Sub
Published in
Misc
Thursday, 01 July 2010 14:22
EXCEL Interior in C#, VB.NET
The sample demonstrates how to write excel 2007 workbook.
		private void ExcelDocViewer( string fileName )
		{
			try
			{
				System.Diagnostics.Process.Start(fileName);
			}
			catch{}
		}

		private void btnRun_Click(object sender, System.EventArgs e)
		{
			Workbook workbook = new Workbook();
			Worksheet sheet = workbook.Worksheets[0];
			workbook.Version = ExcelVersion.Version2007;


			int maxColor = Enum.GetValues(typeof(ExcelColors)).Length;
			Random random = new Random((int)System.DateTime.Now.Ticks);
			for (int i = 2; i < 40; i++)
			{

			ExcelColors backKnownColor = (ExcelColors)(random.Next(1,maxColor / 2));

			sheet.Range["A1"].Text = "Color Name";
			sheet.Range["B1"].Text = "Red";
			sheet.Range["C1"].Text = "Green";
			sheet.Range["D1"].Text = "Blue";
			sheet.Range["E1:K1"].Merge();
			sheet.Range["E1:K1"].Text = "Gradient";
			sheet.Range["A1:K1"].Style.Font.IsBold = true;
			sheet.Range["A1:K1"].Style.Font.Size = 11;

			string colorName = backKnownColor.ToString();
			sheet.Range[string.Format("A{0}",i)].Text = colorName;
			sheet.Range[string.Format("B{0}", i)].Text = workbook.GetPaletteColor(backKnownColor).R.ToString();
			sheet.Range[string.Format("C{0}", i)].Text = workbook.GetPaletteColor(backKnownColor).G.ToString();
			sheet.Range[string.Format("D{0}", i)].Text = workbook.GetPaletteColor(backKnownColor).B.ToString();

			sheet.Range[string.Format("E{0}:K{0}",i)].Merge();
			sheet.Range[string.Format("E{0}:K{0}", i)].Text = colorName;
			sheet.Range[string.Format("E{0}:K{0}", i)].Style.Interior.FillPattern = ExcelPatternType.Gradient;
			sheet.Range[string.Format("E{0}:K{0}", i)].Style.Interior.Gradient.BackKnownColor = backKnownColor;
			sheet.Range[string.Format("E{0}:K{0}", i)].Style.Interior.Gradient.ForeKnownColor = ExcelColors.White;
			sheet.Range[string.Format("E{0}:K{0}", i)].Style.Interior.Gradient.GradientStyle = GradientStyleType.Vertical;
			sheet.Range[string.Format("E{0}:K{0}", i)].Style.Interior.Gradient.GradientVariant = GradientVariantsType.ShadingVariants1;
			}

			sheet.AutoFitColumn(1);

			workbook.SaveToFile("Sample.xlsx");

			ExcelDocViewer(workbook.FileName);
		}
		Private Sub ExcelDocViewer(ByVal fileName As String)
			Try
				System.Diagnostics.Process.Start(fileName)
			Catch
			End Try
		End Sub

		Private Sub btnRun_Click(ByVal sender As Object, ByVal e As System.EventArgs) Handles btnRun.Click
			Dim workbook As New Workbook()
			Dim sheet As Worksheet = workbook.Worksheets(0)

			workbook.Version = ExcelVersion.Version2007


			Dim maxColor As Integer = System.Enum.GetValues(GetType(ExcelColors)).Length
            Dim random As New Random()
			For i As Integer = 2 To 39

				Dim backKnownColor As ExcelColors = CType(random.Next(1,maxColor \ 2), ExcelColors)

				sheet.Range("A1").Text = "Color Name"
				sheet.Range("B1").Text = "Red"
				sheet.Range("C1").Text = "Green"
				sheet.Range("D1").Text = "Blue"
				sheet.Range("E1:K1").Merge()
				sheet.Range("E1:K1").Text = "Gradient"
				sheet.Range("A1:K1").Style.Font.IsBold = True
				sheet.Range("A1:K1").Style.Font.Size = 11

				Dim colorName As String = backKnownColor.ToString()
				sheet.Range(String.Format("A{0}",i)).Text = colorName
				sheet.Range(String.Format("B{0}", i)).Text = workbook.GetPaletteColor(backKnownColor).R.ToString()
				sheet.Range(String.Format("C{0}", i)).Text = workbook.GetPaletteColor(backKnownColor).G.ToString()
				sheet.Range(String.Format("D{0}", i)).Text = workbook.GetPaletteColor(backKnownColor).B.ToString()

				sheet.Range(String.Format("E{0}:K{0}",i)).Merge()
				sheet.Range(String.Format("E{0}:K{0}", i)).Text = colorName
				sheet.Range(String.Format("E{0}:K{0}", i)).Style.Interior.FillPattern = ExcelPatternType.Gradient
				sheet.Range(String.Format("E{0}:K{0}", i)).Style.Interior.Gradient.BackKnownColor = backKnownColor
				sheet.Range(String.Format("E{0}:K{0}", i)).Style.Interior.Gradient.ForeKnownColor = ExcelColors.White
				sheet.Range(String.Format("E{0}:K{0}", i)).Style.Interior.Gradient.GradientStyle = GradientStyleType.Vertical
				sheet.Range(String.Format("E{0}:K{0}", i)).Style.Interior.Gradient.GradientVariant = GradientVariantsType.ShadingVariants1
			Next i

			sheet.AutoFitColumn(1)

			workbook.SaveToFile("Sample.xlsx")

			ExcelDocViewer(workbook.FileName)
		End Sub
Published in
Excel2007
Saturday, 03 July 2010 10:17
EXCEL Pagesetup in C#, VB.NET
The sample demonstrates how to work with page setup in an excel workbook.
		private void btnRun_Click(object sender, System.EventArgs e)
		{
			Workbook workbook = new Workbook();

			//Initialize worksheet
			workbook.CreateEmptySheets(1);
			Worksheet sheet = workbook.Worksheets[0];
			sheet.GridLinesVisible = false;

			//Writes sample data
			CreateSampleData(sheet);

			//Sets page setup properties
			sheet.PageSetup.Orientation = PageOrientationType.Landscape;
			sheet.PageSetup.PaperSize = PaperSizeType.PaperA3;

			//Sets page break
			sheet.VPageBreaks.Add(sheet.Range["A5"]);
			sheet.HPageBreaks.Add(sheet.Range["C6"]);

			workbook.SaveToFile("Sample.xls");
			ExcelDocViewer(workbook.FileName);
		}

		private void CreateSampleData(Worksheet sheet)
		{
			//Country
			sheet.Range["A1"].Value = "Country";
			sheet.Range["A2"].Value = "Cuba";
			sheet.Range["A3"].Value = "Mexico";
			sheet.Range["A4"].Value = "France";
			sheet.Range["A5"].Value = "German";

			//Jun
			sheet.Range["B1"].Value = "Jun";
			sheet.Range["B2"].NumberValue = 6000;
			sheet.Range["B3"].NumberValue = 8000;
			sheet.Range["B4"].NumberValue = 9000;
			sheet.Range["B5"].NumberValue = 8500;

			//Aug
			sheet.Range["C1"].Value = "Aug";
			sheet.Range["C2"].NumberValue = 3000;
			sheet.Range["C3"].NumberValue = 2000;
			sheet.Range["C4"].NumberValue = 2300;
			sheet.Range["C5"].NumberValue = 4200;

			//Style
			sheet.Range["A1:C1"].Style.Font.IsBold = true;
			sheet.Range["A2:C2"].Style.KnownColor = ExcelColors.LightYellow;
			sheet.Range["A3:C3"].Style.KnownColor = ExcelColors.LightGreen1;
			sheet.Range["A4:C4"].Style.KnownColor = ExcelColors.LightOrange;
			sheet.Range["A5:C5"].Style.KnownColor = ExcelColors.LightTurquoise;

			//Border
			sheet.Range["A1:C5"].Style.Borders[BordersLineType.EdgeTop].Color = Color.FromArgb(0, 0, 128);
			sheet.Range["A1:C5"].Style.Borders[BordersLineType.EdgeTop].LineStyle = LineStyleType.Thin;
			sheet.Range["A1:C5"].Style.Borders[BordersLineType.EdgeBottom].Color = Color.FromArgb(0, 0, 128);
			sheet.Range["A1:C5"].Style.Borders[BordersLineType.EdgeBottom].LineStyle = LineStyleType.Thin;
			sheet.Range["A1:C5"].Style.Borders[BordersLineType.EdgeLeft].Color = Color.FromArgb(0, 0, 128);
			sheet.Range["A1:C5"].Style.Borders[BordersLineType.EdgeLeft].LineStyle = LineStyleType.Thin;
			sheet.Range["A1:C5"].Style.Borders[BordersLineType.EdgeRight].Color = Color.FromArgb(0, 0, 128);
			sheet.Range["A1:C5"].Style.Borders[BordersLineType.EdgeRight].LineStyle = LineStyleType.Thin;

			sheet.Range["B2:C5"].Style.NumberFormat = "\"$\"#,##0";
		}

		private void ExcelDocViewer( string fileName )
		{
			try
			{
				System.Diagnostics.Process.Start(fileName);
			}
			catch{}
		}
		Private Sub btnRun_Click(ByVal sender As Object, ByVal e As System.EventArgs) Handles btnRun.Click
			Dim workbook As Workbook = New Workbook()

			'Initialize worksheet
			workbook.CreateEmptySheets(1)
			Dim sheet As Worksheet = workbook.Worksheets(0)
			sheet.GridLinesVisible = False

			'Writes sample data
			CreateSampleData(sheet)

			'Sets page setup properties
			sheet.PageSetup.Orientation = PageOrientationType.Landscape
			sheet.PageSetup.PaperSize = PaperSizeType.PaperA3

			'Sets page break
			sheet.VPageBreaks.Add(sheet.Range("A5"))
			sheet.HPageBreaks.Add(sheet.Range("C6"))

			workbook.SaveToFile("Sample.xls")
			ExcelDocViewer(workbook.FileName)
		End Sub

		Private Sub CreateSampleData(ByVal sheet As Worksheet)
			'Country
			sheet.Range("A1").Value = "Country"
			sheet.Range("A2").Value = "Cuba"
			sheet.Range("A3").Value = "Mexico"
			sheet.Range("A4").Value = "France"
			sheet.Range("A5").Value = "German"

			'Jun
			sheet.Range("B1").Value = "Jun"
			sheet.Range("B2").NumberValue = 6000
			sheet.Range("B3").NumberValue = 8000
			sheet.Range("B4").NumberValue = 9000
			sheet.Range("B5").NumberValue = 8500

			'Aug
			sheet.Range("C1").Value = "Aug"
			sheet.Range("C2").NumberValue = 3000
			sheet.Range("C3").NumberValue = 2000
			sheet.Range("C4").NumberValue = 2300
			sheet.Range("C5").NumberValue = 4200

			'Style
			sheet.Range("A1:C1").Style.Font.IsBold = True
			sheet.Range("A2:C2").Style.KnownColor = ExcelColors.LightYellow
			sheet.Range("A3:C3").Style.KnownColor = ExcelColors.LightGreen1
			sheet.Range("A4:C4").Style.KnownColor = ExcelColors.LightOrange
			sheet.Range("A5:C5").Style.KnownColor = ExcelColors.LightTurquoise

			'Border
			sheet.Range("A1:C5").Style.Borders(BordersLineType.EdgeTop).Color = Color.FromArgb(0, 0, 128)
			sheet.Range("A1:C5").Style.Borders(BordersLineType.EdgeTop).LineStyle = LineStyleType.Thin
			sheet.Range("A1:C5").Style.Borders(BordersLineType.EdgeBottom).Color = Color.FromArgb(0, 0, 128)
			sheet.Range("A1:C5").Style.Borders(BordersLineType.EdgeBottom).LineStyle = LineStyleType.Thin
			sheet.Range("A1:C5").Style.Borders(BordersLineType.EdgeLeft).Color = Color.FromArgb(0, 0, 128)
			sheet.Range("A1:C5").Style.Borders(BordersLineType.EdgeLeft).LineStyle = LineStyleType.Thin
			sheet.Range("A1:C5").Style.Borders(BordersLineType.EdgeRight).Color = Color.FromArgb(0, 0, 128)
			sheet.Range("A1:C5").Style.Borders(BordersLineType.EdgeRight).LineStyle = LineStyleType.Thin

			sheet.Range("B2:C5").Style.NumberFormat = """$""#,##0"
		End Sub

		Private Sub ExcelDocViewer(ByVal fileName As String)
			Try
				System.Diagnostics.Process.Start(fileName)
			Catch
			End Try
		End Sub
Published in
Page Setup
Saturday, 03 July 2010 10:09
EXCEL DataValidation in C#, VB.NET
The sample demonstrates how to write validation into spreadsheet.
		private void ExcelDocViewer( string fileName )
		{
			try
			{
				System.Diagnostics.Process.Start(fileName);
			}
			catch{}
		}

		private void btnRun_Click(object sender, System.EventArgs e)
		{
			Workbook workbook = new Workbook();
			Worksheet sheet = workbook.Worksheets[0];

			sheet.Range["B2"].Text = "Input Number(3-6):";
			CellRange rangeNumber = sheet.Range["B3"];
			rangeNumber.DataValidation.CompareOperator = ValidationComparisonOperator.Between;
			rangeNumber.DataValidation.Formula1 = "3";
			rangeNumber.DataValidation.Formula2 = "6";
			rangeNumber.DataValidation.AllowType = CellDataType.Decimal;
			rangeNumber.DataValidation.ErrorMessage = "Please input correct number!";
			rangeNumber.DataValidation.ShowError = true;
			rangeNumber.Style.KnownColor = ExcelColors.Gray25Percent;


			sheet.Range["B5"].Text = "Input Date:";
			CellRange rangeDate = sheet.Range["B6"];
			rangeDate.DataValidation.AllowType = CellDataType.Date;
			rangeDate.DataValidation.ErrorMessage = "Please input correct date!";
			rangeDate.DataValidation.ShowError = true;
			rangeDate.Style.KnownColor = ExcelColors.Gray25Percent;

			sheet.AutoFitColumn(2);

			workbook.SaveToFile("Sample.xls");
			ExcelDocViewer(workbook.FileName);
		}
		Private Sub ExcelDocViewer(ByVal fileName As String)
			Try
				System.Diagnostics.Process.Start(fileName)
			Catch
			End Try
		End Sub

		Private Sub btnRun_Click(ByVal sender As Object, ByVal e As System.EventArgs) Handles btnRun.Click
			Dim workbook As Workbook = New Workbook()
			Dim sheet As Worksheet = workbook.Worksheets(0)

			sheet.Range("B2").Text = "Input Number(3-6):"
			Dim rangeNumber As CellRange = sheet.Range("B3")
			rangeNumber.DataValidation.CompareOperator = ValidationComparisonOperator.Between
			rangeNumber.DataValidation.Formula1 = "3"
			rangeNumber.DataValidation.Formula2 = "6"
			rangeNumber.DataValidation.AllowType = CellDataType.Decimal
			rangeNumber.DataValidation.ErrorMessage = "Please input correct number!"
			rangeNumber.DataValidation.ShowError = True
			rangeNumber.Style.KnownColor = ExcelColors.Gray25Percent


			sheet.Range("B5").Text = "Input Date:"
			Dim rangeDate As CellRange = sheet.Range("B6")
			rangeDate.DataValidation.AllowType = CellDataType.Date
			rangeDate.DataValidation.ErrorMessage = "Please input correct date!"
			rangeDate.DataValidation.ShowError = True
			rangeDate.Style.KnownColor = ExcelColors.Gray25Percent

			sheet.AutoFitColumn(2)

			workbook.SaveToFile("Sample.xls")
			ExcelDocViewer(workbook.FileName)
		End Sub

		Private Sub btnAbout_Click(ByVal sender As Object, ByVal e As System.EventArgs) Handles btnAbout.Click
			Close()
		End Sub
Published in
Validation
Saturday, 03 July 2010 10:05
EXCEL Write Filters in C#, VB.NET
The sample demonstrates how to create auto filters in an excel workbook.
		private void btnRun_Click(object sender, System.EventArgs e)
		{
			Workbook workbook = new Workbook();

			//Initialize worksheet
			workbook.CreateEmptySheets(1);
			Worksheet sheet = workbook.Worksheets[0];
			sheet.GridLinesVisible = false;

			//Writes filter data
			CreateFilterData(sheet);

			sheet.AutoFilters.Range = sheet.Range["A1:C1"];

			workbook.SaveToFile("Sample.xls");
			ExcelDocViewer(workbook.FileName);
		}

		private void CreateFilterData(Worksheet sheet)
		{
			//Country
			sheet.Range["A1"].Value = "Country";
			sheet.Range["A2"].Value = "Cuba";
			sheet.Range["A3"].Value = "Mexico";
			sheet.Range["A4"].Value = "France";
			sheet.Range["A5"].Value = "German";

			//Jun
			sheet.Range["B1"].Value = "Jun";
			sheet.Range["B2"].NumberValue = 6000;
			sheet.Range["B3"].NumberValue = 8000;
			sheet.Range["B4"].NumberValue = 9000;
			sheet.Range["B5"].NumberValue = 8500;

			//Aug
			sheet.Range["C1"].Value = "Aug";
			sheet.Range["C2"].NumberValue = 3000;
			sheet.Range["C3"].NumberValue = 2000;
			sheet.Range["C4"].NumberValue = 2300;
			sheet.Range["C5"].NumberValue = 4200;

			//Style
			sheet.Range["A1:C1"].Style.Font.IsBold = true;
			sheet.Range["A2:C2"].Style.KnownColor = ExcelColors.LightYellow;
			sheet.Range["A3:C3"].Style.KnownColor = ExcelColors.LightGreen1;
			sheet.Range["A4:C4"].Style.KnownColor = ExcelColors.LightOrange;
			sheet.Range["A5:C5"].Style.KnownColor = ExcelColors.LightTurquoise;

			//Border
			sheet.Range["A1:C5"].Style.Borders[BordersLineType.EdgeTop].Color = Color.FromArgb(0, 0, 128);
			sheet.Range["A1:C5"].Style.Borders[BordersLineType.EdgeTop].LineStyle = LineStyleType.Thin;
			sheet.Range["A1:C5"].Style.Borders[BordersLineType.EdgeBottom].Color = Color.FromArgb(0, 0, 128);
			sheet.Range["A1:C5"].Style.Borders[BordersLineType.EdgeBottom].LineStyle = LineStyleType.Thin;
			sheet.Range["A1:C5"].Style.Borders[BordersLineType.EdgeLeft].Color = Color.FromArgb(0, 0, 128);
			sheet.Range["A1:C5"].Style.Borders[BordersLineType.EdgeLeft].LineStyle = LineStyleType.Thin;
			sheet.Range["A1:C5"].Style.Borders[BordersLineType.EdgeRight].Color = Color.FromArgb(0, 0, 128);
			sheet.Range["A1:C5"].Style.Borders[BordersLineType.EdgeRight].LineStyle = LineStyleType.Thin;

			sheet.Range["B2:C5"].Style.NumberFormat = "\"$\"#,##0";
		}

		private void ExcelDocViewer( string fileName )
		{
			try
			{
				System.Diagnostics.Process.Start(fileName);
			}
			catch{}
		}
		Private Sub btnRun_Click(ByVal sender As Object, ByVal e As System.EventArgs) Handles btnRun.Click
			Dim workbook As Workbook = New Workbook()

			'Initialize worksheet
			workbook.CreateEmptySheets(1)
			Dim sheet As Worksheet = workbook.Worksheets(0)
			sheet.GridLinesVisible = False

			'Writes filter data
			CreateFilterData(sheet)

			sheet.AutoFilters.Range = sheet.Range("A1:C1")

			workbook.SaveToFile("Sample.xls")
			ExcelDocViewer(workbook.FileName)
		End Sub

		Private Sub CreateFilterData(ByVal sheet As Worksheet)
			'Country
			sheet.Range("A1").Value = "Country"
			sheet.Range("A2").Value = "Cuba"
			sheet.Range("A3").Value = "Mexico"
			sheet.Range("A4").Value = "France"
			sheet.Range("A5").Value = "German"

			'Jun
			sheet.Range("B1").Value = "Jun"
			sheet.Range("B2").NumberValue = 6000
			sheet.Range("B3").NumberValue = 8000
			sheet.Range("B4").NumberValue = 9000
			sheet.Range("B5").NumberValue = 8500

			'Aug
			sheet.Range("C1").Value = "Aug"
			sheet.Range("C2").NumberValue = 3000
			sheet.Range("C3").NumberValue = 2000
			sheet.Range("C4").NumberValue = 2300
			sheet.Range("C5").NumberValue = 4200

			'Style
			sheet.Range("A1:C1").Style.Font.IsBold = True
			sheet.Range("A2:C2").Style.KnownColor = ExcelColors.LightYellow
			sheet.Range("A3:C3").Style.KnownColor = ExcelColors.LightGreen1
			sheet.Range("A4:C4").Style.KnownColor = ExcelColors.LightOrange
			sheet.Range("A5:C5").Style.KnownColor = ExcelColors.LightTurquoise

			'Border
			sheet.Range("A1:C5").Style.Borders(BordersLineType.EdgeTop).Color = Color.FromArgb(0, 0, 128)
			sheet.Range("A1:C5").Style.Borders(BordersLineType.EdgeTop).LineStyle = LineStyleType.Thin
			sheet.Range("A1:C5").Style.Borders(BordersLineType.EdgeBottom).Color = Color.FromArgb(0, 0, 128)
			sheet.Range("A1:C5").Style.Borders(BordersLineType.EdgeBottom).LineStyle = LineStyleType.Thin
			sheet.Range("A1:C5").Style.Borders(BordersLineType.EdgeLeft).Color = Color.FromArgb(0, 0, 128)
			sheet.Range("A1:C5").Style.Borders(BordersLineType.EdgeLeft).LineStyle = LineStyleType.Thin
			sheet.Range("A1:C5").Style.Borders(BordersLineType.EdgeRight).Color = Color.FromArgb(0, 0, 128)
			sheet.Range("A1:C5").Style.Borders(BordersLineType.EdgeRight).LineStyle = LineStyleType.Thin

			sheet.Range("B2:C5").Style.NumberFormat = """$""#,##0"
		End Sub

		Private Sub ExcelDocViewer(ByVal fileName As String)
			Try
				System.Diagnostics.Process.Start(fileName)
			Catch
			End Try
		End Sub
Published in
Filters
Saturday, 03 July 2010 10:01
EXCEL Group in C#, VB.NET
The sample demonstrates how to create group in an excel workbook..
		private void btnRun_Click(object sender, System.EventArgs e)
		{
			Workbook workbook = new Workbook();

			//Initialize worksheet
			workbook.CreateEmptySheets(1);
			Worksheet sheet = workbook.Worksheets[0];
			sheet.GridLinesVisible = false;

			//Writes Sample data
			CreateSampleData(sheet);

			sheet.GroupByRows(1,5,false);
			sheet.GroupByColumns(1,3,false);

			workbook.SaveToFile("Sample.xls");
			ExcelDocViewer(workbook.FileName);
		}

		private void CreateSampleData(Worksheet sheet)
		{
			//Country
			sheet.Range["A1"].Value = "Country";
			sheet.Range["A2"].Value = "Cuba";
			sheet.Range["A3"].Value = "Mexico";
			sheet.Range["A4"].Value = "France";
			sheet.Range["A5"].Value = "German";

			//Jun
			sheet.Range["B1"].Value = "Jun";
			sheet.Range["B2"].NumberValue = 6000;
			sheet.Range["B3"].NumberValue = 8000;
			sheet.Range["B4"].NumberValue = 9000;
			sheet.Range["B5"].NumberValue = 8500;

			//Aug
			sheet.Range["C1"].Value = "Aug";
			sheet.Range["C2"].NumberValue = 3000;
			sheet.Range["C3"].NumberValue = 2000;
			sheet.Range["C4"].NumberValue = 2300;
			sheet.Range["C5"].NumberValue = 4200;

			//Style
			sheet.Range["A1:C1"].Style.Font.IsBold = true;
			sheet.Range["A2:C2"].Style.KnownColor = ExcelColors.LightYellow;
			sheet.Range["A3:C3"].Style.KnownColor = ExcelColors.LightGreen1;
			sheet.Range["A4:C4"].Style.KnownColor = ExcelColors.LightOrange;
			sheet.Range["A5:C5"].Style.KnownColor = ExcelColors.LightTurquoise;

			//Border
			sheet.Range["A1:C5"].Style.Borders[BordersLineType.EdgeTop].Color = Color.FromArgb(0, 0, 128);
			sheet.Range["A1:C5"].Style.Borders[BordersLineType.EdgeTop].LineStyle = LineStyleType.Thin;
			sheet.Range["A1:C5"].Style.Borders[BordersLineType.EdgeBottom].Color = Color.FromArgb(0, 0, 128);
			sheet.Range["A1:C5"].Style.Borders[BordersLineType.EdgeBottom].LineStyle = LineStyleType.Thin;
			sheet.Range["A1:C5"].Style.Borders[BordersLineType.EdgeLeft].Color = Color.FromArgb(0, 0, 128);
			sheet.Range["A1:C5"].Style.Borders[BordersLineType.EdgeLeft].LineStyle = LineStyleType.Thin;
			sheet.Range["A1:C5"].Style.Borders[BordersLineType.EdgeRight].Color = Color.FromArgb(0, 0, 128);
			sheet.Range["A1:C5"].Style.Borders[BordersLineType.EdgeRight].LineStyle = LineStyleType.Thin;

			sheet.Range["B2:C5"].Style.NumberFormat = "\"$\"#,##0";
		}

		private void ExcelDocViewer( string fileName )
		{
			try
			{
				System.Diagnostics.Process.Start(fileName);
			}
			catch{}
		}
		Private Sub btnRun_Click(ByVal sender As Object, ByVal e As System.EventArgs) Handles btnRun.Click
			Dim workbook As Workbook = New Workbook()

			'Initialize worksheet
			workbook.CreateEmptySheets(1)
			Dim sheet As Worksheet = workbook.Worksheets(0)
			sheet.GridLinesVisible = False

			'Writes Sample data
			CreateSampleData(sheet)

			sheet.GroupByRows(1,5,False)
			sheet.GroupByColumns(1,3,False)

			workbook.SaveToFile("Sample.xls")
			ExcelDocViewer(workbook.FileName)
		End Sub

		Private Sub CreateSampleData(ByVal sheet As Worksheet)
			'Country
			sheet.Range("A1").Value = "Country"
			sheet.Range("A2").Value = "Cuba"
			sheet.Range("A3").Value = "Mexico"
			sheet.Range("A4").Value = "France"
			sheet.Range("A5").Value = "German"

			'Jun
			sheet.Range("B1").Value = "Jun"
			sheet.Range("B2").NumberValue = 6000
			sheet.Range("B3").NumberValue = 8000
			sheet.Range("B4").NumberValue = 9000
			sheet.Range("B5").NumberValue = 8500

			'Aug
			sheet.Range("C1").Value = "Aug"
			sheet.Range("C2").NumberValue = 3000
			sheet.Range("C3").NumberValue = 2000
			sheet.Range("C4").NumberValue = 2300
			sheet.Range("C5").NumberValue = 4200

			'Style
			sheet.Range("A1:C1").Style.Font.IsBold = True
			sheet.Range("A2:C2").Style.KnownColor = ExcelColors.LightYellow
			sheet.Range("A3:C3").Style.KnownColor = ExcelColors.LightGreen1
			sheet.Range("A4:C4").Style.KnownColor = ExcelColors.LightOrange
			sheet.Range("A5:C5").Style.KnownColor = ExcelColors.LightTurquoise

			'Border
			sheet.Range("A1:C5").Style.Borders(BordersLineType.EdgeTop).Color = Color.FromArgb(0, 0, 128)
			sheet.Range("A1:C5").Style.Borders(BordersLineType.EdgeTop).LineStyle = LineStyleType.Thin
			sheet.Range("A1:C5").Style.Borders(BordersLineType.EdgeBottom).Color = Color.FromArgb(0, 0, 128)
			sheet.Range("A1:C5").Style.Borders(BordersLineType.EdgeBottom).LineStyle = LineStyleType.Thin
			sheet.Range("A1:C5").Style.Borders(BordersLineType.EdgeLeft).Color = Color.FromArgb(0, 0, 128)
			sheet.Range("A1:C5").Style.Borders(BordersLineType.EdgeLeft).LineStyle = LineStyleType.Thin
			sheet.Range("A1:C5").Style.Borders(BordersLineType.EdgeRight).Color = Color.FromArgb(0, 0, 128)
			sheet.Range("A1:C5").Style.Borders(BordersLineType.EdgeRight).LineStyle = LineStyleType.Thin

			sheet.Range("B2:C5").Style.NumberFormat = """$""#,##0"
		End Sub

		Private Sub ExcelDocViewer(ByVal fileName As String)
			Try
				System.Diagnostics.Process.Start(fileName)
			Catch
			End Try
		End Sub
Published in
Group
Saturday, 03 July 2010 09:51
EXCEL Freezepane in C#, VB.NET
The sample demonstrates how to freeze excel workbook.
		private void btnRun_Click(object sender, System.EventArgs e)
		{
			Workbook workbook = new Workbook();

			//Initialize worksheet
			workbook.CreateEmptySheets(1);
			Worksheet sheet = workbook.Worksheets[0];

			//Writes sample data
			CreateSampleData(sheet);

			sheet.FreezePanes(2,1);

			workbook.SaveToFile("Sample.xls");
			ExcelDocViewer(workbook.FileName);
		}

		private void CreateSampleData(Worksheet sheet)
		{
			//Country
			sheet.Range["A1"].Value = "Country";
			sheet.Range["A2"].Value = "Cuba";
			sheet.Range["A3"].Value = "Mexico";
			sheet.Range["A4"].Value = "France";
			sheet.Range["A5"].Value = "German";

			//Jun
			sheet.Range["B1"].Value = "Jun";
			sheet.Range["B2"].NumberValue = 6000;
			sheet.Range["B3"].NumberValue = 8000;
			sheet.Range["B4"].NumberValue = 9000;
			sheet.Range["B5"].NumberValue = 8500;

			//Aug
			sheet.Range["C1"].Value = "Aug";
			sheet.Range["C2"].NumberValue = 3000;
			sheet.Range["C3"].NumberValue = 2000;
			sheet.Range["C4"].NumberValue = 2300;
			sheet.Range["C5"].NumberValue = 4200;

			//Style
			sheet.Range["A1:C1"].Style.Font.IsBold = true;
			sheet.Range["A2:C2"].Style.KnownColor = ExcelColors.LightYellow;
			sheet.Range["A3:C3"].Style.KnownColor = ExcelColors.LightGreen1;
			sheet.Range["A4:C4"].Style.KnownColor = ExcelColors.LightOrange;
			sheet.Range["A5:C5"].Style.KnownColor = ExcelColors.LightTurquoise;

			//Border
			sheet.Range["A1:C5"].Style.Borders[BordersLineType.EdgeTop].Color = Color.FromArgb(0, 0, 128);
			sheet.Range["A1:C5"].Style.Borders[BordersLineType.EdgeTop].LineStyle = LineStyleType.Thin;
			sheet.Range["A1:C5"].Style.Borders[BordersLineType.EdgeBottom].Color = Color.FromArgb(0, 0, 128);
			sheet.Range["A1:C5"].Style.Borders[BordersLineType.EdgeBottom].LineStyle = LineStyleType.Thin;
			sheet.Range["A1:C5"].Style.Borders[BordersLineType.EdgeLeft].Color = Color.FromArgb(0, 0, 128);
			sheet.Range["A1:C5"].Style.Borders[BordersLineType.EdgeLeft].LineStyle = LineStyleType.Thin;
			sheet.Range["A1:C5"].Style.Borders[BordersLineType.EdgeRight].Color = Color.FromArgb(0, 0, 128);
			sheet.Range["A1:C5"].Style.Borders[BordersLineType.EdgeRight].LineStyle = LineStyleType.Thin;

			sheet.Range["B2:C5"].Style.NumberFormat = "\"$\"#,##0";
		}

		private void ExcelDocViewer( string fileName )
		{
			try
			{
				System.Diagnostics.Process.Start(fileName);
			}
			catch{}
		}
		Private Sub btnRun_Click(ByVal sender As Object, ByVal e As System.EventArgs) Handles btnRun.Click
			Dim workbook As Workbook = New Workbook()

			'Initialize worksheet
			workbook.CreateEmptySheets(1)
			Dim sheet As Worksheet = workbook.Worksheets(0)

			'Writes sample data
			CreateSampleData(sheet)

			sheet.FreezePanes(2,1)

			workbook.SaveToFile("Sample.xls")
			ExcelDocViewer(workbook.FileName)
		End Sub

		Private Sub CreateSampleData(ByVal sheet As Worksheet)
			'Country
			sheet.Range("A1").Value = "Country"
			sheet.Range("A2").Value = "Cuba"
			sheet.Range("A3").Value = "Mexico"
			sheet.Range("A4").Value = "France"
			sheet.Range("A5").Value = "German"

			'Jun
			sheet.Range("B1").Value = "Jun"
			sheet.Range("B2").NumberValue = 6000
			sheet.Range("B3").NumberValue = 8000
			sheet.Range("B4").NumberValue = 9000
			sheet.Range("B5").NumberValue = 8500

			'Aug
			sheet.Range("C1").Value = "Aug"
			sheet.Range("C2").NumberValue = 3000
			sheet.Range("C3").NumberValue = 2000
			sheet.Range("C4").NumberValue = 2300
			sheet.Range("C5").NumberValue = 4200

			'Style
			sheet.Range("A1:C1").Style.Font.IsBold = True
			sheet.Range("A2:C2").Style.KnownColor = ExcelColors.LightYellow
			sheet.Range("A3:C3").Style.KnownColor = ExcelColors.LightGreen1
			sheet.Range("A4:C4").Style.KnownColor = ExcelColors.LightOrange
			sheet.Range("A5:C5").Style.KnownColor = ExcelColors.LightTurquoise

			'Border
			sheet.Range("A1:C5").Style.Borders(BordersLineType.EdgeTop).Color = Color.FromArgb(0, 0, 128)
			sheet.Range("A1:C5").Style.Borders(BordersLineType.EdgeTop).LineStyle = LineStyleType.Thin
			sheet.Range("A1:C5").Style.Borders(BordersLineType.EdgeBottom).Color = Color.FromArgb(0, 0, 128)
			sheet.Range("A1:C5").Style.Borders(BordersLineType.EdgeBottom).LineStyle = LineStyleType.Thin
			sheet.Range("A1:C5").Style.Borders(BordersLineType.EdgeLeft).Color = Color.FromArgb(0, 0, 128)
			sheet.Range("A1:C5").Style.Borders(BordersLineType.EdgeLeft).LineStyle = LineStyleType.Thin
			sheet.Range("A1:C5").Style.Borders(BordersLineType.EdgeRight).Color = Color.FromArgb(0, 0, 128)
			sheet.Range("A1:C5").Style.Borders(BordersLineType.EdgeRight).LineStyle = LineStyleType.Thin

			sheet.Range("B2:C5").Style.NumberFormat = """$""#,##0"
		End Sub

		Private Sub ExcelDocViewer(ByVal fileName As String)
			Try
				System.Diagnostics.Process.Start(fileName)
			Catch
			End Try
		End Sub
Published in
Freezepane
Saturday, 03 July 2010 09:37
EXCEL Write RichText in C#, VB.NET
The sample demonstrates how to write rich text into spreadsheet.
		private void ExcelDocViewer( string fileName )
		{
			try
			{
				System.Diagnostics.Process.Start(fileName);
			}
			catch{}
		}

		private void btnRun_Click(object sender, System.EventArgs e)
		{
			Workbook workbook = new Workbook();
			Worksheet sheet = workbook.Worksheets[0];

			ExcelFont fontBold = workbook.CreateFont();
			fontBold.IsBold = true;

			ExcelFont fontUnderline = workbook.CreateFont();
			fontUnderline.Underline = FontUnderlineType.Single;

			ExcelFont fontColor = workbook.CreateFont();
			fontColor.KnownColor  = ExcelColors.Green;

			RichText richText = sheet.Range["A1"].RichText;
			richText.Text = "Bold and underlined and colored text";
			richText.SetFont(0,3,fontBold);
			richText.SetFont(9,18,fontUnderline);
			richText.SetFont(24,30,fontColor);


		    workbook.SaveToFile("Sample.xls");
			ExcelDocViewer(workbook.FileName);
		}
		Private Sub ExcelDocViewer(ByVal fileName As String)
			Try
				System.Diagnostics.Process.Start(fileName)
			Catch
			End Try
		End Sub

		Private Sub btnRun_Click(ByVal sender As Object, ByVal e As System.EventArgs) Handles btnRun.Click
			Dim workbook As Workbook = New Workbook()
			Dim sheet As Worksheet = workbook.Worksheets(0)

			Dim fontBold As ExcelFont = workbook.CreateFont()
			fontBold.IsBold = True

			Dim fontUnderline As ExcelFont = workbook.CreateFont()
			fontUnderline.Underline = FontUnderlineType.Single

			Dim fontColor As ExcelFont = workbook.CreateFont()
			fontColor.KnownColor = ExcelColors.Green

			Dim richText As RichText = sheet.Range("A1").RichText
			richText.Text = "Bold and underlined and colored text"
			richText.SetFont(0,3,fontBold)
			richText.SetFont(9,18,fontUnderline)
			richText.SetFont(24,30,fontColor)


			workbook.SaveToFile("Sample.xls")
			ExcelDocViewer(workbook.FileName)
		End Sub
Published in
RichText
Saturday, 03 July 2010 09:32
EXCEL Read RichText in C#, VB.NET
The sample demonstrates how to read rich text from spreadsheet.
		private void btnRun_Click(object sender, System.EventArgs e)
		{
			Workbook workbook = new Workbook();
			workbook.LoadFromFile(@"..\..\..\..\..\..\Data\RichTextSample.xls");
			Worksheet sheet = workbook.Worksheets[0];

			richTextBox1.Rtf = sheet.Range["A1"].RichText.RtfText;
		}
		Private Sub btnRun_Click(ByVal sender As Object, ByVal e As System.EventArgs) Handles btnRun.Click
			Dim workbook As Workbook = New Workbook()
			workbook.LoadFromFile("..\..\..\..\..\..\Data\RichTextSample.xls")
			Dim sheet As Worksheet = workbook.Worksheets(0)

			richTextBox1.Rtf = sheet.Range("A1").RichText.RtfText
		End Sub
Published in
RichText
Saturday, 03 July 2010 06:54
EXCEL Read Comment in C#, VB.NET
The sample demonstrates how to read comment from an excel workbook.
		private void btnRun_Click(object sender, System.EventArgs e)
		{
			Workbook workbook = new Workbook();

			workbook.LoadFromFile(@"..\..\..\..\..\..\Data\CommentSample.xls");
			//Initialize worksheet
			Worksheet sheet = workbook.Worksheets[0];

			textBox1.Text = sheet.Range["A1"].Comment.Text;
			richTextBox1.Rtf = sheet.Range["A2"].Comment.RichText.RtfText;
		}
		Private Sub btnRun_Click(ByVal sender As Object, ByVal e As System.EventArgs) Handles btnRun.Click
			Dim workbook As Workbook = New Workbook()

			workbook.LoadFromFile("..\..\..\..\..\..\Data\CommentSample.xls")
			'Initialize worksheet
			Dim sheet As Worksheet = workbook.Worksheets(0)

			textBox1.Text = sheet.Range("A1").Comment.Text
			richTextBox1.Rtf = sheet.Range("A2").Comment.RichText.RtfText
		End Sub
Published in
Comment