Add Shapes to PowerPoint Presentations with JavaScript in React
Explanatory content in a presentation is often hard to convey with text alone: the order of steps, the relationships between parts, and the boundaries of key information all become clearer once they are marked with a graphic. Drawing and styling shapes by hand on every slide takes time and is difficult to keep consistent across batch-generated documents.
This article uses Spire.Presentation for JavaScript to add shapes to PowerPoint presentations in the browser. The whole process runs locally on the user's device through WebAssembly, requires no Office installation and no back-end service, and keeps the presentation from leaving the browser.
This article covers two core features:
For installation and project configuration, see Integrating Spire.Presentation for JavaScript in a React Project. The examples below assume that Spire.Presentation is installed and the WebAssembly module has been initialized.
Add Basic Shapes to PowerPoint Slides
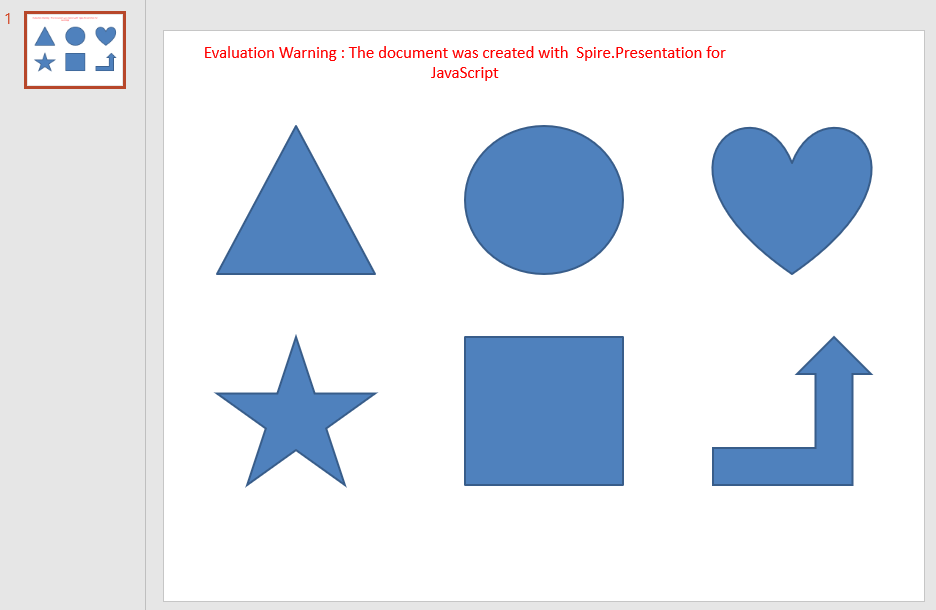
Triangles, ellipses, hearts, five-pointed stars, rectangles and bent-up arrows are common building blocks on a slide; they divide areas, mark key points or support a text explanation. Adding a shape to a slide requires the shape type first, and then the position and size expressed in coordinates, so that the graphic lands exactly where it is expected.
| Usage | Result |
|---|---|
slide.Shapes.AppendShape({ shapeType, rectangle }) |
Add a shape of the given type inside the specified area |
RectangleF.FromLTRB(left, top, right, bottom) |
Define the position and size of a shape with its top-left and bottom-right coordinates |
ShapeType.Rectangle, ShapeType.Ellipse, ShapeType.Triangle, ShapeType.Heart, ShapeType.FivePointedStar, ShapeType.BentUpArrow |
The shape types for a rectangle, an ellipse, a triangle, a heart, a five-pointed star and a bent-up arrow |
The steps are:
- Get the Spire.Presentation WASM module and make sure it is ready, load the font file into the VFS, and create a
Presentationobject. - Get the first slide with
Presentation.Slides.get_Item(0). - Define the area of each shape with the top-left and bottom-right coordinates of
RectangleF.FromLTRB(). - Add a triangle, an ellipse, a heart, a five-pointed star, a rectangle and a bent-up arrow with
Shapes.AppendShape(), selecting the matchingShapeTypemember inshapeType. - Save the result file with
Presentation.SaveToFile()and release the presentation withDispose(). - Read the result file from the VFS and trigger the browser download.
The following code adds basic shapes to PowerPoint slides:
function App() {
  const addBasicShapes = async () => {
    // Get the Spire.Presentation WASM module
    const pptModule = window.wasmModule?.spirepresentation;

    // Check that the module is ready
    if (!pptModule) {
      alert('Spire.Presentation is not ready yet');
      return;
    }

    // Load the font into the VFS
    await window.spire.FetchFileToVFS('ARIAL.TTF', '/Library/Fonts/', `${process.env.PUBLIC_URL}/font/`);

    // Create a presentation; it already contains one blank slide
    const ppt = new pptModule.Presentation();
    const slide = ppt.Slides.get_Item(0);

    // Add a triangle
    slide.Shapes.AppendShape({
      shapeType: pptModule.ShapeType.Triangle,
      rectangle: pptModule.RectangleF.FromLTRB(50, 90, 200, 230),
    });

    // Add an ellipse
    slide.Shapes.AppendShape({
      shapeType: pptModule.ShapeType.Ellipse,
      rectangle: pptModule.RectangleF.FromLTRB(285, 90, 435, 230),
    });

    // Add a heart
    slide.Shapes.AppendShape({
      shapeType: pptModule.ShapeType.Heart,
      rectangle: pptModule.RectangleF.FromLTRB(520, 90, 670, 230),
    });

    // Add a five-pointed star
    slide.Shapes.AppendShape({
      shapeType: pptModule.ShapeType.FivePointedStar,
      rectangle: pptModule.RectangleF.FromLTRB(50, 290, 200, 430),
    });

    // Add a rectangle
    slide.Shapes.AppendShape({
      shapeType: pptModule.ShapeType.Rectangle,
      rectangle: pptModule.RectangleF.FromLTRB(285, 290, 435, 430),
    });

    // Add a bent-up arrow
    slide.Shapes.AppendShape({
      shapeType: pptModule.ShapeType.BentUpArrow,
      rectangle: pptModule.RectangleF.FromLTRB(520, 290, 670, 430),
    });

    // Save the result file
    const outputFileName = 'AddBasicShapes.pptx';
    ppt.SaveToFile({ file: outputFileName, fileFormat: pptModule.FileFormat.Pptx2013 });
    ppt.Dispose();

    // Read the generated file from the VFS and trigger the download
    const fileArray = window.dotnetRuntime.Module.FS.readFile(outputFileName);
    const blob = new Blob([fileArray], { type: 'application/vnd.openxmlformats-officedocument.presentationml.presentation' });
    const url = URL.createObjectURL(blob);
    const a = document.createElement('a');
    a.href = url;
    a.download = outputFileName;
    a.click();
    URL.revokeObjectURL(url);
  };

  return (
    <div style={{ textAlign: 'center', height: '300px' }}>
      <h1>Add Shapes</h1>
      <button onClick={addBasicShapes}>
        Add Basic Shapes
      </button>
    </div>
  );
}

export default App;
Presentation after adding six basic shapes to a blank slide:
Style Shapes in PowerPoint
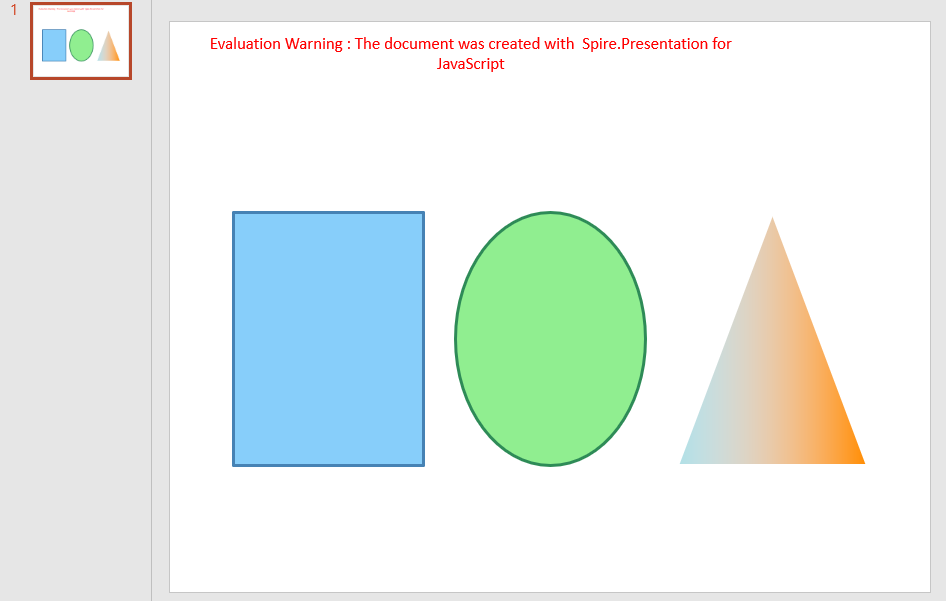
A newly added shape follows the theme colors of the presentation, which often need adjustment on a concrete slide: change the fill and outline so the graphic matches the page palette, adjust the outline width to emphasize a part, or switch to a gradient fill to give the graphic more depth. Style changes are applied to the shape object, so a look defined once can be reused and the colors stay consistent.
| Usage | Result |
|---|---|
shape.Fill.FillType = FillFormatType.Solid |
Set the shape fill to a solid color |
shape.Fill.SolidColor.Color = Color.get_xxx() |
Set the fill color inside the shape |
shape.Fill.FillType = FillFormatType.Gradient |
Set the shape fill to a gradient |
shape.Fill.Gradient.GradientStops.Append({ position, knownColor }) |
Add color stops to the gradient and define the effect |
shape.Line.FillType = FillFormatType.Solid |
Set the shape outline to a solid line |
shape.Line.SolidFillColor.Color = Color.get_xxx() |
Set the outline color of the shape |
shape.Line.Width = n |
Set the outline width of the shape |
The steps are:
- Get the Spire.Presentation WASM module and make sure it is ready, load the font file into the VFS, and create a
Presentationobject and get the first slide. - Add the shapes to style with
Shapes.AppendShape(). - Set
Fill.FillTypetoFillFormatType.Solidand choose the fill color withFill.SolidColor.Color. - Set
Line.FillTypetoFillFormatType.Solid, choose the outline color withLine.SolidFillColor.Color, and adjust the outline width withLine.Width. - For a gradient effect, change
Fill.FillTypetoFillFormatType.Gradientand add color stops withFill.Gradient.GradientStops.Append(). - Save the result file with
Presentation.SaveToFile(), release the presentation withDispose(), and read the file from the VFS to trigger the download.
The following code styles the shapes in PowerPoint:
function App() {
  const styleShapes = async () => {
    // Get the Spire.Presentation WASM module
    const pptModule = window.wasmModule?.spirepresentation;

    // Check that the module is ready
    if (!pptModule) {
      alert('Spire.Presentation is not ready yet');
      return;
    }

    // Load the font into the VFS
    await window.spire.FetchFileToVFS('ARIAL.TTF', '/Library/Fonts/', `${process.env.PUBLIC_URL}/font/`);

    // Create a presentation and get the first slide
    const ppt = new pptModule.Presentation();
    const slide = ppt.Slides.get_Item(0);

    // Add a rectangle with a solid fill, an outline color and a line width
    let shape = slide.Shapes.AppendShape({
      shapeType: pptModule.ShapeType.Rectangle,
      rectangle: pptModule.RectangleF.FromLTRB(60, 180, 240, 420),
    });
    shape.Fill.FillType = pptModule.FillFormatType.Solid;
    shape.Fill.SolidColor.Color = pptModule.Color.get_LightSkyBlue();
    shape.Line.FillType = pptModule.FillFormatType.Solid;
    shape.Line.SolidFillColor.Color = pptModule.Color.get_SteelBlue();
    shape.Line.Width = 3;

    // Add an ellipse with a solid fill and an outline color
    shape = slide.Shapes.AppendShape({
      shapeType: pptModule.ShapeType.Ellipse,
      rectangle: pptModule.RectangleF.FromLTRB(270, 180, 450, 420),
    });
    shape.Fill.FillType = pptModule.FillFormatType.Solid;
    shape.Fill.SolidColor.Color = pptModule.Color.get_LightGreen();
    shape.Line.FillType = pptModule.FillFormatType.Solid;
    shape.Line.SolidFillColor.Color = pptModule.Color.get_SeaGreen();
    shape.Line.Width = 3;

    // Add a triangle with a gradient fill and an outline color
    shape = slide.Shapes.AppendShape({
      shapeType: pptModule.ShapeType.Triangle,
      rectangle: pptModule.RectangleF.FromLTRB(480, 180, 660, 420),
    });
    shape.Fill.FillType = pptModule.FillFormatType.Gradient;
    shape.Fill.Gradient.GradientStops.Append({ position: 0, knownColor: pptModule.KnownColors.PowderBlue });
    shape.Fill.Gradient.GradientStops.Append({ position: 1, knownColor: pptModule.KnownColors.DarkOrange });
    shape.Line.FillType = pptModule.FillFormatType.Solid;
    shape.Line.SolidFillColor.Color = pptModule.Color.get_White();
    shape.Line.Width = 3;

    // Save the result file
    const outputFileName = 'AddShapeStyles.pptx';
    ppt.SaveToFile({ file: outputFileName, fileFormat: pptModule.FileFormat.Pptx2013 });
    ppt.Dispose();

    // Read the generated file from the VFS and trigger the download
    const fileArray = window.dotnetRuntime.Module.FS.readFile(outputFileName);
    const blob = new Blob([fileArray], { type: 'application/vnd.openxmlformats-officedocument.presentationml.presentation' });
    const url = URL.createObjectURL(blob);
    const a = document.createElement('a');
    a.href = url;
    a.download = outputFileName;
    a.click();
    URL.revokeObjectURL(url);
  };

  return (
    <div style={{ textAlign: 'center', height: '300px' }}>
      <h1>Style Shapes</h1>
      <button onClick={styleShapes}>
        Style Shapes
      </button>
    </div>
  );
}

export default App;
Presentation after applying fills, outlines and gradient styles:
FAQ
How to make a shape unfilled and keep only its outline
Cause: Newly added shapes have a fill by default. For an outline-only figure, or to let content underneath show through, set the fill to none explicitly.
Solution: Set Fill.FillType to FillFormatType.None, and define the outline with Line.FillType and Line.SolidFillColor.Color:
shape.Fill.FillType = pptModule.FillFormatType.None;
shape.Line.FillType = pptModule.FillFormatType.Solid;
shape.Line.SolidFillColor.Color = pptModule.Color.get_SlateBlue();
How to change a shape's position and size after adding it
Cause: The position and size of a shape remain editable after it is added; there is no need to create it again.
Solution: Set the Left, Top, Width and Height properties on the shape object:
const shape = slide.Shapes.get_Item(0);
shape.Left = 160;
shape.Top = 260;
shape.Width = 300;
shape.Height = 200;
How to add a shadow to a shape
Cause: A shadow gives a shape more depth, but the fill and outline only control the shape itself; the shadow is set through a separate effect object.
Solution: Create an InnerShadowEffect, set BlurRadius, Direction, Distance and ColorFormat.Color, then assign it to shape.EffectDag.InnerShadowEffect:
const innerShadow = new pptModule.InnerShadowEffect();
innerShadow.BlurRadius = 20;
innerShadow.Direction = 0;
innerShadow.Distance = 0;
innerShadow.ColorFormat.Color = pptModule.Color.get_Black();
shape.EffectDag.InnerShadowEffect = innerShadow;
Get a Free License
If you wish to delete the evaluation message from the resulting documents, or to get rid of function limitations, please contact sales to obtain a valid 30-day temporary license.
Group and Ungroup PowerPoint Shapes with JavaScript in React
Once a slide holds more than a handful of shapes, moving and aligning them one by one becomes slow, and a single misclick can break the spacing. Grouping related shapes into a unit lets them move and scale together while keeping their relative positions; ungrouping restores them as independent shapes when one of them needs a change.
This article uses Spire.Presentation for JavaScript to group and ungroup PowerPoint shapes in the browser. The whole process runs locally on the user's device through WebAssembly, requires no Office installation and no back-end service, and keeps the presentation from leaving the browser.
This article covers two core features:
For installation and project configuration, see Integrating Spire.Presentation for JavaScript in a React Project. The examples below assume that Spire.Presentation for JavaScript is installed and the WebAssembly module has been initialized.
Group PowerPoint Shapes
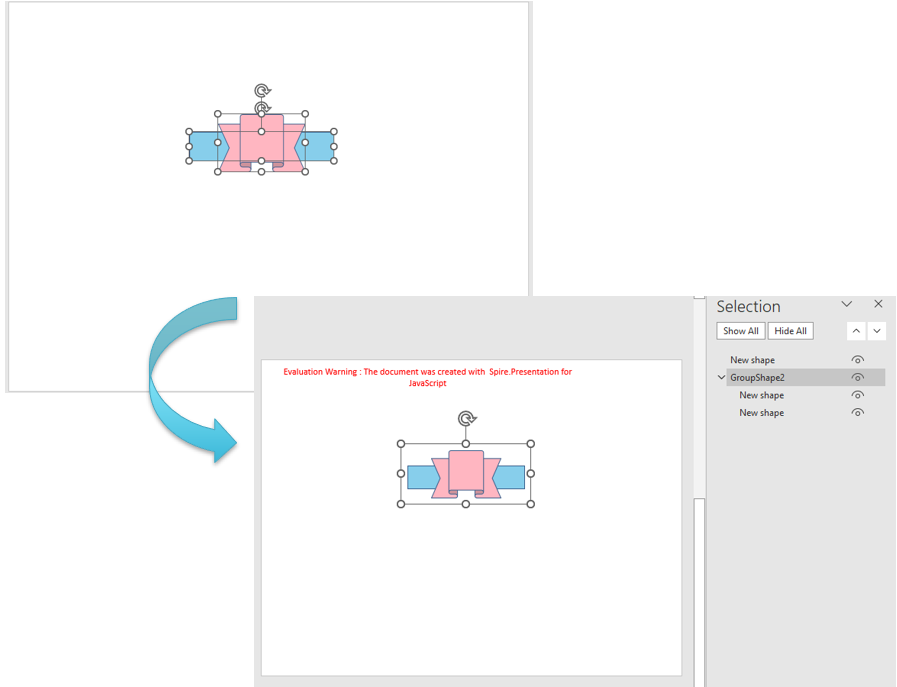
Diagrams often rely on a set of shapes that should be placed as one block: a cluster of callouts, a row of arrows, a small illustration. Selecting them one by one and operating on them together is awkward, and one slip moves the wrong shape. Grouping collects these shapes into a single unit, so later moves and scaling apply to the whole group while the relative positions inside stay unchanged.
| Usage | Result |
|---|---|
slide.Shapes.Count |
The total number of shapes on the current slide |
slide.Shapes.get_Item(i) |
Get the i-th shape by index |
slide.GroupShapes(shapes) |
Group the shapes in the array into one unit and return a GroupShape object |
The steps are:
- Get the Spire.Presentation WASM module and make sure it is ready, then load the font file and the presentation into the VFS.
- Create a
Presentationobject, callLoadFromFile()to load the presentation, and get the first slide withSlides.get_Item(0). - Loop over the slide with
Shapes.CountandShapes.get_Item(), adding the shapes to be grouped to an array. - Call
slide.GroupShapes()with the array; it returns the resultingGroupShapeobject. - Call
Presentation.SaveToFile()to save the result file andDispose()to release the presentation. - Read the result file from the VFS and trigger the browser download.
The code for grouping PowerPoint shapes is as follows:
function App() {
  const groupShapes = async () => {
    // Get the Spire.Presentation WASM module
    const pptModule = window.wasmModule?.spirepresentation;

    // Check that the module is ready
    if (!pptModule) {
      alert('Spire.Presentation is not ready yet');
      return;
    }

    // Load the font and the presentation into the VFS
    await window.spire.FetchFileToVFS('ARIAL.TTF', '/Library/Fonts/', `${process.env.PUBLIC_URL}/font/`);
    const inputFileName = 'Shapes.pptx';
    await window.spire.FetchFileToVFS(inputFileName, '', `${process.env.PUBLIC_URL}data/`);

    // Load the presentation and get the first slide
    const ppt = new pptModule.Presentation();
    ppt.LoadFromFile(inputFileName);
    const slide = ppt.Slides.get_Item(0);

    // Collect every shape on the slide
    const shapes = [];
    for (let i = 0; i < slide.Shapes.Count; i++) {
      shapes.push(slide.Shapes.get_Item(i));
    }

    // Group these shapes into a single unit
    slide.GroupShapes(shapes);

    // Save the result file
    const outputFileName = 'GroupShapes.pptx';
    ppt.SaveToFile({ file: outputFileName, fileFormat: pptModule.FileFormat.Pptx2013 });
    ppt.Dispose();

    // Read the generated file from the VFS and trigger the download
    const fileArray = window.dotnetRuntime.Module.FS.readFile(outputFileName);
    const blob = new Blob([fileArray], { type: 'application/vnd.openxmlformats-officedocument.presentationml.presentation' });
    const url = URL.createObjectURL(blob);
    const a = document.createElement('a');
    a.href = url;
    a.download = outputFileName;
    a.click();
    URL.revokeObjectURL(url);
  };

  return (
    <div style={{ textAlign: 'center', height: '300px' }}>
      <h1>Group and Ungroup Shapes</h1>
      <button onClick={groupShapes}>
        Group Shapes
      </button>
    </div>
  );
}

export default App;
Presentation after grouping all shapes on the slide:
Ungroup PowerPoint Shapes
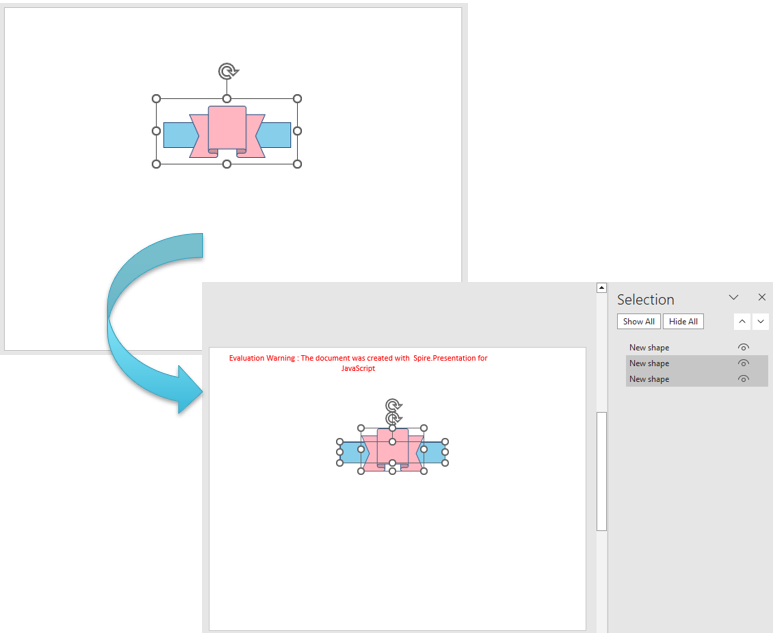
After a group is created, changing one member—its color, text, or position—requires ungrouping first. Ungrouping returns the member shapes to the slide's shape collection, removes the group itself, and leaves each shape at its original position and size.
| Usage | Result |
|---|---|
slide.Shapes.Count |
The total number of shapes on the current slide |
slide.Shapes.get_Item(i) |
Get the i-th shape by index |
shape instanceof pptModule.GroupShape |
Check whether the shape is a group shape |
slide.Ungroup(shape) |
Ungroup the shapes, return them to the slide, and remove the group itself |
The steps are:
- Get the Spire.Presentation WASM module and make sure it is ready, then load the font file and the presentation into the VFS.
- Create a
Presentationobject, callLoadFromFile()to load the presentation, and useSlides.get_Item()to get the slide that holds the group. - Loop from 0 over
Shapes.Countand get each shape on the slide withShapes.get_Item(i). - Check whether the shape is a group with
shape instanceof pptModule.GroupShape, and callslide.Ungroup()when it matches. - Call
Presentation.SaveToFile()to save the result file andDispose()to release the presentation, then read the file from the VFS and trigger the download.
The code for ungrouping PowerPoint shapes is as follows:
function App() {
  const ungroupShapes = async () => {
    // Get the Spire.Presentation WASM module
    const pptModule = window.wasmModule?.spirepresentation;

    // Check that the module is ready
    if (!pptModule) {
      alert('Spire.Presentation is not ready yet');
      return;
    }

    // Load the font and the presentation into the VFS
    await window.spire.FetchFileToVFS('ARIAL.TTF', '/Library/Fonts/', `${process.env.PUBLIC_URL}/font/`);
    const inputFileName = 'Shapes.pptx';
    await window.spire.FetchFileToVFS(inputFileName, '', `${process.env.PUBLIC_URL}data/`);

    // Load the presentation and get the second slide
    const ppt = new pptModule.Presentation();
    ppt.LoadFromFile(inputFileName);
    const slide = ppt.Slides.get_Item(1);

    // Loop over the shapes on the slide and ungroup any group
    for (let i = 0; i < slide.Shapes.Count; i++) {
      const shape = slide.Shapes.get_Item(i);
      if (shape instanceof pptModule.GroupShape) {
        slide.Ungroup(shape);
      }
    }

    // Save the result file
    const outputFileName = 'UngroupShapes.pptx';
    ppt.SaveToFile({ file: outputFileName, fileFormat: pptModule.FileFormat.Pptx2013 });
    ppt.Dispose();

    // Read the generated file from the VFS and trigger the download
    const fileArray = window.dotnetRuntime.Module.FS.readFile(outputFileName);
    const blob = new Blob([fileArray], { type: 'application/vnd.openxmlformats-officedocument.presentationml.presentation' });
    const url = URL.createObjectURL(blob);
    const a = document.createElement('a');
    a.href = url;
    a.download = outputFileName;
    a.click();
    URL.revokeObjectURL(url);
  };

  return (
    <div style={{ textAlign: 'center', height: '300px' }}>
      <h1>Group and Ungroup Shapes</h1>
      <button onClick={ungroupShapes}>
        Ungroup Shapes
      </button>
    </div>
  );
}

export default App;
Presentation after ungrouping the shapes:
FAQ
Why does the number of shapes in the collection decrease after grouping
Cause: GroupShapes() collects the given shapes into a single group shape, and the group occupies only one position in the slide's shape collection, so the number of shapes in the collection decreases.
Solution: The member shapes are still there. Retrieve them one by one through the GroupShape.Shapes collection:
const group = slide.Shapes.get_Item(0);
const innerCount = group.Shapes.Count;
Can a single shape be grouped
Cause: Grouping merges multiple shapes into one unit; with only one shape there is nothing to merge.
Solution: Put at least two shapes into the array before calling GroupShapes(). Passing a single shape does not create a group, and the number of shapes on the slide stays the same.
How can only some of the shapes on a slide be grouped
Cause: GroupShapes() processes only the shapes in the array that is passed to it; the other shapes are not affected.
Solution: Pick the shapes you need by index, put them in an array, and pass it to GroupShapes():
slide.GroupShapes([slide.Shapes.get_Item(0), slide.Shapes.get_Item(2)]);
Get a Free License
If you wish to delete the evaluation message from the resulting documents, or to get rid of function limitations, please contact sales to obtain a valid 30-day temporary license.
Create a Sunburst Chart in Excel with JavaScript in React
When data carries several levels of categories, a flattened table makes it hard to read the hierarchy and the share of each level at the same time. A sunburst chart places the levels in a set of concentric rings: the inner ring holds the upper categories, the outer rings hold the lower ones, and the angle of each sector reflects the share of its value within the parent category. The chart shows both what the whole is made of and how large each share is. Spire.XLS for JavaScript creates and saves sunburst charts in the browser through WebAssembly, with input and output files managed by a virtual file system (VFS) and no backend service required.
This article covers two features:
For installation and project setup, see Integrating Spire.XLS for JavaScript in a React Project. The examples below assume that Spire.XLS is installed and the WebAssembly module is initialized.
Create a Sunburst Chart
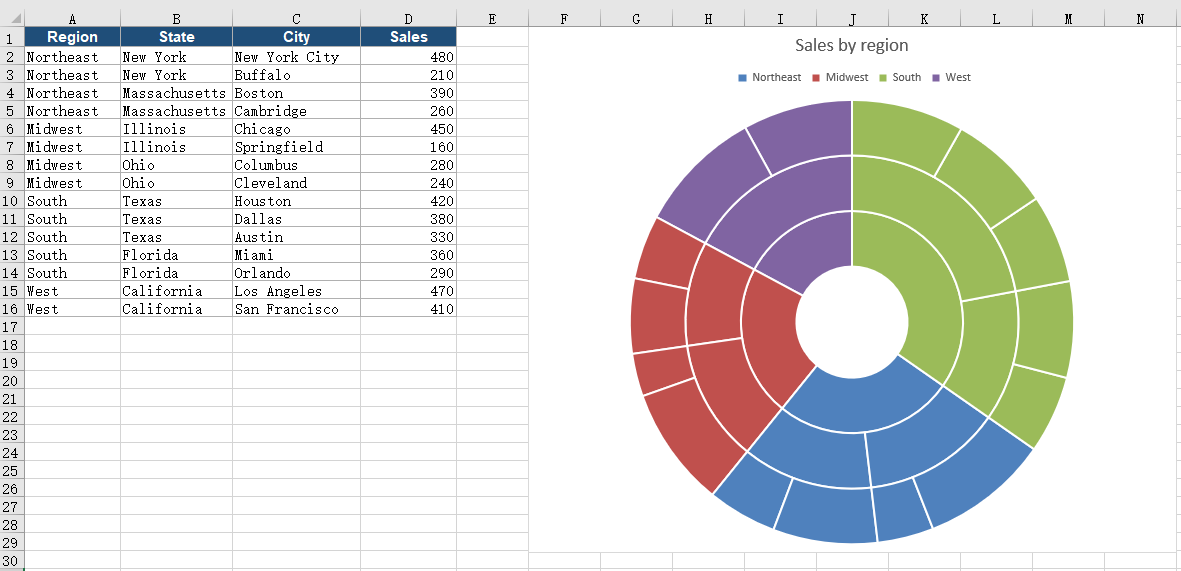
A sunburst chart reads several hierarchy columns from the inside out and uses the last column as the value. To build a usable chart, prepare several columns of hierarchy data and one value column, set the chart type to sunburst, then determine the data range, chart position, and title. Once the chart is created and saved as an Excel workbook, it can be opened, edited, or shared in spreadsheet software.
What the calls do when you create a sunburst chart:
| Call | Result |
|---|---|
window.spire.FetchFileToVFS |
Loads the font file and the input file into the virtual file system |
workbook.LoadFromFile({ fileName }) |
Loads an Excel workbook |
workbook.Worksheets.get(0) |
Gets the first worksheet in the workbook |
sheet.Charts.Add() |
Adds a chart object to the worksheet |
chart.ChartType = xlsModule.ExcelChartType.SunBurst |
Sets the chart type to sunburst |
chart.DataRange |
Sets the specified cell range as the chart data source |
chart.ChartTitle |
Sets the chart title |
chart.TopRow / chart.BottomRow / chart.LeftColumn / chart.RightColumn |
Sets the position and size of the chart on the worksheet |
workbook.SaveToFile({ fileName }) |
Writes the workbook with the sunburst chart into the virtual file system |
The steps are:
- Use
window.spire.FetchFileToVFSto load the font file and the Excel test file into the VFS. - Create a workbook with
new Workbook(), then load the test file withworkbook.LoadFromFile. - Call
workbook.Worksheets.get(0)to get the first worksheet. - Add a chart with
sheet.Charts.Add(), then setchart.ChartTypetoxlsModule.ExcelChartType.SunBurst. - Set
chart.DataRangeto the range that holds the hierarchy columns and the value column (in the example,sheet.Range.get("A1:D16")); the last column determines the angle of each sector. - Set
chart.ChartTitle, and usechart.TopRow,chart.BottomRow,chart.LeftColumn, andchart.RightColumnto place the chart in columns 6 to 15, to the right of the data area, so it does not cover the original data. - Call
workbook.SaveToFileto writeCreateSunburst.xlsx, then useworkbook.Disposeto release resources and read the workbook back from the VFS to trigger the download.
The following is the complete code example that creates a sunburst chart in React and saves it in an Excel workbook:
function App() {
  const createSunburst = async () => {
    // Get the Spire.XLS WASM module
    const xlsModule = window.wasmModule?.spirexls;

    // Check that the module is ready
    if (!xlsModule) {
      alert('Spire.Xls is not ready yet');
      return;
    }

    // Load the font and the test data file into the VFS
    await window.spire.FetchFileToVFS('ARIAL.TTF', '/Library/Fonts/', `${process.env.PUBLIC_URL}/font/`);
    const inputFileName = 'SunburstData.xlsx';
    await window.spire.FetchFileToVFS(inputFileName, '', `${process.env.PUBLIC_URL}data/`);

    // Load the workbook
    const workbook = new xlsModule.Workbook();
    workbook.LoadFromFile({ fileName: inputFileName });

    // Get the first worksheet
    const sheet = workbook.Worksheets.get(0);

    // Add a chart and set its type to sunburst
    const chart = sheet.Charts.Add();
    chart.ChartType = xlsModule.ExcelChartType.SunBurst;

    // Set the data range: the first three columns are region, state and city, the last is sales
    chart.DataRange = sheet.Range.get('A1:D16');

    // Set the position and size of the chart
    chart.TopRow = 1;
    chart.BottomRow = 30;
    chart.LeftColumn = 6;
    chart.RightColumn = 15;

    // Set the chart title
    chart.ChartTitle = 'Sales by region';

    // Save the workbook with the sunburst chart into the VFS
    const outputFileName = 'CreateSunburst.xlsx';
    workbook.SaveToFile({ fileName: outputFileName });

    // Dispose of the workbook to release its resources
    workbook.Dispose();

    // Read the result back out of the VFS and trigger the download
    const fileArray = window.dotnetRuntime.Module.FS.readFile(outputFileName);
    const blob = new Blob([fileArray], { type: 'application/vnd.openxmlformats-officedocument.spreadsheetml.sheet' });
    const url = URL.createObjectURL(blob);
    const a = document.createElement('a');
    a.href = url;
    a.download = outputFileName;
    a.click();
    URL.revokeObjectURL(url);
  };

  return (
    <div style={{ textAlign: 'center', height: '300px' }}>
      <h1>Create a Sunburst Chart in React</h1>
      <button id="create-sunburst" onClick={createSunburst}>Create Sunburst</button>
    </div>
  );
}

export default App;
The workbook after creating the sunburst chart:
Show Data Labels on the Sectors of a Sunburst Chart
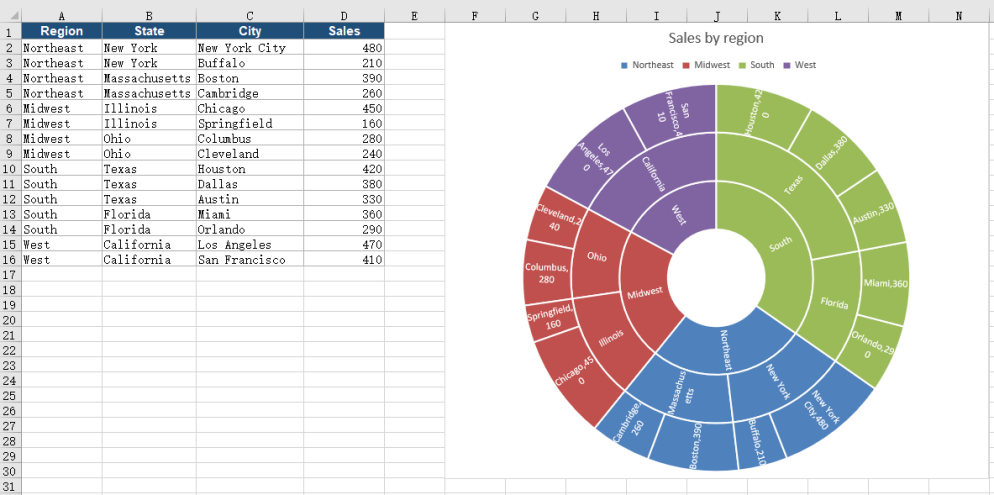
A newly created sunburst chart shows only colored sectors, with no names or values, so readers cannot tell which category each sector stands for or what its value is. Turning on category name and value labels for every sector puts the category and its value right on the sector, so each ring can be read piece by piece.
What the calls do when you show data labels on the sectors of a sunburst chart:
| Call | Result |
|---|---|
chart.Series.get(0).DataPoints |
Gets the data point collection; each data row is one sector on the outer ring |
chart.Series.get(0).DataPoints.DefaultDataPoint.DataLabels |
Gets the label object of the default data point, which applies to every sector |
labels.HasCategoryName = true |
Shows the category name on each sector |
labels.HasValue = true |
Shows the matching value next to the name |
workbook.SaveToFile({ fileName }) |
Writes the workbook with the labeled sunburst chart into the virtual file system |
The steps are:
- Use
window.spire.FetchFileToVFSto load the font file and the test file into the VFS, then load the workbook withworkbook.LoadFromFile. - Call
workbook.Worksheets.get(0)to get the worksheet, add a chart withsheet.Charts.Add()and set it toxlsModule.ExcelChartType.SunBurst, then setchart.DataRange, the title, and the position. - Get the label object through
chart.Series.get(0).DataPoints.DefaultDataPoint.DataLabels, and setHasCategoryNametotrueso each sector shows its category name. - Set
HasValueon the same label object totrueso the value of the sector appears next to the name. - Call
workbook.SaveToFileto writeSunburstLabels.xlsx, then useworkbook.Disposeto release resources and trigger the download.
The following is the complete code example that shows data labels on the sectors of a sunburst chart:
function App() {
  const styleSunburst = async () => {
    // Get the Spire.XLS WASM module
    const xlsModule = window.wasmModule?.spirexls;

    // Check that the module is ready
    if (!xlsModule) {
      alert('Spire.Xls is not ready yet');
      return;
    }

    // Load the font and the test data file into the VFS
    await window.spire.FetchFileToVFS('ARIAL.TTF', '/Library/Fonts/', `${process.env.PUBLIC_URL}/font/`);
    const inputFileName = 'SunburstData.xlsx';
    await window.spire.FetchFileToVFS(inputFileName, '', `${process.env.PUBLIC_URL}data/`);

    // Load the workbook
    const workbook = new xlsModule.Workbook();
    workbook.LoadFromFile({ fileName: inputFileName });

    // Get the first worksheet
    const sheet = workbook.Worksheets.get(0);

    // Add a sunburst chart and set its data range
    const chart = sheet.Charts.Add();
    chart.ChartType = xlsModule.ExcelChartType.SunBurst;
    chart.DataRange = sheet.Range.get('A1:D16');
    chart.TopRow = 1;
    chart.BottomRow = 31;
    chart.LeftColumn = 6;
    chart.RightColumn = 14;
    chart.ChartTitle = 'Sales by region';

    // Enable category name and value labels so every sector shows both
    const labels = chart.Series.get(0).DataPoints.DefaultDataPoint.DataLabels;
    labels.HasCategoryName = true;
    labels.HasValue = true;

    // Save the workbook with the sunburst chart into the VFS
    const outputFileName = 'SunburstLabels.xlsx';
    workbook.SaveToFile({ fileName: outputFileName });

    // Dispose of the workbook to release its resources
    workbook.Dispose();

    // Read the result back out of the VFS and trigger the download
    const fileArray = window.dotnetRuntime.Module.FS.readFile(outputFileName);
    const blob = new Blob([fileArray], { type: 'application/vnd.openxmlformats-officedocument.spreadsheetml.sheet' });
    const url = URL.createObjectURL(blob);
    const a = document.createElement('a');
    a.href = url;
    a.download = outputFileName;
    a.click();
    URL.revokeObjectURL(url);
  };

  return (
    <div style={{ textAlign: 'center', height: '300px' }}>
      <h1>Create a Sunburst Chart in React</h1>
      <button id="style-sunburst" onClick={styleSunburst}>Show Data Labels</button>
    </div>
  );
}

export default App;
The workbook after showing data labels:
FAQ
How should the data for a sunburst chart be arranged
Cause: A sunburst chart reads every column before the value column as a hierarchy level from the inside out, and uses the last column as the value. The order of the columns directly determines how the rings nest.
Solution: Put the upper category in the first column, the middle category in the second, and the lower category in the third, then put the value in the last column. Have chart.DataRange include the header row, for example sheet.Range.get("A1:D16"). Keep the hierarchy columns as text and the value column numeric.
How can the legend of a sunburst chart be hidden
Cause: The chart shows a legend by default, and a legend next to the rings takes up part of the plot area.
Solution: Set chart.HasLegend to false before saving the workbook, and the legend is removed from the chart:
chart.HasLegend = false;
Should I choose a sunburst chart or a treemap
Cause: Both map multi-level categories onto a graphic, but the presentation differs. A sunburst chart uses concentric rings for the hierarchy, with sector angles for proportions; a treemap uses nested rectangles, with rectangle areas for values.
Solution: Choose a sunburst chart when the proportions at each level matter, and set chart.ChartType to xlsModule.ExcelChartType.SunBurst. Choose a treemap when comparing values and emphasizing area differences, and set chart.ChartType to xlsModule.ExcelChartType.TreeMap.
Get a Free License
If you wish to delete the evaluation message from the resulting documents, or to get rid of function limitations, please contact sales to obtain a valid 30-day temporary license.
Add a Waterfall Chart in Excel with JavaScript in React
When a set of values accumulates step by step, with both increases and decreases along the way, the start and the end alone do not show how much each step contributed. A waterfall chart draws every change as a floating bar that starts at the previous running total and rises or falls to the next one; adjacent bars meet end to end, so the series shows both the size of each change and the running result after every step. Spire.XLS for JavaScript creates and saves waterfall charts in the browser through WebAssembly, with input and output files managed by a virtual file system (VFS) and no backend service required.
This article covers three features:
- Create a Waterfall Chart
- Mark the Specified Data Points as Totals
- Hide the Connector Lines Between Data Points
For installation and project setup, see Integrating Spire.XLS for JavaScript in a React Project. The examples below assume that Spire.XLS is installed and the WebAssembly module is initialized.
Create a Waterfall Chart
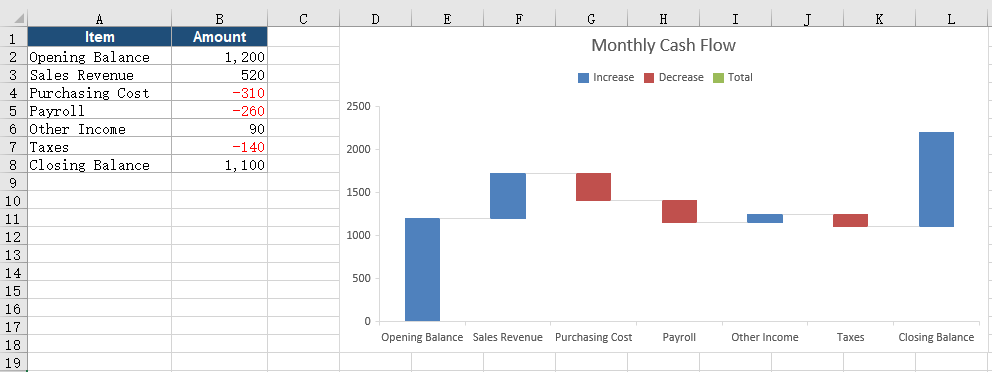
To build a usable waterfall chart, prepare one column of categories and one column of values, set the chart type to waterfall, then determine the data range, chart position, and title. Once the chart is created and saved as an Excel workbook, it can be opened, edited, or shared in spreadsheet software.
What the calls do when you create a waterfall chart:
| Call | Result |
|---|---|
window.spire.FetchFileToVFS |
Loads the font and the input file into the virtual file system |
workbook.LoadFromFile({ fileName }) |
Loads an Excel workbook |
workbook.Worksheets.get(0) |
Gets the first worksheet of the workbook |
sheet.Charts.Add() |
Adds a chart object to the worksheet |
chart.ChartType = xlsModule.ExcelChartType.WaterFall |
Sets the chart type to waterfall |
chart.DataRange |
Sets the specified cell range as the chart data source |
chart.ChartTitle |
Sets the chart title |
chart.TopRow / chart.BottomRow / chart.LeftColumn / chart.RightColumn |
Sets the position and size of the chart on the worksheet |
workbook.SaveToFile({ fileName }) |
Writes the workbook with the waterfall chart into the virtual file system |
The steps are:
- Load the font file and the Excel test file into the VFS with
window.spire.FetchFileToVFS. - Create a workbook with
new Workbook()and load the test file withworkbook.LoadFromFile. - Call
workbook.Worksheets.get(0)to get the first worksheet. - Add a chart with
sheet.Charts.Add()and setchart.ChartTypetoxlsModule.ExcelChartType.WaterFall. - Set
chart.DataRangeto the range that holds the categories and values (in the example,sheet.Range.get('A1:B8')); the first column holds the categories and the second the values, so positive values add upward and negative values subtract downward. - Set
chart.ChartTitle, then place the chart in columns 4 to 12 to the right of the data withchart.TopRow,chart.BottomRow,chart.LeftColumn, andchart.RightColumn, so it neither covers the table nor crowds it. - Call
workbook.SaveToFileto writeCreateWaterfall.xlsx, then release the resources withworkbook.Disposeand read the workbook out of the VFS to trigger the download.
The complete example below shows how to create a waterfall chart and save it in an Excel workbook in React:
function App() {
  // Create a waterfall chart and save it in an Excel workbook
  const createWaterfall = async () => {
    // Get the Spire.XLS WASM module
    const xlsModule = window.wasmModule?.spirexls;

    // Check that the module is ready
    if (!xlsModule) {
      alert('Spire.Xls is not ready yet');
      return;
    }

    // Load the font and the test data file into the VFS
    await window.spire.FetchFileToVFS('ARIAL.TTF', '/Library/Fonts/', `${process.env.PUBLIC_URL}/font/`);
    const inputFileName = 'WaterfallData.xlsx';
    await window.spire.FetchFileToVFS(inputFileName, '', `${process.env.PUBLIC_URL}data/`);

    // Load the workbook
    const workbook = new xlsModule.Workbook();
    workbook.LoadFromFile({ fileName: inputFileName });

    // Get the first worksheet
    const sheet = workbook.Worksheets.get(0);

    // Add a chart and set its type to waterfall
    const chart = sheet.Charts.Add();
    chart.ChartType = xlsModule.ExcelChartType.WaterFall;

    // Set the data range: the first column holds the items, the second the amounts
    chart.DataRange = sheet.Range.get('A1:B8');

    // Set the position and size of the chart
    chart.TopRow = 1;
    chart.BottomRow = 19;
    chart.LeftColumn = 4;
    chart.RightColumn = 13;

    // Set the chart title
    chart.ChartTitle = 'Monthly Cash Flow';

    // Save the workbook with the waterfall chart into the VFS
    const outputFileName = 'CreateWaterfall.xlsx';
    workbook.SaveToFile({ fileName: outputFileName });

    // Dispose of the workbook to release its resources
    workbook.Dispose();

    // Read the result back out of the VFS and trigger the download
    const fileArray = window.dotnetRuntime.Module.FS.readFile(outputFileName);
    const blob = new Blob([fileArray], { type: 'application/vnd.openxmlformats-officedocument.spreadsheetml.sheet' });
    const url = URL.createObjectURL(blob);
    const a = document.createElement('a');
    a.href = url;
    a.download = outputFileName;
    a.click();
    URL.revokeObjectURL(url);
  };

  return (
    <div style={{ textAlign: 'center', height: '300px' }}>
      <h1>Create a Waterfall Chart in React</h1>
      <button id="create-waterfall" onClick={createWaterfall}>Create Waterfall</button>
    </div>
  );
}

export default App;
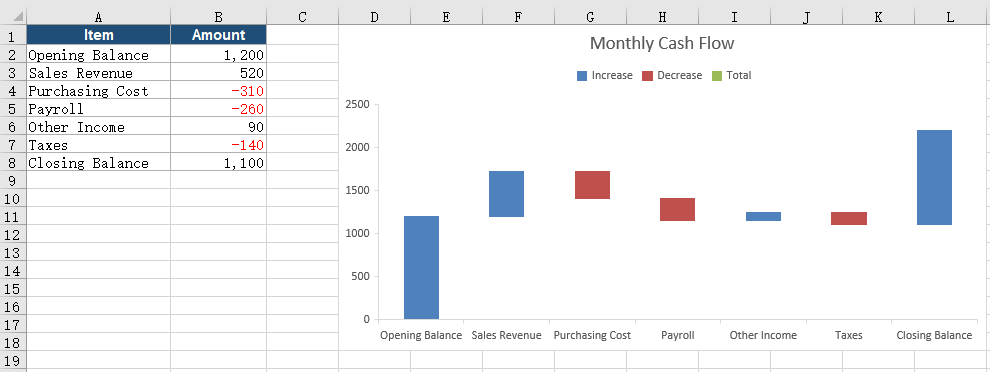
The workbook after creating the waterfall chart:
Mark the Specified Data Points as Totals
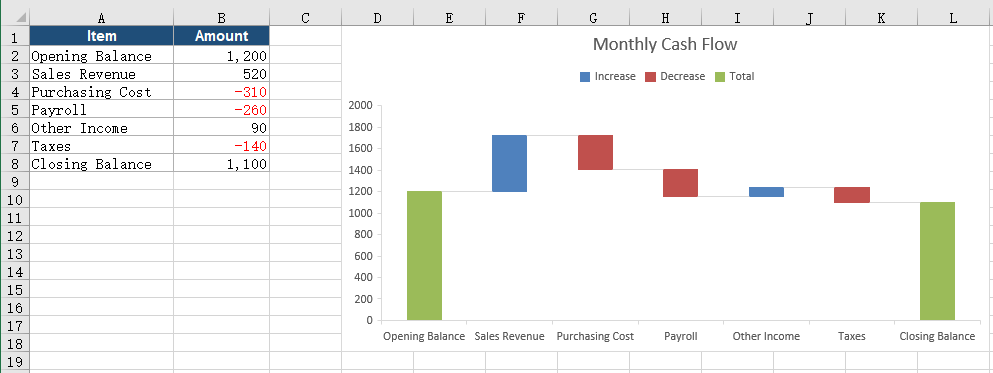
By default a waterfall chart treats every row as a change, and each bar floats on from the previous running total. The summary values at the start and the end of the sequence are not changes, so both should rise from zero and stand apart from the additions and deductions in between. Once the matching data points are marked as totals, the two bars appear as full columns, and the reader can pick out the start and the end at a glance.
What the calls do when you mark data points as totals:
| Call | Result |
|---|---|
chart.Series.get(0) |
Gets the first data series of the chart |
chart.Series.get(0).DataPoints |
Gets the data point collection, one point per data row |
DataPoints.get(i).SetAsTotal = true |
Marks the data point at index i as a total so the bar starts from zero |
workbook.SaveToFile({ fileName }) |
Writes the workbook with the total marks into the virtual file system |
The steps are:
- Load the font file and the test file into the VFS with
window.spire.FetchFileToVFS, then load the workbook withworkbook.LoadFromFileand get the first worksheet. - Add a chart with
sheet.Charts.Add(), setchart.ChartTypetoxlsModule.ExcelChartType.WaterFall, and setchart.DataRange, the title, and the position. - Get the data point collection through
chart.Series.get(0).DataPoints; the indexes start at 0 and follow the data rows in order. - Set both
DataPoints.get(0).SetAsTotalandDataPoints.get(6).SetAsTotaltotrue, so the data points in the first and last rows become total columns. - Call
workbook.SaveToFileto writeMarkTotals.xlsx, then release the resources withworkbook.Disposeand trigger the download.
The complete example below shows how to mark the opening and closing data points as totals:
function App() {
  // Mark the opening and closing data points as totals
  const markTotals = async () => {
    // Get the Spire.XLS WASM module
    const xlsModule = window.wasmModule?.spirexls;

    // Check that the module is ready
    if (!xlsModule) {
      alert('Spire.Xls is not ready yet');
      return;
    }

    // Load the font and the test data file into the VFS
    await window.spire.FetchFileToVFS('ARIAL.TTF', '/Library/Fonts/', `${process.env.PUBLIC_URL}/font/`);
    const inputFileName = 'WaterfallData.xlsx';
    await window.spire.FetchFileToVFS(inputFileName, '', `${process.env.PUBLIC_URL}data/`);

    // Load the workbook
    const workbook = new xlsModule.Workbook();
    workbook.LoadFromFile({ fileName: inputFileName });

    // Get the first worksheet
    const sheet = workbook.Worksheets.get(0);

    // Add a waterfall chart and set its data range
    const chart = sheet.Charts.Add();
    chart.ChartType = xlsModule.ExcelChartType.WaterFall;
    chart.DataRange = sheet.Range.get('A1:B8');
    chart.TopRow = 1;
    chart.BottomRow = 19;
    chart.LeftColumn = 4;
    chart.RightColumn = 13;
    chart.ChartTitle = 'Monthly Cash Flow';

    // Mark the first and last data points as totals so both bars start from zero
    const points = chart.Series.get(0).DataPoints;
    points.get(0).SetAsTotal = true;
    points.get(6).SetAsTotal = true;

    // Save the workbook with the total data points into the VFS
    const outputFileName = 'MarkTotals.xlsx';
    workbook.SaveToFile({ fileName: outputFileName });

    // Dispose of the workbook to release its resources
    workbook.Dispose();

    // Read the result back out of the VFS and trigger the download
    const fileArray = window.dotnetRuntime.Module.FS.readFile(outputFileName);
    const blob = new Blob([fileArray], { type: 'application/vnd.openxmlformats-officedocument.spreadsheetml.sheet' });
    const url = URL.createObjectURL(blob);
    const a = document.createElement('a');
    a.href = url;
    a.download = outputFileName;
    a.click();
    URL.revokeObjectURL(url);
  };

  return (
    <div style={{ textAlign: 'center', height: '300px' }}>
      <h1>Create a Waterfall Chart in React</h1>
      <button id="mark-totals" onClick={markTotals}>Mark Totals</button>
    </div>
  );
}

export default App;
The workbook after marking the data points as totals:
Hide the Connector Lines Between Data Points
A waterfall chart draws connector lines between adjacent bars by default, joining where one bar ends to where the next bar starts. When the bars are narrow, the labels are many, or the result has to render in a viewer with limited display support, those lines crowd against the labels and gridlines and make the chart look busy. With the connector lines hidden, the height relationship between the bars is still easy to read, and the layout is cleaner.
What the calls do when you hide the connector lines:
| Call | Result |
|---|---|
chart.Series.get(0).Format |
Gets the format object of the data series |
chart.Series.get(0).Format.ShowConnectorLines = false |
Turns off the connector lines between adjacent data points |
workbook.SaveToFile({ fileName }) |
Writes the workbook without the connector lines into the virtual file system |
The steps are:
- Load the font file and the test file into the VFS with
window.spire.FetchFileToVFS, then load the workbook withworkbook.LoadFromFileand get the first worksheet. - Add a chart with
sheet.Charts.Add(), setchart.ChartTypetoxlsModule.ExcelChartType.WaterFall, and setchart.DataRange, the title, and the position. - Get the format object of the data series through
chart.Series.get(0).Formatand set itsShowConnectorLinestofalse, which removes the connector lines between adjacent data points. - Call
workbook.SaveToFileto writeHideConnectorLines.xlsx, then release the resources withworkbook.Disposeand trigger the download.
The complete example below shows how to hide the connector lines between data points in a waterfall chart:
function App() {
  // Hide the connector lines between the data points
  const hideConnectorLines = async () => {
    // Get the Spire.XLS WASM module
    const xlsModule = window.wasmModule?.spirexls;

    // Check that the module is ready
    if (!xlsModule) {
      alert('Spire.Xls is not ready yet');
      return;
    }

    // Load the font and the test data file into the VFS
    await window.spire.FetchFileToVFS('ARIAL.TTF', '/Library/Fonts/', `${process.env.PUBLIC_URL}/font/`);
    const inputFileName = 'WaterfallData.xlsx';
    await window.spire.FetchFileToVFS(inputFileName, '', `${process.env.PUBLIC_URL}data/`);

    // Load the workbook
    const workbook = new xlsModule.Workbook();
    workbook.LoadFromFile({ fileName: inputFileName });

    // Get the first worksheet
    const sheet = workbook.Worksheets.get(0);

    // Add a waterfall chart and set its data range
    const chart = sheet.Charts.Add();
    chart.ChartType = xlsModule.ExcelChartType.WaterFall;
    chart.DataRange = sheet.Range.get('A1:B8');
    chart.TopRow = 1;
    chart.BottomRow = 19;
    chart.LeftColumn = 4;
    chart.RightColumn = 13;
    chart.ChartTitle = 'Monthly Cash Flow';

    // Turn off the connector lines between adjacent data points
    chart.Series.get(0).Format.ShowConnectorLines = false;

    // Save the workbook without the connector lines into the VFS
    const outputFileName = 'HideConnectorLines.xlsx';
    workbook.SaveToFile({ fileName: outputFileName });

    // Dispose of the workbook to release its resources
    workbook.Dispose();

    // Read the result back out of the VFS and trigger the download
    const fileArray = window.dotnetRuntime.Module.FS.readFile(outputFileName);
    const blob = new Blob([fileArray], { type: 'application/vnd.openxmlformats-officedocument.spreadsheetml.sheet' });
    const url = URL.createObjectURL(blob);
    const a = document.createElement('a');
    a.href = url;
    a.download = outputFileName;
    a.click();
    URL.revokeObjectURL(url);
  };

  return (
    <div style={{ textAlign: 'center', height: '300px' }}>
      <h1>Create a Waterfall Chart in React</h1>
      <button id="hide-connector-lines" onClick={hideConnectorLines}>Hide Connector Lines</button>
    </div>
  );
}

export default App;
The workbook with the connector lines hidden:
FAQ
How do I show values on a waterfall chart
Cause: The bar height of a waterfall chart shows the size of each change, while the exact amount still has to be read back from the data table.
Solution: Get the label object of the default data point and set HasValue to true; if needed, also set Position to xlsModule.DataLabelPositionType.Center so the labels sit in the centre of the bars:
const labels = chart.Series.get(0).DataPoints.DefaultDataPoint.DataLabels;
labels.HasValue = true;
labels.Position = xlsModule.DataLabelPositionType.Center;
How can the minimum and maximum of the value axis be adjusted
Cause: The value axis of a waterfall chart scales automatically to the data, which can flatten the differences between bars or leave excess space at both ends.
Solution: Set chart.PrimaryValueAxis.MinValue and MaxValue before saving the workbook to fix the axis to a clear range. The example limits the range from 1000 to 2000:
chart.PrimaryValueAxis.MinValue = 1000;
chart.PrimaryValueAxis.MaxValue = 2000;
Make sure the range covers the cumulative values of all bars; a range that is too narrow cuts off the parts beyond it.
Should I choose a waterfall chart or a stacked column chart
Cause: Both can show a total made of several parts, but they emphasize different things. A stacked column chart stacks the parts in one column and highlights how the total is composed; a waterfall chart splits the parts into separate bars that meet end to end and highlights the effect of each change on the running result.
Solution: Choose a stacked column chart when the composition and the share of each part matter; choose a waterfall chart when you need to trace how a balance moves from the start through several changes to the end, and set chart.ChartType to xlsModule.ExcelChartType.WaterFall.
Get a Free License
If you wish to delete the evaluation message from the resulting documents, or to get rid of function limitations, please contact sales to obtain a valid 30-day temporary license.
Add Checkboxes in Excel with JavaScript in React
Task lists, checklists, and to-do lists often need a tick for each item. Compared with typing yes or no into a cell, a checkbox makes the completion state obvious and reduces input mistakes. This article uses Spire.XLS for JavaScript to add checkboxes to Excel in the browser, with input and output files managed in a virtual file system (VFS) and no back-end service.
This article covers two core features:
For installation and project configuration, see Integrating Spire.XLS for JavaScript in a React Project. The examples below assume that Spire.XLS is installed and the WebAssembly module has been initialized.
Add a checkbox and set its caption
A checkbox floats above the cells as a form control; its position is determined by the row and column where it is added, and its size is measured in pixels. After adding it, set the caption so readers know which item it represents, then adjust the position and size as needed.
Writing and result for adding a checkbox and setting its caption:
| Writing | Result |
|---|---|
sheet.CheckBoxes.AddCheckBox(row, column, height, width) |
Adds a checkbox at the specified row and column |
checkbox.Text = text |
Sets the checkbox caption |
checkbox.CheckState = xlsModule.CheckState.Unchecked |
Displays the checkbox as unchecked |
checkbox.CheckState = xlsModule.CheckState.Checked |
Displays the checkbox as checked |
checkbox.CheckState = xlsModule.CheckState.Mixed |
Displays the checkbox in the mixed state |
The steps are:
- Load the font file and the Excel test file into the VFS with
window.spire.FetchFileToVFS. - Create a workbook with
new Workbook()and load the test file throughworkbook.LoadFromFile. - Get the task list worksheet with
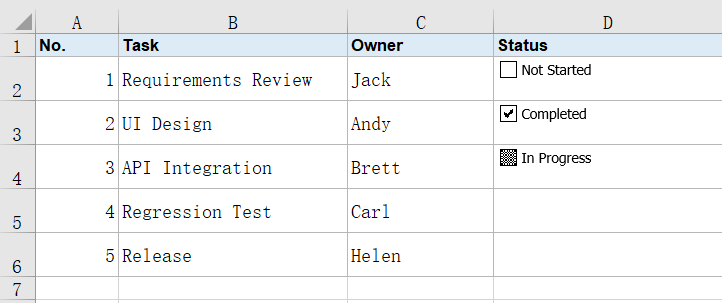
workbook.Worksheets.get(0). - Add one checkbox each at rows 2, 3, and 4, column 4, with
sheet.CheckBoxes.AddCheckBox(row, column, height, width). - Set
checkbox.Textof the three checkboxes to Not Started, Completed, and In Progress. - Set
checkbox.CheckStateof the three checkboxes toxlsModule.CheckState.Unchecked,xlsModule.CheckState.Checked, andxlsModule.CheckState.Mixedto show the three states. - Write the result file with
workbook.SaveToFile, release resources withworkbook.Dispose, and read the workbook from the VFS to trigger the download.
Below is the complete code example that adds a checkbox and sets its caption:
function App() {
  const addCheckbox = async () => {
    // Get the Spire.XLS WASM module
    const xlsModule = window.wasmModule?.spirexls;

    // Check that the module is ready
    if (!xlsModule) {
      alert('Spire.Xls is not ready yet');
      return;
    }

    // Load the font and the test data file into the VFS
    await window.spire.FetchFileToVFS('ARIAL.TTF', '/Library/Fonts/', `${process.env.PUBLIC_URL}/font/`);
    const inputFileName = 'CheckBoxData.xlsx';
    await window.spire.FetchFileToVFS(inputFileName, '', `${process.env.PUBLIC_URL}data/`);

    // Load the workbook
    const workbook = new xlsModule.Workbook();
    workbook.LoadFromFile({ fileName: inputFileName });

    // Get the task list worksheet
    const sheet = workbook.Worksheets.get(0);

    // Add a checkbox at rows 2, 3, and 4, column 4
    const uncheckedBox = sheet.CheckBoxes.AddCheckBox(2, 4, 20, 120);
    const checkedBox = sheet.CheckBoxes.AddCheckBox(3, 4, 20, 120);
    const mixedBox = sheet.CheckBoxes.AddCheckBox(4, 4, 20, 120);

    // Set the caption for each of the three checkboxes
    uncheckedBox.Text = 'Not Started';
    checkedBox.Text = 'Completed';
    mixedBox.Text = 'In Progress';

    // Set the unchecked, checked, and mixed states respectively
    uncheckedBox.CheckState = xlsModule.CheckState.Unchecked;
    checkedBox.CheckState = xlsModule.CheckState.Checked;
    mixedBox.CheckState = xlsModule.CheckState.Mixed;

    // Save the result into the VFS
    const outputFileName = 'AddCheckbox.xlsx';
    workbook.SaveToFile({ fileName: outputFileName });

    // Dispose of the workbook to release its resources
    workbook.Dispose();

    // Read the result back out of the VFS and trigger the download
    const fileArray = window.dotnetRuntime.Module.FS.readFile(outputFileName);
    const blob = new Blob([fileArray], { type: 'application/vnd.openxmlformats-officedocument.spreadsheetml.sheet' });
    const url = URL.createObjectURL(blob);
    const a = document.createElement('a');
    a.href = url;
    a.download = outputFileName;
    a.click();
    URL.revokeObjectURL(url);
  };

  return (
    <div style={{ textAlign: 'center', height: '300px' }}>
      <h1>Add Checkboxes in Excel in React</h1>
      <button id="add-checkbox" onClick={addCheckbox}>Add Checkbox</button>
    </div>
  );
}

export default App;
Workbook after adding a checkbox:
Adjust checkbox size and 3D shading
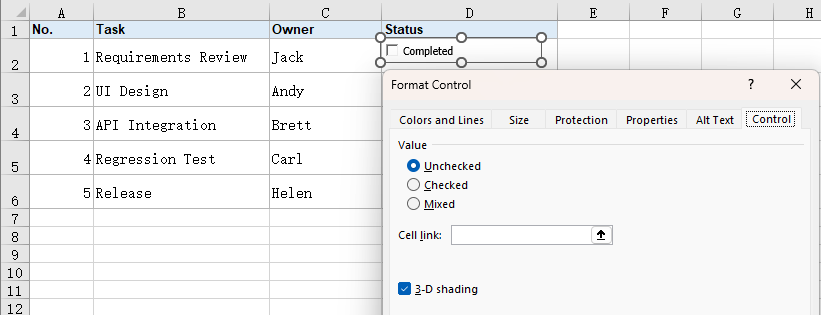
The default size suits short captions; when the caption is longer or the area needs to stand out, specify a larger width and height when adding the checkbox. The 3D effect adds a recessed border and shadow, bringing the checkbox closer to the look of a traditional form control.
Writing and result for adjusting checkbox size and 3D shading:
| Writing | Result |
|---|---|
sheet.CheckBoxes.AddCheckBox(row, column, height, width) |
Adds a checkbox with the specified size |
checkbox.Display3DShading = true |
Shows the 3D border and shadow on the checkbox |
The steps are:
- Load the font file and the Excel test file into the VFS with
window.spire.FetchFileToVFS. - Create a workbook with
new Workbook()and load the test file throughworkbook.LoadFromFile. - Get the task list worksheet with
workbook.Worksheets.get(0). - Add a larger checkbox with
sheet.CheckBoxes.AddCheckBox(2, 4, 24, 160)and set its caption. - Set
checkbox.Display3DShadingtotrue. - Write the result file with
workbook.SaveToFile, release resources withworkbook.Dispose, and read the workbook from the VFS to trigger the download.
Below is the complete code example that adjusts checkbox size and 3D shading:
function App() {
  const customizeCheckbox = async () => {
    // Get the Spire.XLS WASM module
    const xlsModule = window.wasmModule?.spirexls;

    // Check that the module is ready
    if (!xlsModule) {
      alert('Spire.Xls is not ready yet');
      return;
    }

    // Load the font and the test data file into the VFS
    await window.spire.FetchFileToVFS('ARIAL.TTF', '/Library/Fonts/', `${process.env.PUBLIC_URL}/font/`);
    const inputFileName = 'CheckBoxData.xlsx';
    await window.spire.FetchFileToVFS(inputFileName, '', `${process.env.PUBLIC_URL}data/`);

    // Load the workbook
    const workbook = new xlsModule.Workbook();
    workbook.LoadFromFile({ fileName: inputFileName });

    // Get the task list worksheet
    const sheet = workbook.Worksheets.get(0);

    // Add a larger checkbox and set its caption
    const checkbox = sheet.CheckBoxes.AddCheckBox(2, 4, 24, 160);
    checkbox.Text = 'Completed';

    // Show the 3D border and shadow
    checkbox.Display3DShading = true;

    // Save the result into the VFS
    const outputFileName = 'CheckboxSizeAndShading.xlsx';
    workbook.SaveToFile({ fileName: outputFileName });

    // Dispose of the workbook to release its resources
    workbook.Dispose();

    // Read the result back out of the VFS and trigger the download
    const fileArray = window.dotnetRuntime.Module.FS.readFile(outputFileName);
    const blob = new Blob([fileArray], { type: 'application/vnd.openxmlformats-officedocument.spreadsheetml.sheet' });
    const url = URL.createObjectURL(blob);
    const a = document.createElement('a');
    a.href = url;
    a.download = outputFileName;
    a.click();
    URL.revokeObjectURL(url);
  };

  return (
    <div style={{ textAlign: 'center', height: '300px' }}>
      <h1>Add Checkboxes in Excel in React</h1>
      <button id="size-and-shading" onClick={customizeCheckbox}>Size and 3D Shading</button>
    </div>
  );
}

export default App;
Workbook after adjusting checkbox size and 3D shading:
FAQ
Why does the added checkbox not appear where expected
Cause: The checkbox position is determined by the row and column specified when it is added. If that row or column is hidden, merged, or very small, the checkbox may be hidden or squeezed.
Solution: Check the target row and column, then adjust the column width and row height. For more precise placement, set the checkbox Left, Top, Width, and Height.
Why does the checkbox still show the default caption Check Box 1
Cause: A new checkbox carries a default caption, and that name stays until Text is set.
Solution: Set checkbox.Text immediately after adding the checkbox, for example Completed or the task name for that row.
Why is the checkbox size unsuitable or the caption cut off
Cause: The height and width passed when adding the checkbox are measured in pixels. If they are too small, a longer caption is clipped; a small row height or column width can also cut off the control.
Solution: Increase the width and height passed to AddCheckBox according to the caption length, and enlarge the column width and row height as needed.
Get a Free License
Spire.XLS for JavaScript offers a 30-day full-featured free trial license with no functional limitations. Apply here to evaluate before purchasing.
How to Configure the Spire.OfficeJS Editor Service
After deploying Spire.OfficeJS, the editor service reads its runtime settings from default.json. In real deployments, port conflicts, autosave cadence, and database connections often need to be adjusted to match the environment. This article explains how to change these common settings and how to make the changes take effect.
Editor Service Overview
OfficeServer is the Spire.OfficeJS editor service. It listens on port 8000 by default and handles resource distribution, runtime APIs, co-editing, caching, and license configuration. Co-editing, autosave, and document change synchronization all depend on it.
The deployment package provides startup scripts for different systems. Run them from the deployment package root:
- Windows: double-click
run_servers_window.bat. - Linux x64: run
./run_servers_linux_x64.sh start. - Linux ARM64: run
./run_servers_linux_arm64.sh start.
The scripts start both the example service and the editor service. The example service is for demonstration only and uses port 3000 by default. Once the editor service starts, port 8000 is listening.
Configuration File and Editor Invocation
All editor service settings are stored in default.json. The file is located in the platform-specific directory of the deployment package:
- Windows:
service/OfficeServer/window/config/default.json - Linux x64:
service/OfficeServer/linux-x64/config/default.json - Linux ARM64:
service/OfficeServer/linux-arm64/config/default.json
Before changing the configuration:
- Back up
default.jsonfirst. - The file must be strict JSON: comments are not supported, and trailing commas are not allowed.
- Restart the service for the changes to take effect.
To invoke the editor service from a page, load SpireCloudEditor.js, then set coAuthorUrl in config.editorAttrs.serverless to the editor service address. Use http://LocalExample:8000 and replace LocalExample with the actual deployment address. Then call new SpireCloudEditor.OpenApi('editor', config).
Example configuration:
var config = {
  fileAttrs: {
    fileInfo:
    { name: 'sample.docx',
      ext: 'docx',
      primary: '001'
    },
    sourceUrl: 'http://LocalExample:3000/samples/sample.docx'
  },
  user:
  { id: 'uid-1',
    name: 'Jonn',
    canSave: true
  },
  editorAttrs: {
    editorMode: 'edit',
    editorType: 'document',
    viewLanguage: 'en',
    useWebAssemblyDoc: true,
    canForcesave: true,
    serverless: {
      useServerless: true,
      baseUrl: 'http://LocalExample:3000',
      coAuthorUrl: 'http://LocalExample:8000' // OfficeServer address
    },
  }
};

new SpireCloudEditor.OpenApi('editor', config);
The effect after accessing port 8000 is shown below:

Common Settings
For most deployments, the three settings adjusted most often are the port, autosave interval, and database connection. They are described below.
Change the Editor Service Port
OfficeServer, as the editor service, listens on port 8000 by default. Pages use this port to access co-editing and other APIs. If the port is occupied or needs to be isolated from existing services, change it. After the change, update coAuthorUrl on pages that connect to the editor service; otherwise, the page cannot reach the editor service.
Example configuration (default port changed to 9000):
{
  "ServicesInformation": {
    "OfficeServer": {
      "server": {
        "port": 9000
      }
    }
  }
}
Restart the service. Once port 9000 is listening, the configuration has taken effect.
Set the Autosave Interval
In fast co-editing mode, the editor submits changes to the shared document session at a fixed interval. The interval is controlled by expire.autosave_interval and is measured in milliseconds.
| Parameter | Type | Default | Description |
|---|---|---|---|
ServicesInformation.OfficeServer.expire.autosave_interval |
integer | 600000 |
Autosave interval (ms). Default: 10 minutes. |
Common conversions:
| Interval | Value |
|---|---|
| 1 second | 1000 |
| 1 minute | 60000 |
| 5 minutes | 300000 |
| 10 minutes | 600000 |
| 15 minutes | 900000 |
For example, to change the interval to 5 seconds:
{
  "ServicesInformation": {
    "OfficeServer": {
      "expire": {
        "autosave_interval": 5000
      }
    }
  }
}
Note
autosave_interval cannot be less than 0. A value below 0 is invalid, and the server uses the default value instead.
Configure the Database Connection
OfficeServer uses SQLite by default, storing task results and document changes in local files. This is suitable for single-server and small-scale deployments. For centralized data management, data sharing across instances, or higher concurrency, switch to an external database such as MySQL.
To switch, remove the existing sqlite3 object under OfficeServer and configure the sql object with the actual connection details.
| Parameter | Type | Default | Description |
|---|---|---|---|
OfficeServer.sql.type |
string | "mysql" |
Database type. |
OfficeServer.sql.dbHost |
string | "127.0.0.1" |
Database host address. |
OfficeServer.sql.dbPort |
integer | 3306 |
Database port. |
OfficeServer.sql.dbUser |
string | "root" |
Database user name. |
OfficeServer.sql.dbPass |
string | "" |
Database password. |
OfficeServer.sql.dbName |
string | "officecloud" |
Database name. |
OfficeServer.sql.charset |
string | "utf8" |
Database character set. |
OfficeServer.sql.connectionlimit |
integer | 10 |
Maximum number of connections in the pool. |
OfficeServer.sql.tableChanges |
string | "doc_changes" |
Document changes table name. |
OfficeServer.sql.tableResult |
string | "task_result" |
Task results table name. |
Example:
{
  "ServicesInformation": {
    "OfficeServer": {
      "sql": {
        "type": "mysql",
        "dbHost": "127.0.0.1",
        "dbPort": 3306,
        "dbUser": "root",
        "dbPass": "your-password",
        "dbName": "officecloud",
        "charset": "utf8",
        "connectionlimit": 10,
        "tableChanges": "doc_changes",
        "tableResult": "task_result"
      }
    }
  }
}
Note
Before switching, make sure the database and tables have been created, and make sure the table names match the configuration. Keep only one of sqlite3 and sql; when using sql, remove sqlite3. Restart OfficeServer after the change.
FAQ
Documents fail to open after changing the port
Cause: Only the editor service port was changed. coAuthorUrl in the example service or the business page was not updated, so the page still connects to the old port.
Solution: Update customization.serverless.coAuthorUrl for the example service, or editorAttrs.serverless.coAuthorUrl for a business page, to the new port. Then restart the example service and reopen the page. If the page is not accessed from the server itself, also make sure the address uses the server's IP or domain name.
Configuration in default.json does not take effect
Cause: OfficeServer, the editor service, reads its configuration only at startup, so changes do not apply until the service is restarted. The JSON may also be malformed.
Solution: Make sure you edited service/OfficeServer/<platform>/config/default.json, validate the JSON, restart OfficeServer, and reopen the document to verify.
The autosave interval is not applied
Cause: autosave_interval is sent to the editor when a document is opened. Documents that are already open do not use the new value immediately, and the server does not send the interval when co-editing is not active.
Solution: Make sure you changed the server-side configuration and used milliseconds as the unit. Restart OfficeServer, reopen the document, and confirm that co-editing is in fast mode.
Split PowerPoint Slides with JavaScript in React
Once a presentation is finished, the way its pages are organized often changes with the situation: when sending materials out, each slide may need to stand alone; when preparing an excerpt, only a few consecutive pages are needed. Saving extra copies and copying slides by hand takes time and can easily lose charts, speaker notes, or layout details. Handling it on a server means the file must first be uploaded to a third-party environment.
This article uses Spire.Presentation for JavaScript to split PowerPoint slides in the browser. The whole process runs locally on the user's device through WebAssembly, requires no Office installation and no back-end service, and keeps the presentation from leaving the browser.
This article covers two core features:
For installation and project configuration, see Integrating Spire.Presentation for JavaScript in a React Project. The examples below assume that Spire.Presentation is installed and the WebAssembly module has been initialized.
Split a PowerPoint presentation into single slides
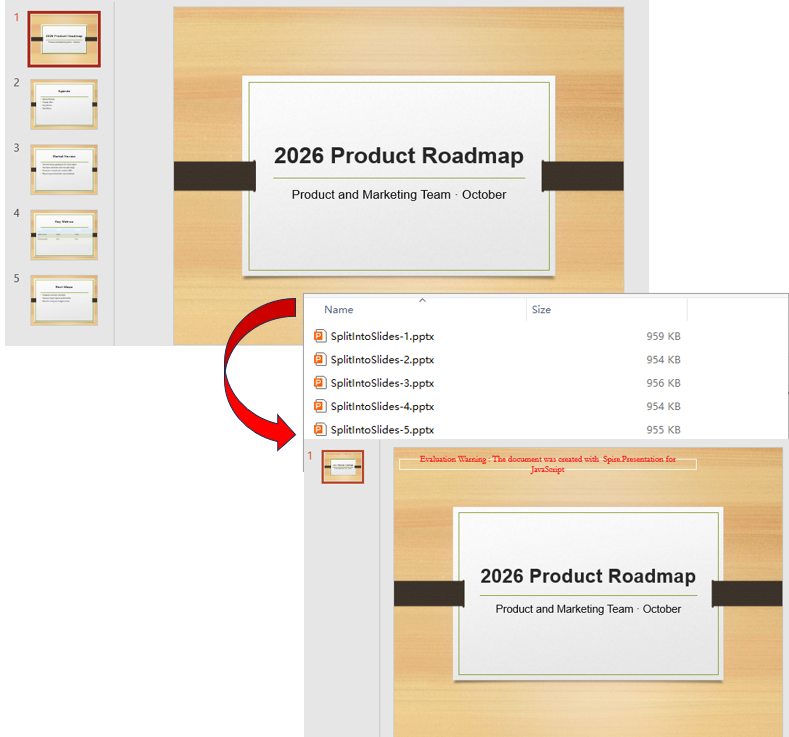
When distributing materials, each slide sometimes needs to stand alone so it can be sent, annotated, or used as image material separately. Splitting a presentation into multiple files means copying the content page by page and creating an independent presentation instance for each slide.
| Code | Result |
|---|---|
new pptModule.Presentation() |
Creates a presentation instance with one blank slide by default |
sourcePpt.Slides.Count |
Total number of slides in the source presentation |
sourcePpt.Slides.get_Item(i) |
The (i+1)-th slide (index starts at 0) |
singlePpt.Slides.RemoveAt(0) |
Removes the blank slide created with the new presentation |
singlePpt.Slides.Append({ slide }) |
Copies the given slide to the end of the current presentation |
singlePpt.SaveToFile({ file, fileFormat }) |
Writes a standalone PPTX file in the specified format |
The steps are:
- Load the font file and the sample presentation
Presentation.pptxinto the VFS withwindow.spire.FetchFileToVFS, then create an instance withnew pptModule.Presentation()and load the source file withLoadFromFile. - Read
sourcePpt.Slides.Countas the loop count and visit each source slide withsourcePpt.Slides.get_Item(i). - In each iteration, create a new
Presentation, callSlides.RemoveAt(0)to remove the default blank page, and copy the current slide withSlides.Append({ slide }). - Save the new presentation as
SplitSlide-<index>.pptxwithSaveToFile, then release the instance withDispose(). - Read every output file through
window.dotnetRuntime.Module.FS.readFile, build aBlob, and trigger the browser download.
function App() {
  const splitIntoSlides = async () => {
    // Get the Spire.Presentation WASM module
    const pptModule = window.wasmModule?.spirepresentation;

    // Check if the module is ready
    if (!pptModule) {
      alert('Spire.Presentation is not ready yet');
      return;
    }

    // Load the font and the sample presentation into the VFS
    await window.spire.FetchFileToVFS('ARIAL.TTF', '/Library/Fonts/', `${process.env.PUBLIC_URL}/font/`);
    const inputFileName = 'Presentation.pptx';
    await window.spire.FetchFileToVFS(inputFileName, '', `${process.env.PUBLIC_URL}data/`);

    // Load the source presentation
    const sourcePpt = new pptModule.Presentation();
    sourcePpt.LoadFromFile(inputFileName);

    const splitFiles = [];

    // Split the slides one by one
    for (let i = 0; i < sourcePpt.Slides.Count; i++) {
      // Create a new presentation and remove its built-in blank slide
      const singlePpt = new pptModule.Presentation();
      singlePpt.Slides.RemoveAt(0);

      // Copy the i-th slide of the source presentation into the new one
      singlePpt.Slides.Append({ slide: sourcePpt.Slides.get_Item(i) });

      // Save it as a standalone PPTX file
      const outputFileName = `SplitSlide-${i + 1}.pptx`;
      singlePpt.SaveToFile({ file: outputFileName, fileFormat: pptModule.FileFormat.Pptx2013 });
      splitFiles.push(outputFileName);

      singlePpt.Dispose();
    }

    sourcePpt.Dispose();

    // Read the split results from the VFS and trigger the downloads
    for (const fileName of splitFiles) {
      const fileArray = window.dotnetRuntime.Module.FS.readFile(fileName);
      const blob = new Blob([fileArray], { type: 'application/vnd.openxmlformats-officedocument.presentationml.presentation' });
      const url = URL.createObjectURL(blob);
      const a = document.createElement('a');
      a.href = url;
      a.download = fileName;
      a.click();
      URL.revokeObjectURL(url);
    }
  };

  return (
    <div style={{ textAlign: 'center', height: '300px' }}>
      <h1>Split PowerPoint Slides</h1>
      <button onClick={splitIntoSlides}>
        Split into Single Slides
      </button>
    </div>
  );
}

export default App;
Presentation files after splitting into single slides:
Split PowerPoint slides by page range
Not every split needs one file per page. A report often only needs one section extracted, for example saving slides 2 to 4 as a separate brief. There is no need to copy the whole presentation and delete pages; determine the start and end indexes and append only the slides inside that range to a new presentation.
The steps are:
- Load the font and
Presentation.pptxwithwindow.spire.FetchFileToVFS, then create aPresentationinstance and load the file withLoadFromFile. - Create a new presentation with
new pptModule.Presentation()and remove the default blank page withSlides.RemoveAt(0). - Set
startIndexandendIndex(indexes start at 0 and the range includes both ends), take each slide withSlides.get_Item(i)in a loop, and append it withSlides.Append({ slide }). - Save the result as
SplitRange.pptxwithSaveToFile, and release both presentation instances withDispose(). - Read the file through
window.dotnetRuntime.Module.FS.readFile, build aBlob, and trigger the download.
function App() {
  const splitByRange = async () => {
    // Get the Spire.Presentation WASM module
    const pptModule = window.wasmModule?.spirepresentation;

    // Check if the module is ready
    if (!pptModule) {
      alert('Spire.Presentation is not ready yet');
      return;
    }

    // Load the font and the sample presentation into the VFS
    await window.spire.FetchFileToVFS('ARIAL.TTF', '/Library/Fonts/', `${process.env.PUBLIC_URL}/font/`);
    const inputFileName = 'Presentation.pptx';
    await window.spire.FetchFileToVFS(inputFileName, '', `${process.env.PUBLIC_URL}data/`);

    // Load the source presentation
    const sourcePpt = new pptModule.Presentation();
    sourcePpt.LoadFromFile(inputFileName);

    // Keep slides 2 to 4 (indexes start from 0)
    const startIndex = 1;
    const endIndex = 3;

    // Create a new presentation and remove its built-in blank slide
    const rangePpt = new pptModule.Presentation();
    rangePpt.Slides.RemoveAt(0);

    // Copy the slides inside the range one by one
    for (let i = startIndex; i <= endIndex; i++) {
      rangePpt.Slides.Append({ slide: sourcePpt.Slides.get_Item(i) });
    }

    const outputFileName = 'SplitRange.pptx';
    rangePpt.SaveToFile({ file: outputFileName, fileFormat: pptModule.FileFormat.Pptx2013 });

    // Release resources
    rangePpt.Dispose();
    sourcePpt.Dispose();

    // Read the result file from the VFS and trigger the download
    const fileArray = window.dotnetRuntime.Module.FS.readFile(outputFileName);
    const blob = new Blob([fileArray], { type: 'application/vnd.openxmlformats-officedocument.presentationml.presentation' });
    const url = URL.createObjectURL(blob);
    const a = document.createElement('a');
    a.href = url;
    a.download = outputFileName;
    a.click();
    URL.revokeObjectURL(url);
  };

  return (
    <div style={{ textAlign: 'center', height: '300px' }}>
      <h1>Split PowerPoint Slides by Page Range</h1>
      <button onClick={splitByRange}>
        Split by Page Range
      </button>
    </div>
  );
}

export default App;
Presentation after splitting slides by page range:

FAQ
Why does a split result contain an extra blank slide
Cause: The presentation created by new pptModule.Presentation() contains one blank slide by default. If the source slides are appended directly, that blank page stays at the beginning of the result.
Solution: Call Slides.RemoveAt(0) before appending slides to remove the default page, for example:
const singlePpt = new pptModule.Presentation();
singlePpt.Slides.RemoveAt(0);
singlePpt.Slides.Append({ slide: sourcePpt.Slides.get_Item(i) });
Why does an index return the wrong slide
Cause: The index of Slides.get_Item(index) starts at 0, so the first slide corresponds to index 0. Using a page number directly shifts the selection by one.
Solution: Use zero-based indexes consistently. To take slides 2 to 4, set startIndex to 1 and endIndex to 3.
Why is the last slide missing after splitting by page range
Cause: If the loop condition is written as i < endIndex, the slide at endIndex is never visited; the index range includes both ends.
Solution: Use i <= endIndex as the loop condition and make sure endIndex does not exceed sourcePpt.Slides.Count - 1.
Get a Free License
Spire.Presentation for JavaScript offers a 30-day full-featured free trial license with no functional limitations. Apply here to evaluate before purchasing.
Merge PowerPoint Slides with JavaScript in React
Combining several presentations into one is a common step when organizing report materials: a main report and a topic appendix may be prepared by different team members, and finally need to sit in one file in a consistent order; sometimes only a few conclusion pages from the appendix are needed. Copying and pasting by hand takes time and may break the layout, charts, or text styles of the original slides. Handling it on a server also requires uploading the files to a third-party environment first.
This article uses Spire.Presentation for JavaScript to merge PowerPoint slides in the browser. The whole process runs locally on the user's device through WebAssembly, requires no Office installation and no back-end service, and keeps the presentation from leaving the browser.
This article covers two core features:
For installation and project configuration, see Integrating Spire.Presentation for JavaScript in a React Project. The examples below assume that Spire.Presentation is installed and the WebAssembly module has been initialized.
Merge multiple PowerPoint presentations
A complete report often consists of materials from several sources, for example a main report and a topic appendix prepared by different members that finally need to be combined into one file. To merge multiple presentations, load each source file in turn, then append all of its slides to one new presentation to obtain a merged result that contains every page.
| Code | Result |
|---|---|
new pptModule.Presentation() |
Creates a presentation instance with one blank slide by default |
mergedPpt.Slides.RemoveAt(0) |
Removes the blank slide created with the new presentation |
sourcePpt.Slides.Count |
Total number of slides in the current source presentation |
sourcePpt.Slides.get_Item(i) |
The (i+1)-th slide (index starts at 0) |
mergedPpt.Slides.Append({ slide }) |
Appends the source slide to the end of the merged result |
mergedPpt.SaveToFile({ file, fileFormat }) |
Writes the merged PPTX file in the specified format |
The steps are:
- Load
Presentation.pptxandSlidesToMerge.pptxinto the VFS withwindow.spire.FetchFileToVFS. - Create a new presentation with
new pptModule.Presentation()and remove the default blank page withSlides.RemoveAt(0). - For each source file, create a
Presentationinstance and load it withLoadFromFile, loop overSlides.Count, take each slide withSlides.get_Item(i), and append it to the merged result withSlides.Append({ slide }). - Release each source instance with
Dispose()when it has been processed; after all slides are appended, save the result asMergedPresentation.pptxwithSaveToFile. - Read the merged result through
window.dotnetRuntime.Module.FS.readFile, build aBlob, and trigger the browser download.
function App() {
  const mergePresentations = async () => {
    // Get the Spire.Presentation WASM module
    const pptModule = window.wasmModule?.spirepresentation;

    // Check if the module is ready
    if (!pptModule) {
      alert('Spire.Presentation is not ready yet');
      return;
    }

    // Load the font and the two sample presentations into the VFS
    await window.spire.FetchFileToVFS('ARIAL.TTF', '/Library/Fonts/', `${process.env.PUBLIC_URL}/font/`);
    const sourceFileNames = ['Presentation.pptx', 'SlidesToMerge.pptx'];
    for (const fileName of sourceFileNames) {
      await window.spire.FetchFileToVFS(fileName, '', `${process.env.PUBLIC_URL}data/`);
    }

    // Create a new presentation and remove its built-in blank slide
    const mergedPpt = new pptModule.Presentation();
    mergedPpt.Slides.RemoveAt(0);

    // Append all slides of every source presentation to the merged result
    for (const fileName of sourceFileNames) {
      const sourcePpt = new pptModule.Presentation();
      sourcePpt.LoadFromFile(fileName);

      for (let i = 0; i < sourcePpt.Slides.Count; i++) {
        mergedPpt.Slides.Append({ slide: sourcePpt.Slides.get_Item(i) });
      }

      sourcePpt.Dispose();
    }

    const outputFileName = 'MergedPresentation.pptx';
    mergedPpt.SaveToFile({ file: outputFileName, fileFormat: pptModule.FileFormat.Pptx2013 });
    mergedPpt.Dispose();

    // Read the result file from the VFS and trigger the download
    const fileArray = window.dotnetRuntime.Module.FS.readFile(outputFileName);
    const blob = new Blob([fileArray], { type: 'application/vnd.openxmlformats-officedocument.presentationml.presentation' });
    const url = URL.createObjectURL(blob);
    const a = document.createElement('a');
    a.href = url;
    a.download = outputFileName;
    a.click();
    URL.revokeObjectURL(url);
  };

  return (
    <div style={{ textAlign: 'center', height: '300px' }}>
      <h1>Merge PowerPoint Presentations</h1>
      <button onClick={mergePresentations}>
        Merge Multiple Presentations
      </button>
    </div>
  );
}

export default App;
Presentation after merging multiple presentations:
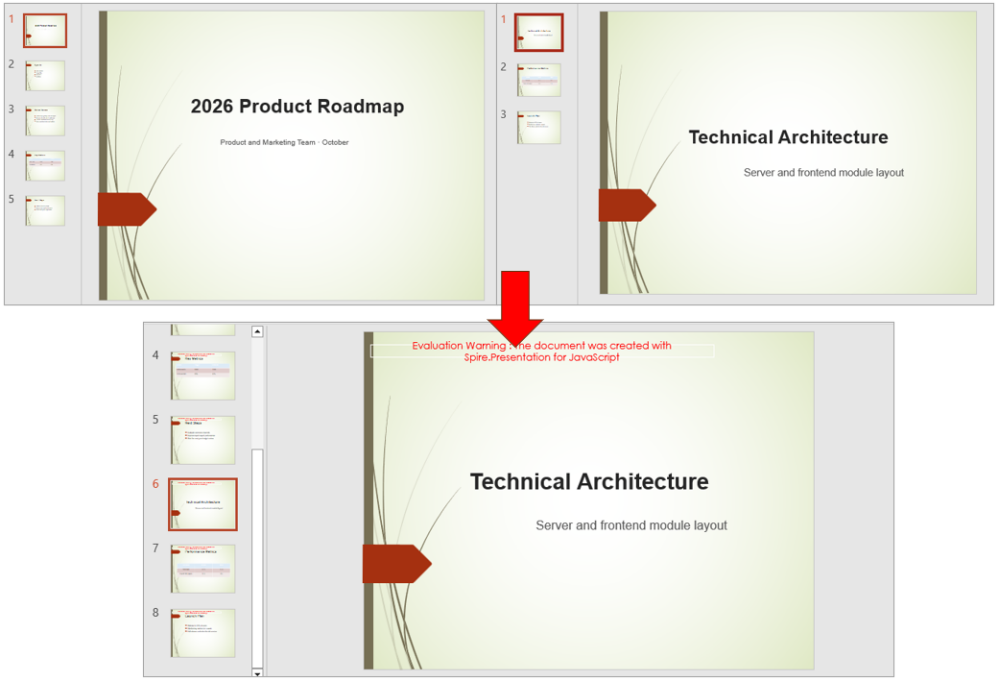
Merge selected PowerPoint slides
A merge does not always need every page of a source file. For example, the main report keeps its full structure, while only the two conclusion pages of the topic appendix are required. In this case, merge all slides of the main report first, then pick pages from the other presentation by index, so unrelated content is not carried over.
| Code | Result |
|---|---|
mergedPpt.Slides.Append({ slide }) |
Appends one slide to the end of the merged result |
mainPpt.Slides.Count |
Total number of slides in the main report |
mainPpt.Slides.get_Item(i) |
The (i+1)-th slide of the main report (index starts at 0) |
extraPpt.Slides.get_Item(index) |
The slide at the given index in the appendix |
selectedIndexes |
Indexes of the appendix slides that take part in the merge |
The steps are:
- Load the font,
Presentation.pptx, andSlidesToMerge.pptxwithwindow.spire.FetchFileToVFS. - Create two
Presentationinstances and load both source files withLoadFromFile; create the merged result withnew pptModule.Presentation()and remove the default blank page withSlides.RemoveAt(0). - Loop over
mainPpt.Slides.Countand append every slide of the main report withSlides.get_Item(i)andSlides.Append({ slide }). - Set
selectedIndexes(indexes start at 0) and append only those slides withextraPpt.Slides.get_Item(index); all other slides do not take part in the merge. - Save the result as
MergedSelectedSlides.pptxwithSaveToFile, then read the file throughwindow.dotnetRuntime.Module.FS.readFileand trigger the download.
function App() {
  const mergeSelectedSlides = async () => {
    // Get the Spire.Presentation WASM module
    const pptModule = window.wasmModule?.spirepresentation;

    // Check if the module is ready
    if (!pptModule) {
      alert('Spire.Presentation is not ready yet');
      return;
    }

    // Load the font and the two sample presentations into the VFS
    await window.spire.FetchFileToVFS('ARIAL.TTF', '/Library/Fonts/', `${process.env.PUBLIC_URL}/font/`);
    for (const fileName of ['Presentation.pptx', 'SlidesToMerge.pptx']) {
      await window.spire.FetchFileToVFS(fileName, '', `${process.env.PUBLIC_URL}data/`);
    }

    // Load the main report and the appendix
    const mainPpt = new pptModule.Presentation();
    mainPpt.LoadFromFile('Presentation.pptx');

    const extraPpt = new pptModule.Presentation();
    extraPpt.LoadFromFile('SlidesToMerge.pptx');

    // Create a new presentation and remove its built-in blank slide
    const mergedPpt = new pptModule.Presentation();
    mergedPpt.Slides.RemoveAt(0);

    // Append all slides of the main report
    for (let i = 0; i < mainPpt.Slides.Count; i++) {
      mergedPpt.Slides.Append({ slide: mainPpt.Slides.get_Item(i) });
    }

    // Append only the selected slides of the appendix (indexes start from 0)
    const selectedIndexes = [1, 2];
    for (const index of selectedIndexes) {
      mergedPpt.Slides.Append({ slide: extraPpt.Slides.get_Item(index) });
    }

    const outputFileName = 'MergedSelectedSlides.pptx';
    mergedPpt.SaveToFile({ file: outputFileName, fileFormat: pptModule.FileFormat.Pptx2013 });

    // Release resources
    mergedPpt.Dispose();
    mainPpt.Dispose();
    extraPpt.Dispose();

    // Read the result file from the VFS and trigger the download
    const fileArray = window.dotnetRuntime.Module.FS.readFile(outputFileName);
    const blob = new Blob([fileArray], { type: 'application/vnd.openxmlformats-officedocument.presentationml.presentation' });
    const url = URL.createObjectURL(blob);
    const a = document.createElement('a');
    a.href = url;
    a.download = outputFileName;
    a.click();
    URL.revokeObjectURL(url);
  };

  return (
    <div style={{ textAlign: 'center', height: '300px' }}>
      <h1>Merge Selected PowerPoint Slides</h1>
      <button onClick={mergeSelectedSlides}>
        Merge Selected Slides
      </button>
    </div>
  );
}

export default App;
Presentation after merging selected slides:
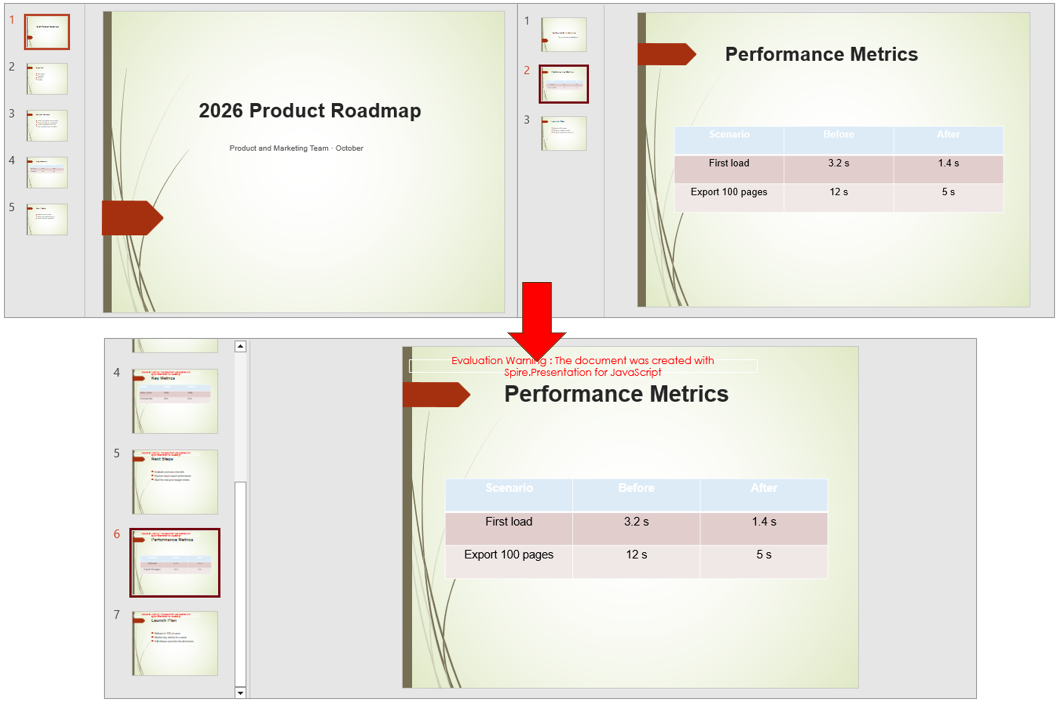
FAQ
Why is the slide order in the merged result different from the expected order
Cause: The append order follows the loop order, so files processed first come first. If the file list or loop order differs from the expected order, the page order in the result changes as well.
Solution: Arrange sourceFileNames in the required order and keep the Append loop running from the first slide to the last; the merged result then follows that order.
Why does the merged result contain an extra blank slide
Cause: The presentation created by new pptModule.Presentation() contains one blank slide by default. If the source slides are appended directly, that blank page stays at the beginning of the merged result.
Solution: Call Slides.RemoveAt(0) before the first append to remove the default page, for example:
const mergedPpt = new pptModule.Presentation();
mergedPpt.Slides.RemoveAt(0);
Are images, tables, and hyperlinks lost after merging
Cause: Slides.Append({ slide }) copies the whole slide, and images, tables, and hyperlinks are content of the slide itself, so they enter the merged result together with the slide.
Solution: No extra handling is needed. After merging, check the images and tables directly in the result file; if a hyperlink points to an external address, make sure that address is still reachable.
Get a Free License
Spire.Presentation for JavaScript offers a 30-day full-featured free trial license with no functional limitations. Apply here to evaluate before purchasing.
How to Destroy the Spire.OfficeJS Editor
On a business page, users open the editor to edit a document and then need to close it. Many pages simply remove the editor from the page when the user closes it. The editor is no longer visible, but some of its listeners are still running in the background. If the editor is opened and closed repeatedly, the old listeners may still respond to operations on the new document, and the page becomes slower. When the editor is no longer needed, clean it up with destroyEditor(). This article uses Word as an example to explain how to destroy a Spire.OfficeJS editor.
Destroy process
Destroying the editor can be summarized in three steps: open the editor, call destroyEditor(), and restore the page to its original state.
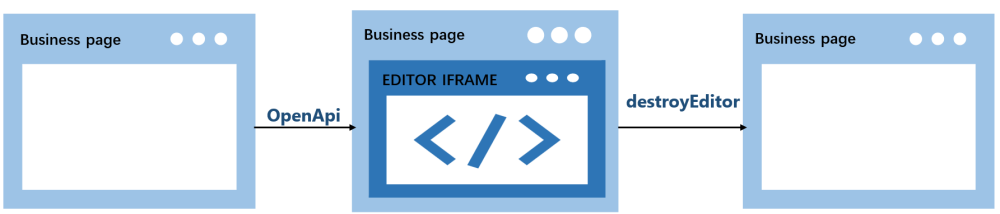
- The user opens the editor.
OpenApicreates the editor on the business page, and the original placeholder<div>is replaced. - Call
destroyEditor()to remove the editor. It unbinds themessagelistener and themouseuplistener on the business page, then replaces the editor iframe with the original placeholder<div>. - The page returns to its state before opening, and the placeholder
<div>appears again.
How to call it
destroyEditor() is not a global method, nor is it on the editor iframe element. It is a method on the object returned by new SpireCloudEditor.OpenApi(). Save the returned object when you create the editor, and call the method on that object when you destroy the editor.
Example code:
var editor = new SpireCloudEditor.OpenApi('editor', config);

editor.destroyEditor();
editor = null;
Note
Call destroyEditor() only once per editor instance; calling it again on the same instance throws an error. After a successful destroy, set editor to null to avoid using the stale object. To open the editor again, create a new instance.
Complete example
Below is a complete example: the page creates the editor and saves the returned object when the page loads, then calls destroyEditor() when the user clicks the "Destroy Editor" button. Replace LocalExample:3000 with the actual deployment address before running.
<!DOCTYPE html>
<html lang="en">
<head>
  <meta charset="UTF-8">
  <title>Spire.OfficeJS Destroy Editor</title>
  <style>
    html, body { height: 100%; margin: 0; background-color: #cbe4f3;}
    body { display: flex; flex-direction: column; }
    #editor { flex: 1; min-height: 0; }
    #editor iframe { width: 100%; height: 100%; border: 0; }
  </style>
</head>
<body>
  <button id="destroyBtn">Destroy Editor</button>
  <div id="editor"></div>
  <script src="http://LocalExample:3000/web/editors/spireapi/SpireCloudEditor.js"></script>
  <script>
    var SERVER = 'http://LocalExample:3000';

    var config = {
      fileAttrs: {
        fileInfo: { name: 'sample.docx', ext: 'docx' },
        sourceUrl: SERVER + '/samples/sample.docx'
      },
      user: { id: 'uid-1', name: 'Jonn' },
      editorAttrs: {
        editorMode: 'edit',
        editorType: 'document',
        viewLanguage: 'en',
        useWebAssemblyDoc: true,
        spireOfficeJsLicense: '',
        serverless: {
          useServerless: true,
          baseUrl: SERVER
        }
      }
    };

    var editor = new SpireCloudEditor.OpenApi('editor', config);

    document.getElementById('destroyBtn').addEventListener('click', function () {
      editor.destroyEditor();
      editor = null;
    });
  </script>
</body>
</html>
After you open the document and click the "Destroy Editor" button, the editor is destroyed:
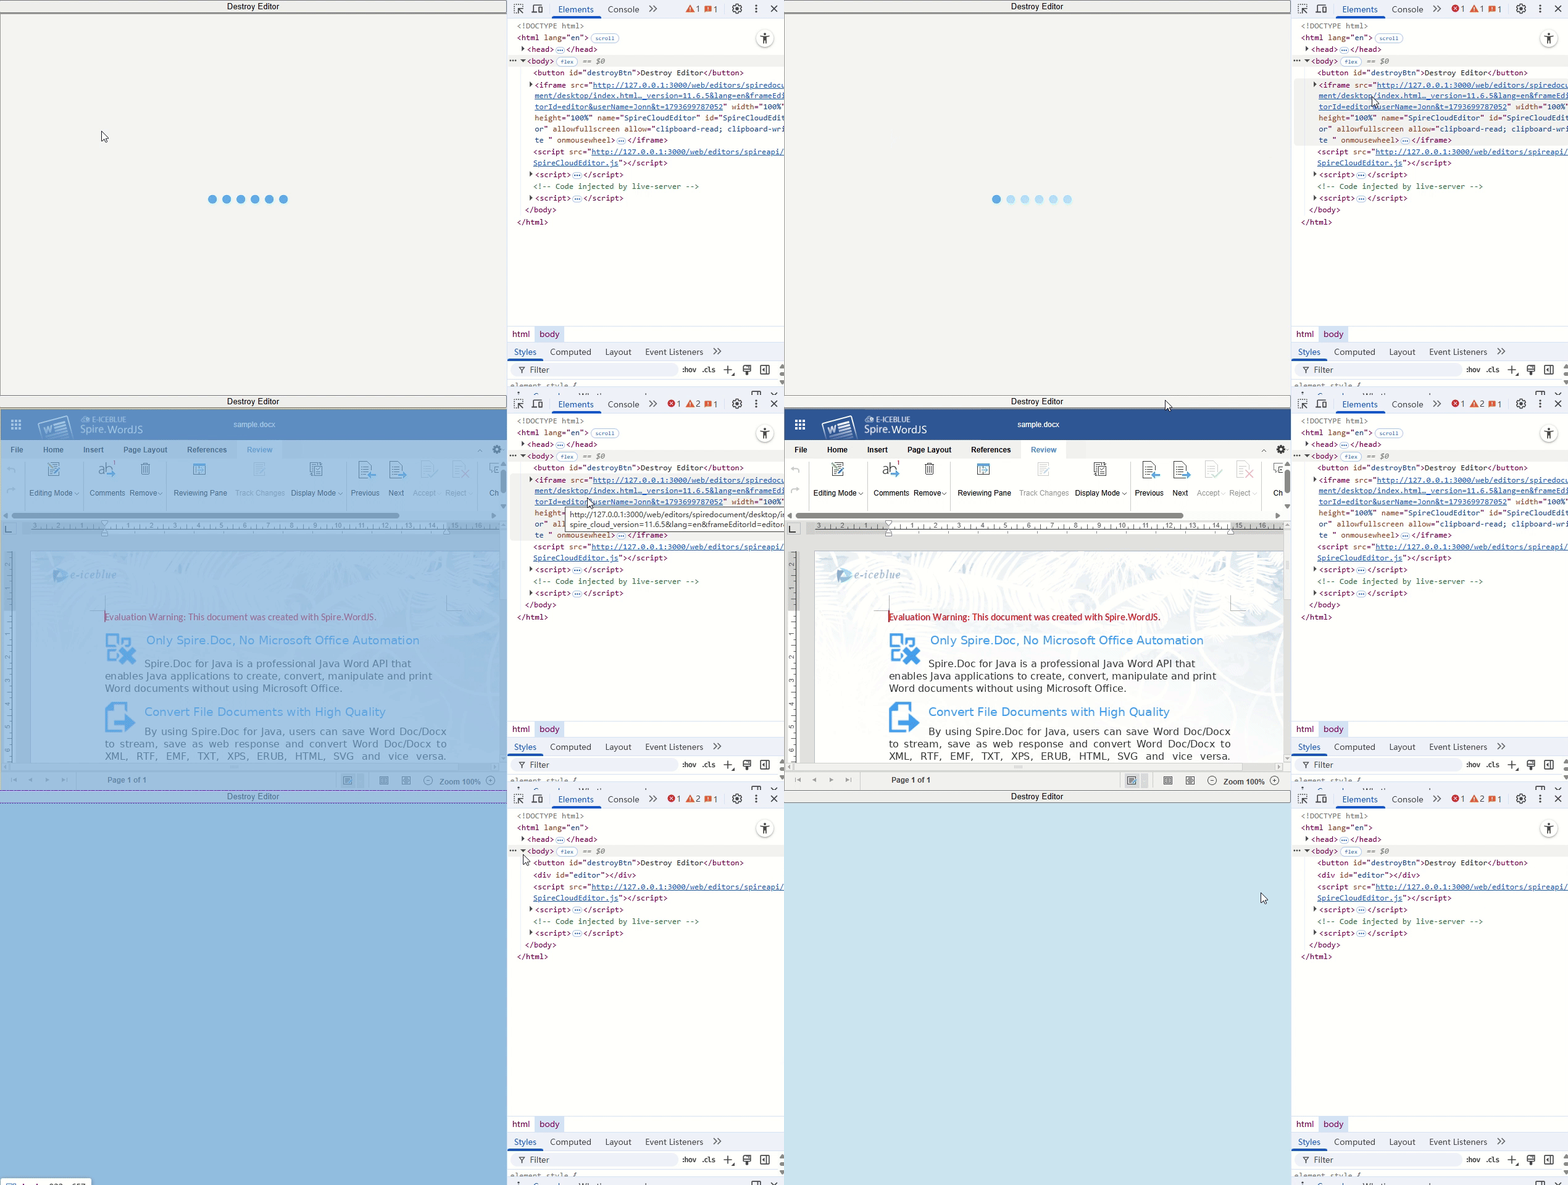
Note
destroyEditor() does not save the document and does not cancel save or download requests that have already been sent. If you need to keep changes, save first and wait for the save to complete before destroying the editor.
FAQ
The container style changes after destroying the editor
Cause: The placeholder <div> restored by destroyEditor() has only its id set; its original class and inline style are not restored.
Solution: Put the container's size and styles in an ID selector, for example #editor { flex: 1; min-height: 0; }.
Can I still use methods such as downloadAs after calling destroyEditor()?
Cause: destroyEditor() unbinds the listeners on the business page, so the returned object no longer receives responses from the editor.
Solution: Do not use other methods on the returned object after calling destroyEditor().
Does destroyEditor() clear localStorage or the server-side cache?
Cause: destroyEditor() only performs cleanup on the business page; it does not clear browser storage or the server-side cache.
Solution: If cleanup is needed, handle it separately in the business system.
Set Number Format in Excel with JavaScript in React
Numbers stored in Excel cells often need to be displayed in different formats, such as keeping two decimal places, adding thousands separators, displaying amounts as currency, highlighting negative numbers in red, or showing them as percentages or in scientific notation. Proper number formatting not only makes reports easier to read but also avoids errors caused by manual entry and layout. Spire.XLS for JavaScript completes this directly in the browser based on WebAssembly, and manages input/output files through a virtual file system (VFS), with no backend service required.
Spire.XLS for JavaScript sets number formats through the NumberFormat property of the cell range Range. NumberFormat accepts Excel-standard format code strings. The table below lists the commonly used format code symbols and their meanings:
| Symbol | Description |
|---|---|
0 |
Digit placeholder that always displays a digit, padding with 0 when there are not enough digits |
# |
Digit placeholder that shows only significant digits; extra zeros are not displayed |
? |
Digit placeholder that leaves space for insignificant zeros, used to align decimal points |
. |
Decimal point |
, |
Thousands separator |
% |
Multiplies the number by 100 and displays it as a percentage |
E+ / E- |
Exponent part of scientific notation |
; |
Separates the formats for positive numbers, negative numbers, zeros and text |
[Red] and other color codes |
Sets the display color of the number, e.g. [Red], [Blue], [Green] |
[DBNum1] / [DBNum2] |
Converts numbers to Chinese lowercase / uppercase numerals |
@ |
Text placeholder that displays the number as text |
This article covers three core features:
- Set Decimal Places and Thousands Separator
- Set Currency Format and Highlight Negative Values
- Set Percentage, Scientific Notation and Other Formats
For installation and project configuration, refer to Integrating Spire.XLS for JavaScript in a React Project. The examples below assume Spire.XLS is installed and the WebAssembly module is initialized.
Set Decimal Places and Thousands Separator
When processing amounts, statistics and other data, it is often necessary to keep numbers to a specified number of decimal places, or to add thousands separators for readability. Presenting the same values with the right format codes makes reports easier to scan and avoids manual padding or misplaced commas.
The steps are:
- Load the font file into the VFS for text measurement.
- Create a
Workbookobject and get the first worksheet withWorkbook.Worksheets.get(0). - Use the
Range.Textproperty to write the title, column headers, and the format codes used as description text. - Use the
Range.NumberValueproperty to write the values, and set the corresponding format codes with theRange.NumberFormatproperty. - Use the
Workbook.SaveToFile()method to save the workbook, then release resources withWorkbook.Dispose().
Here is a complete code example showing how to set number formats with different decimal places and thousands separators for cells in React:
function App() {
  const setDecimalPlacesAndThousands = async () => {
    // Get the Spire.XLS WASM module
    const xlsModule = window.wasmModule?.spirexls;

    // Check whether the module is ready
    if (!xlsModule) {
      alert('Spire.Xls is not ready yet');
      return;
    }

    // Load the font into the VFS for text measurement
    await window.spire.FetchFileToVFS('ARIAL.TTF', '/Library/Fonts/', `${process.env.PUBLIC_URL}/font/`);

    // Create a new workbook and get the first worksheet
    const workbook = new xlsModule.Workbook();
    const sheet = workbook.Worksheets.get(0);

    // Write the title and column headers
    sheet.Range.get("B1").Text = "Number Formatting Sample";
    sheet.Range.get("B3").Text = "Format Code";
    sheet.Range.get("C3").Text = "Result";

    // Write the format code in column B, write the value in column C and apply the corresponding number format
    sheet.Range.get("B4").Text = "0";
    sheet.Range.get("C4").NumberValue = 1234.5678;
    sheet.Range.get("C4").NumberFormat = "0";

    sheet.Range.get("B5").Text = "0.00";
    sheet.Range.get("C5").NumberValue = 1234.5678;
    sheet.Range.get("C5").NumberFormat = "0.00";

    sheet.Range.get("B6").Text = "#,##0.00";
    sheet.Range.get("C6").NumberValue = 1234.5678;
    sheet.Range.get("C6").NumberFormat = "#,##0.00";

    // Add a background color to the format-code cells and set the column widths
    sheet.Range.get("B4:B6").Style.KnownColor = xlsModule.ExcelColors.Gray25Percent;
    sheet.SetColumnWidth(2, 26);
    sheet.SetColumnWidth(3, 20);

    // Save the document
    const outputFileName = 'NumberFormat_Decimals_output.xlsx';
    workbook.SaveToFile({ fileName: outputFileName, version: xlsModule.ExcelVersion.Version2010 });

    // Release resources
    workbook.Dispose();

    // Read the converted file from the VFS and trigger a download
    const fileArray = window.dotnetRuntime.Module.FS.readFile(outputFileName);
    const blob = new Blob([fileArray], { type: 'application/vnd.openxmlformats-officedocument.spreadsheetml.sheet' });
    const url = URL.createObjectURL(blob);
    const a = document.createElement('a');
    a.href = url;
    a.download = outputFileName;
    a.click();
    URL.revokeObjectURL(url);
  };

  return (
    <div style={{ textAlign: 'center', height: '300px' }}>
      <h1>Set Decimal Places and Thousands Separator</h1>
      <button onClick={setDecimalPlacesAndThousands}>
        Start
      </button>
    </div>
  );
}

export default App;
The worksheet after setting decimal places and thousands separator:
Set Currency Format and Highlight Negative Values
In financial reports, amounts are usually displayed in currency format, while negative numbers need to be highlighted so they can be spotted quickly. An Excel number format code can consist of several parts separated by semicolons, so positive and negative values in the same column can be displayed differently, and negative values can be colored on their own.
The steps are:
- Load the font file into the VFS for text measurement.
- Create a
Workbookobject and get the first worksheet withWorkbook.Worksheets.get(0). - Use the
Range.Textproperty to write the title, column headers, and the currency format codes used as description text. - Use the
Range.NumberValueproperty to write the values (including negative numbers), and set the format codes that contain a negative part with theRange.NumberFormatproperty. - Use the
Workbook.SaveToFile()method to save the workbook, then release resources withWorkbook.Dispose().
Here is a complete code example showing how to set a currency format for amounts in React and display negative numbers in red:
function App() {
  const setCurrencyFormat = async () => {
    // Get the Spire.XLS WASM module
    const xlsModule = window.wasmModule?.spirexls;

    // Check whether the module is ready
    if (!xlsModule) {
      alert('Spire.Xls is not ready yet');
      return;
    }

    // Load the font into the VFS for text measurement
    await window.spire.FetchFileToVFS('ARIAL.TTF', '/Library/Fonts/', `${process.env.PUBLIC_URL}/font/`);

    // Create a new workbook and get the first worksheet
    const workbook = new xlsModule.Workbook();
    const sheet = workbook.Worksheets.get(0);

    // Write the title and column headers
    sheet.Range.get("B1").Text = "Number Formatting Sample";
    sheet.Range.get("B3").Text = "Format Code";
    sheet.Range.get("C3").Text = "Result";

    // Set the currency format: two decimal places with a thousands separator
    sheet.Range.get("B4").Text = "$#,##0.00";
    sheet.Range.get("C4").NumberValue = 1234.5678;
    sheet.Range.get("C4").NumberFormat = "$#,##0.00";

    // Negative numbers with a thousands separator displayed in red
    sheet.Range.get("B5").Text = "#,##0.00;[Red]-#,##0.00";
    sheet.Range.get("C5").NumberValue = -1234.5678;
    sheet.Range.get("C5").NumberFormat = "#,##0.00;[Red]-#,##0.00";

    // Negative numbers with two decimal places displayed in red
    sheet.Range.get("B6").Text = "0.00;[Red]-0.00";
    sheet.Range.get("C6").NumberValue = -1234.5678;
    sheet.Range.get("C6").NumberFormat = "0.00;[Red]-0.00";

    // Add a background color to the format-code cells and set the column widths
    sheet.Range.get("B4:B6").Style.KnownColor = xlsModule.ExcelColors.Gray25Percent;
    sheet.SetColumnWidth(2, 26);
    sheet.SetColumnWidth(3, 20);

    // Save the document
    const outputFileName = 'NumberFormat_Currency_output.xlsx';
    workbook.SaveToFile({ fileName: outputFileName, version: xlsModule.ExcelVersion.Version2010 });

    // Release resources
    workbook.Dispose();

    // Read the converted file from the VFS and trigger a download
    const fileArray = window.dotnetRuntime.Module.FS.readFile(outputFileName);
    const blob = new Blob([fileArray], { type: 'application/vnd.openxmlformats-officedocument.spreadsheetml.sheet' });
    const url = URL.createObjectURL(blob);
    const a = document.createElement('a');
    a.href = url;
    a.download = outputFileName;
    a.click();
    URL.revokeObjectURL(url);
  };

  return (
    <div style={{ textAlign: 'center', height: '300px' }}>
      <h1>Set Currency Format and Highlight Negative Values</h1>
      <button onClick={setCurrencyFormat}>
        Start
      </button>
    </div>
  );
}

export default App;
The worksheet after setting the currency format and highlighting negative values:
Set Percentage, Scientific Notation and Other Formats
Besides the common decimal, thousands separator and currency formats, reports often call for percentages, scientific notation and Chinese uppercase amounts. Percentages make proportions easier to compare, scientific notation suits very large or very small numbers, and Chinese uppercase is used on formal financial documents.
The steps are:
- Load the font file into the VFS for text measurement.
- Create a
Workbookobject and get the first worksheet withWorkbook.Worksheets.get(0). - Use the
Range.Textproperty to write the title, column headers, and the format codes used as description text. - Use the
Range.NumberValueproperty to write the values, and set the percentage, scientific notation or Chinese uppercase format codes respectively with theRange.NumberFormatproperty. - Use the
Workbook.SaveToFile()method to save the workbook, then release resources withWorkbook.Dispose().
Here is a complete code example showing how to set percentage, scientific notation and Chinese uppercase formats for cells in React:
function App() {
  const setSpecialNumberFormat = async () => {
    // Get the Spire.XLS WASM module
    const xlsModule = window.wasmModule?.spirexls;

    // Check whether the module is ready
    if (!xlsModule) {
      alert('Spire.Xls is not ready yet');
      return;
    }

    // Load the font into the VFS for text measurement
    await window.spire.FetchFileToVFS('ARIAL.TTF', '/Library/Fonts/', `${process.env.PUBLIC_URL}/font/`);

    // Create a new workbook and get the first worksheet
    const workbook = new xlsModule.Workbook();
    const sheet = workbook.Worksheets.get(0);

    // Write the title and column headers
    sheet.Range.get("B1").Text = "Number Formatting Sample";
    sheet.Range.get("B3").Text = "Format Code";
    sheet.Range.get("C3").Text = "Result";

    // Percentage format: the stored value is multiplied by 100 and a percent sign is shown
    sheet.Range.get("B4").Text = "0.00%";
    sheet.Range.get("C4").NumberValue = 0.1234;
    sheet.Range.get("C4").NumberFormat = "0.00%";

    // Scientific notation format
    sheet.Range.get("B5").Text = "0.00E+00";
    sheet.Range.get("C5").NumberValue = 123456789;
    sheet.Range.get("C5").NumberFormat = "0.00E+00";

    // Chinese uppercase format (uppercase for RMB amounts)
    sheet.Range.get("B6").Text = "[DBNum2][$-804]General";
    sheet.Range.get("C6").NumberValue = 1234567;
    sheet.Range.get("C6").NumberFormat = "[DBNum2][$-804]General";

    // Add a background color to the format-code cells and set the column widths
    sheet.Range.get("B4:B6").Style.KnownColor = xlsModule.ExcelColors.Gray25Percent;
    sheet.SetColumnWidth(2, 26);
    sheet.SetColumnWidth(3, 20);

    // Save the document
    const outputFileName = 'NumberFormat_Special_output.xlsx';
    workbook.SaveToFile({ fileName: outputFileName, version: xlsModule.ExcelVersion.Version2010 });

    // Release resources
    workbook.Dispose();

    // Read the converted file from the VFS and trigger a download
    const fileArray = window.dotnetRuntime.Module.FS.readFile(outputFileName);
    const blob = new Blob([fileArray], { type: 'application/vnd.openxmlformats-officedocument.spreadsheetml.sheet' });
    const url = URL.createObjectURL(blob);
    const a = document.createElement('a');
    a.href = url;
    a.download = outputFileName;
    a.click();
    URL.revokeObjectURL(url);
  };

  return (
    <div style={{ textAlign: 'center', height: '300px' }}>
      <h1>Set Percent, Scientific Notation and Other Formats</h1>
      <button onClick={setSpecialNumberFormat}>
        Start
      </button>
    </div>
  );
}

export default App;
The worksheet after setting percentage, scientific notation and other special formats:
FAQ
The displayed value does not change after setting the number format
Cause: The value written to the cell is actually stored as text, or the data itself is not numeric, so NumberFormat cannot take effect on a number.
Solution: Make sure the value is written with the Range.NumberValue property (rather than a Text or Value string) before setting the NumberFormat, for example:
sheet.Range.get("C4").NumberValue = 1234.5678;
sheet.Range.get("C4").NumberFormat = "0.00";
The value is enlarged after using the percentage format
Cause: Excel displays a percentage format as "stored value × 100". For example, the stored value 12.34 combined with the 0.00% format is displayed as 1234.00%, not 12.34%.
Solution: To display 12.34%, the stored value should be 0.1234. If the original data was entered as a percentage number, divide it by 100 before setting the format.
Negative numbers are not displayed in red
Cause: When a format code contains only one section, positive numbers, negative numbers and zeros all use that section, so [Red] in it affects every value. The color applies only to negative numbers when it is placed in the negative section.
Solution: Split the positive and negative parts with a semicolon and put [Red] in the negative part, for example 0.00;[Red]-0.00.
Obtain a Free License
Spire.XLS for JavaScript offers a 30-day full-featured free trial license with no functional limitations. Apply here to evaluate before purchasing.