Spire.OfficeJS Editor UI Configuration
When the editor is integrated into a business system, its UI usually needs to follow the product. Some products do not want users to see the vendor branding; some pages already have a header, so the editor's title bar looks redundant; sometimes the editor only occupies a narrow side panel where the full toolbar does not fit; and some products want documents to open at a suitable zoom level. All of these can be configured through customization, without changing the editor itself. The examples below use Word. The table below summarizes the Spire.OfficeJS UI settings; each is explained in the following sections.
| Setting | Purpose | Default |
|---|---|---|
whiteLabel |
Remove the vendor logo and branding text | false |
hideTitle |
Hide the top title bar | false |
hideStatusBar |
Hide the bottom status bar | false |
hideRuler |
Hide the ruler | false |
defToolbar |
Toolbar mode | full |
defaultZoom |
Zoom level at open | 1 |
zoomFit |
Fit width or page at open | None |
White-labeling
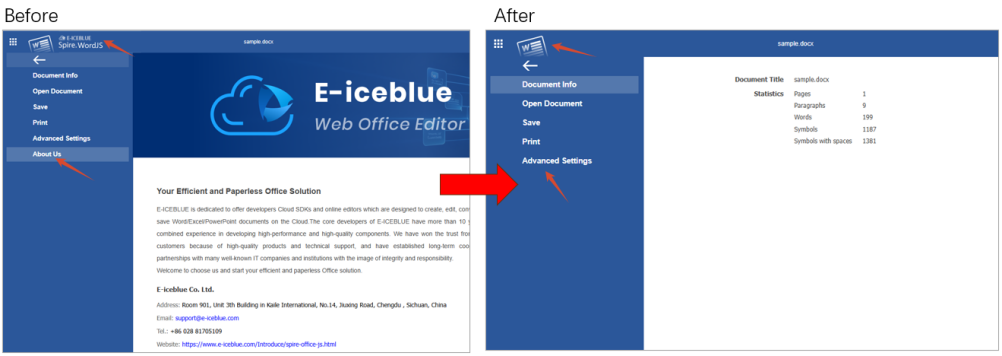
whiteLabel removes vendor branding from the editor UI. When enabled, the vendor logo on the right side of the title bar is hidden and the "File → About Us" entry disappears. Other menus, the toolbar, and document content are unaffected.
common: {
  whiteLabel: true
}
The figure below shows the before and after.
Hide UI regions
The title bar, status bar, and ruler sit at the top, bottom, and above the document page. When space is tight, hide any of them as needed; the three settings are independent.
Hide the title bar
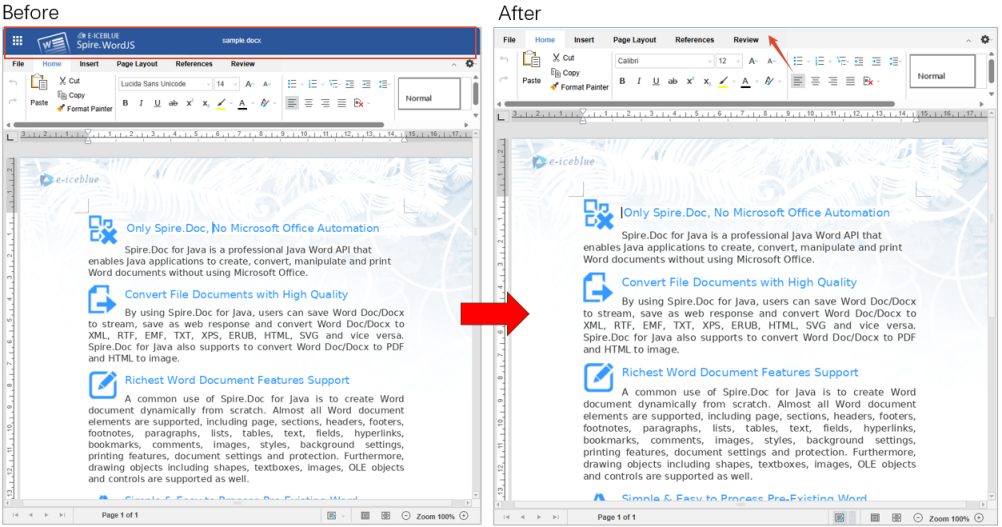
hideTitle hides the title bar at the top of the editor and gives the document more room. Use it when the surrounding page already has its own header.
common: {
  header: {
    hideTitle: true
  }
}
The figure below shows the before and after.
Hide the status bar
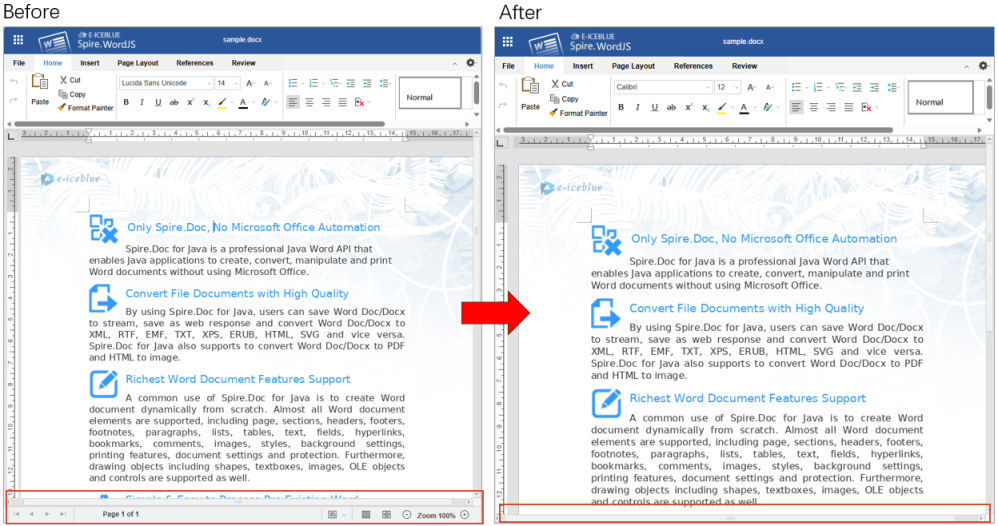
hideStatusBar hides the status bar at the bottom of the editor. The status bar shows page numbers, word count, zoom, and similar information; hiding it gives the document more height.
common: {
  hideStatusBar: true
}
The figure below shows the before and after.
Hide the ruler
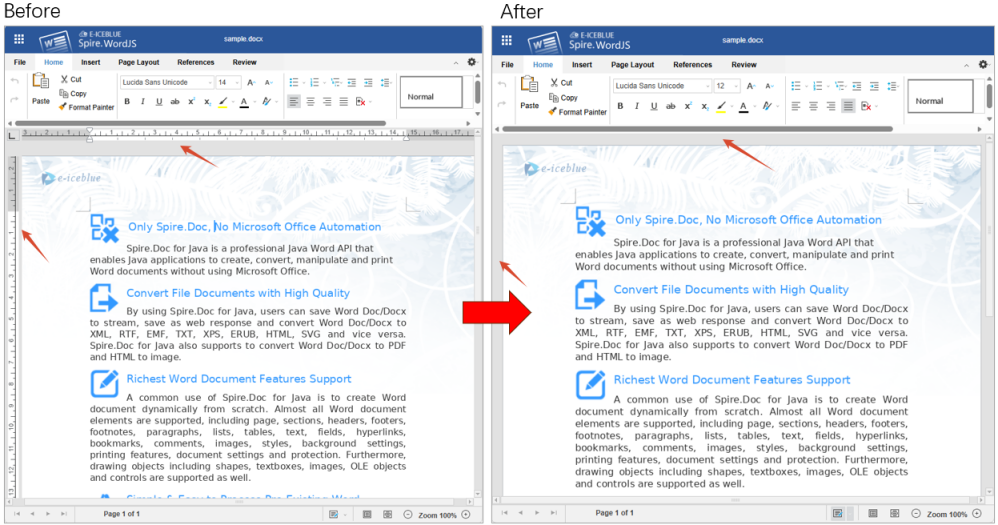
The ruler is a quick way to adjust indents and margins. hideRuler controls whether it is shown in WordJS and PresentationJS. The ruler is visible by default; set it to true to hide it.
common: {
  hideRuler: true
}
The figure below shows the before and after.
Note
These options only set the initial state when the document opens. Users can still show the title bar, status bar, or ruler again from the toolbar; they will be hidden again the next time the document opens.
Toolbar mode
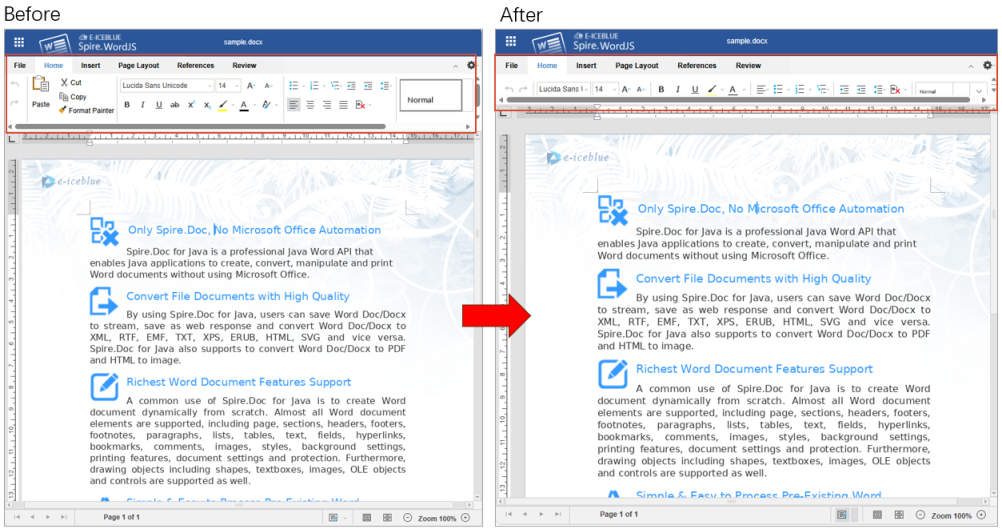
defToolbar sets the toolbar style used when a document opens.
| Value | Description |
|---|---|
full |
Full toolbar (default), commands grouped by tab |
short |
Compact toolbar, buttons condensed into one row for narrow containers |
common: {
  header: {
    defToolbar: 'short'
  }
}
The figure below compares the two modes.
Zoom
A document can open at a fixed zoom level, or automatically fit the editor width or the full page. The first uses defaultZoom; the second uses zoomFit.
Default zoom
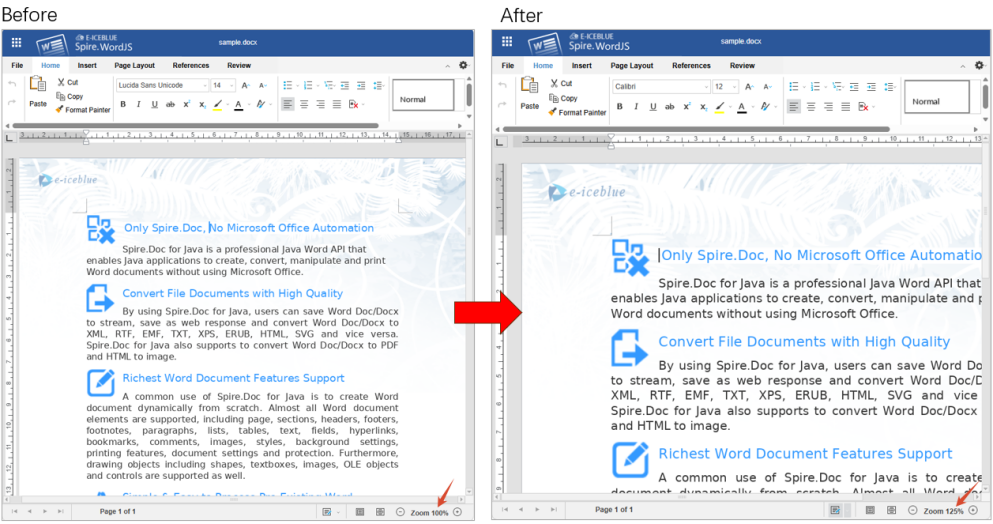
defaultZoom sets the zoom level used when a document opens. 1 means 100% and 1.25 means 125%.
common: {
  defaultZoom: 1.25
}
The figure below shows the status bar at 125%.
Zoom range
The supported range is 0.5–5. Values outside the range are clamped to 0.5 or 5, and a notice appears on the page.
Fit width / fit page
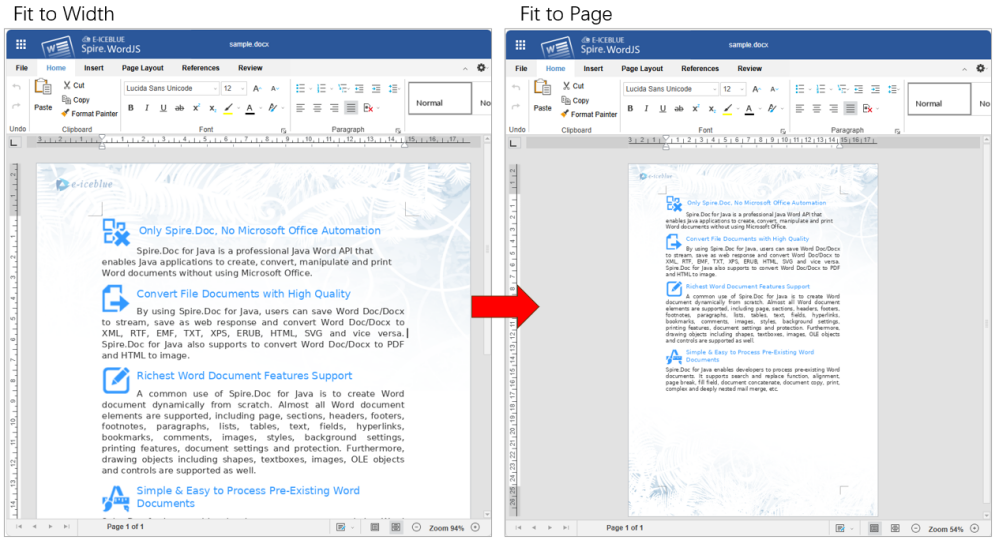
zoomFit makes the document fit the editor width or the full page when it opens. width fits the width; page fits the whole page.
| Value | Description |
|---|---|
width |
Fit width: the page width fills the editor |
page |
Fit page: the whole page is visible in the editor |
common: {
  zoomFit: 'width'
}
The figure below compares fit width and fit page.
Complete example
The configuration above, combined, is shown below:
<div id="editor"></div>
<script src="http://LocalExample:3000/web/editors/spireapi/SpireCloudEditor.js"></script>
<script>
var SERVER = 'http://LocalExample:3000';

var config = {
  fileAttrs: {
    fileInfo: { name: 'sample.docx', ext: 'docx' },
    sourceUrl: SERVER + '/samples/sample.docx'
  },
  user: {
    id: 'uid-1',
    name: 'Jonn',
    canSave: true,
    customization: {
      public: {
        common: {
          whiteLabel: true,
          defaultZoom: 1.25, // fixed zoom; use zoomFit instead to fit the container
          // zoomFit: 'width', // width = fit width, page = fit page
          hideStatusBar: true,
          hideRuler: true,
          header: {
            hideTitle: true,
            defToolbar: 'short'
          }
        }
      }
    }
  },
  editorAttrs: {
    editorMode: 'edit',
    editorType: 'document',
    viewLanguage: 'en',
    useWebAssemblyDoc: true,
    serverless: {
      useServerless: true,
      baseUrl: SERVER
    }
  }
};

new SpireCloudEditor.OpenApi('editor', config);
</script>
FAQ
The UI does not change after editing the configuration
Cause: The browser may have cached the old page. If you use the bundled example system, it reads its configuration at startup, so changes require a restart.
Solution: Force-refresh the page first. With the example system, restart the service and reopen the page.
hideTitle or defToolbar has no effect
Cause: hideTitle and defToolbar are title-bar settings and must be placed under common.header; placed directly under common, they are ignored.
Solution: Use the structure user.customization.public.common.header.hideTitle and user.customization.public.common.header.defToolbar.
White-labeling is on but the red notice or watermark remains
Cause: whiteLabel only removes vendor branding from the UI and does not handle the warning watermark. Without a valid License, the document still shows the trial notice and restricts content.
Solution: Contact [email protected] to purchase a License or apply for a temporary License, then fill in the License Key for the product in editorAttrs, for example spireDocJsLicense for Word.
Create a Treemap Chart in Excel with JavaScript in React
When data is split into categories and subcategories, each carrying a value, rows of a table make it hard to see at a glance how much of the whole each category represents. A treemap nests rectangles by hierarchy and sizes each rectangle by its value, so subcategories of the same category sit side by side and their proportions can be compared directly. Turning such data into a treemap, then adding labels and fill colors, produces a chart that can go straight into a report or a shared document. Spire.XLS for JavaScript creates and renders treemap charts in the browser through WebAssembly, with input and output files managed by a virtual file system (VFS) and no backend service required.
This article covers two features:
For installation and project setup, see Integrating Spire.XLS for JavaScript in a React Project. The examples below assume that Spire.XLS is installed and the WebAssembly module is initialized.
Create a Treemap Chart
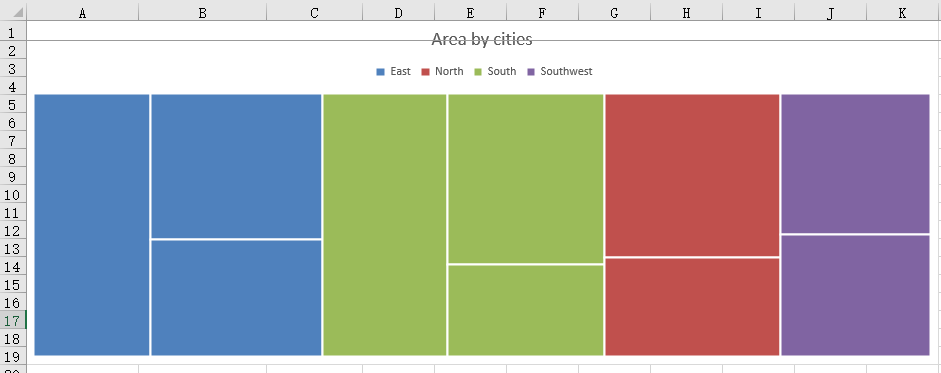
A treemap uses rectangle area to represent values and the nesting of rectangles to represent hierarchy. To build a usable chart, start with three columns, category, item, and value, then set the chart type to tree map and fix the chart position and title. Once the chart is created, saving it in an Excel workbook lets the chart be opened, edited, or shared in spreadsheet software.
How to create a treemap chart and what it produces:
| Call | Result |
|---|---|
window.spire.FetchFileToVFS |
Loads the font file and the test data file into the VFS |
workbook.LoadFromFile({ fileName }) |
Loads the workbook that holds the two-level data |
workbook.Worksheets.get(0) |
Gets the first worksheet of the workbook |
sheet.Charts.Add() |
Adds a chart object to the worksheet |
chart.ChartType = xlsModule.ExcelChartType.TreeMap |
Sets the chart type to tree map |
chart.DataRange = sheet.Range.get("A2:C11") |
Uses two hierarchy columns and one value column as the chart data |
chart.ChartTitle |
Sets the chart title |
chart.TopRow / chart.BottomRow / chart.LeftColumn / chart.RightColumn |
Sets the position and size of the chart on the worksheet |
workbook.SaveToFile({ fileName }) |
Writes the workbook with the treemap chart into the VFS |
The steps are:
- Load the font file and the Excel test file into the VFS with
window.spire.FetchFileToVFS. - Create a workbook with
new Workbook()and load the test file withworkbook.LoadFromFile. - Get the first worksheet with
workbook.Worksheets.get(0). - Add a chart with
sheet.Charts.Add()and setchart.ChartTypetoxlsModule.ExcelChartType.TreeMap. - Set
chart.DataRangetosheet.Range.get("A2:C11"), where the first two columns are the group and the item and the third column decides the rectangle area. - Set
chart.ChartTitle, then fix the chart position and size throughchart.TopRow,chart.BottomRow,chart.LeftColumn, andchart.RightColumn. - Call
workbook.SaveToFileto writeCreateTreeMap.xlsx, release the workbook withworkbook.Dispose, and read the workbook back from the VFS to trigger the download.
Below is the complete example that creates a treemap chart and saves it in an Excel workbook in React:
function App() {
  const createTreeMap = async () => {
    // Get the Spire.XLS WASM module
    const xlsModule = window.wasmModule?.spirexls;

    // Check that the module is ready
    if (!xlsModule) {
      alert('Spire.Xls is not ready yet');
      return;
    }

    // Load the font and the test data file into the VFS
    await window.spire.FetchFileToVFS('ARIAL.TTF', '/Library/Fonts/', `${process.env.PUBLIC_URL}/font/`);
    const inputFileName = 'TreeMapData.xlsx';
    await window.spire.FetchFileToVFS(inputFileName, '', `${process.env.PUBLIC_URL}data/`);

    // Load the workbook
    const workbook = new xlsModule.Workbook();
    workbook.LoadFromFile({ fileName: inputFileName });

    // Get the first worksheet
    const sheet = workbook.Worksheets.get(0);

    // Add a chart and set its type to tree map
    const chart = sheet.Charts.Add();
    chart.ChartType = xlsModule.ExcelChartType.TreeMap;

    // Set the data range: the first two columns are the group and the item, the third is the value
    chart.DataRange = sheet.Range.get('A2:C11');

    // Set the position and size of the chart
    chart.TopRow = 1;
    chart.BottomRow = 20;
    chart.LeftColumn = 1;
    chart.RightColumn = 12;

    // Set the chart title
    chart.ChartTitle = 'Area by cities';

    // Save the workbook with the tree map chart into the VFS
    const outputFileName = 'CreateTreeMap.xlsx';
    workbook.SaveToFile({ fileName: outputFileName });

    // Dispose of the workbook to release its resources
    workbook.Dispose();

    // Read the result back out of the VFS and trigger the download
    const fileArray = window.dotnetRuntime.Module.FS.readFile(outputFileName);
    const blob = new Blob([fileArray], { type: 'application/vnd.openxmlformats-officedocument.spreadsheetml.sheet' });
    const url = URL.createObjectURL(blob);
    const a = document.createElement('a');
    a.href = url;
    a.download = outputFileName;
    a.click();
    URL.revokeObjectURL(url);
  };

  return (
    <div style={{ textAlign: 'center', height: '300px' }}>
      <h1>Create a Tree Map Chart in React</h1>
      <button id="create-treemap" onClick={createTreeMap}>Create Tree Map</button>
    </div>
  );
}

export default App;
The workbook after creating the treemap chart:
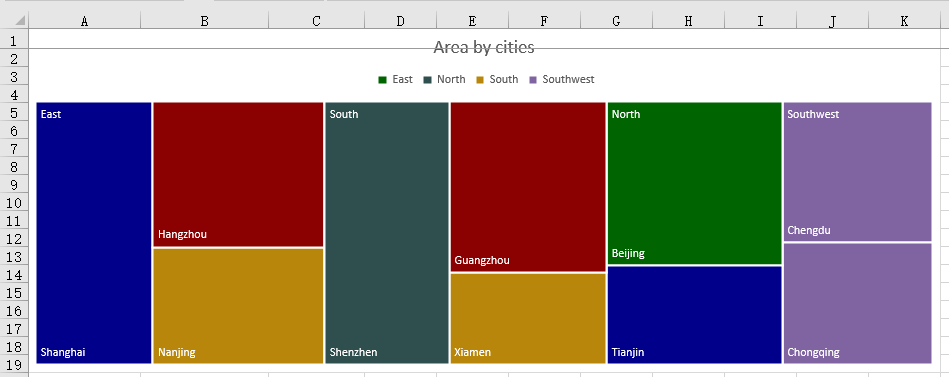
Set Treemap Labels and Fill Colors
By default, a treemap is rendered without any data labels, so readers can rely only on the legend to tell the groups apart and cannot see which item each area stands for. Rectangles in the same group also share one color, which makes neighboring areas less distinct. Turning on name labels for the rectangles and then assigning darker fill colors in data point order places each item name directly on its area; the white labels stay legible on the dark fills, and both the group structure and the relative sizes become easy to read.
How to set treemap labels and fill colors and what it produces:
| Call | Result |
|---|---|
chart.Series.get(0).DataPoints |
Gets the data point collection, one point per rectangle |
points.get(i).DataFormat.Fill.FillType = xlsModule.ShapeFillType.SolidColor |
Makes that rectangle use a solid fill |
points.get(i).DataFormat.Fill.ForeColor = colors[i % colors.length] |
Assigns a fill color to that rectangle |
chart.Series.get(0).DataPoints.DefaultDataPoint.DataLabels.HasCategoryName = true |
Enables category name labels, so item names appear on the rectangles |
chart.Series.get(0).DataFormat.TreeMapLabelOption = xlsModule.ExcelTreeMapLabelOption.Overlapping |
Overlays item names directly on the rectangles and leaves group names in the group corner |
xlsModule.ExcelTreeMapLabelOption.Banner |
Gives group names a strip at the top of each group and keeps item names inside the rectangles |
xlsModule.ExcelTreeMapLabelOption.None |
Hides every label in the chart |
The steps are:
- Load the test workbook and create the chart as described in the previous section, keeping the data range, position, and title unchanged.
- Get the data points with
chart.Series.get(0).DataPoints, loop over the data rows, and setDataFormat.Fill.FillTypetoxlsModule.ShapeFillType.SolidColorandForeColorto the chosen color for each point. - Set
chart.Series.get(0).DataPoints.DefaultDataPoint.DataLabels.HasCategoryNametotrue. Data labels are off by default on a treemap, so category names appear on the rectangles only after this is enabled. - Set
chart.Series.get(0).DataFormat.TreeMapLabelOptiontoxlsModule.ExcelTreeMapLabelOption.Overlappingso item names are drawn directly on the rectangles; useBannerinstead when group names should take a strip at the top of each group. - Write
TreeMapStyled.xlsxwithworkbook.SaveToFileand trigger the download, then release the workbook withworkbook.Dispose.
Below is the complete example. The chart setup is kept from the previous section so that it runs on its own; the additions are the fill colors and the labels:
function App() {
  const styleTreeMap = async () => {
    // Get the Spire.XLS WASM module
    const xlsModule = window.wasmModule?.spirexls;

    // Check that the module is ready
    if (!xlsModule) {
      alert('Spire.Xls is not ready yet');
      return;
    }

    // Load the font and the test data file into the VFS
    await window.spire.FetchFileToVFS('ARIAL.TTF', '/Library/Fonts/', `${process.env.PUBLIC_URL}/font/`);
    const inputFileName = 'TreeMapData.xlsx';
    await window.spire.FetchFileToVFS(inputFileName, '', `${process.env.PUBLIC_URL}data/`);

    // Load the workbook
    const workbook = new xlsModule.Workbook();
    workbook.LoadFromFile({ fileName: inputFileName });

    // Get the first worksheet
    const sheet = workbook.Worksheets.get(0);

    // Add a tree map chart and set its data range
    const chart = sheet.Charts.Add();
    chart.ChartType = xlsModule.ExcelChartType.TreeMap;
    chart.DataRange = sheet.Range.get('A2:C11');
    chart.TopRow = 1;
    chart.BottomRow = 20;
    chart.LeftColumn = 1;
    chart.RightColumn = 12;
    chart.ChartTitle = 'Area by cities';

    // Prepare the fill colors used in the loop
    const colors = [
      xlsModule.Color.get_DarkGreen(),
      xlsModule.Color.get_DarkBlue(),
      xlsModule.Color.get_DarkGoldenrod(),
      xlsModule.Color.get_DarkRed(),
      xlsModule.Color.get_DarkSlateGray(),
    ];

    // Set the fill color of every rectangle in data point order (10 data rows)
    const points = chart.Series.get(0).DataPoints;
    for (let i = 0; i < 10; i++) {
      points.get(i).DataFormat.Fill.FillType = xlsModule.ShapeFillType.SolidColor;
      points.get(i).DataFormat.Fill.ForeColor = colors[i % colors.length];
    }

    // Enable category name labels and overlay the item names on the rectangles
    chart.Series.get(0).DataPoints.DefaultDataPoint.DataLabels.HasCategoryName = true;
    chart.Series.get(0).DataFormat.TreeMapLabelOption = xlsModule.ExcelTreeMapLabelOption.Overlapping;

    // Save the workbook with the tree map chart into the VFS
    const outputFileName = 'TreeMapStyled.xlsx';
    workbook.SaveToFile({ fileName: outputFileName });

    // Dispose of the workbook to release its resources
    workbook.Dispose();

    // Read the result back out of the VFS and trigger the download
    const fileArray = window.dotnetRuntime.Module.FS.readFile(outputFileName);
    const blob = new Blob([fileArray], { type: 'application/vnd.openxmlformats-officedocument.spreadsheetml.sheet' });
    const url = URL.createObjectURL(blob);
    const a = document.createElement('a');
    a.href = url;
    a.download = outputFileName;
    a.click();
    URL.revokeObjectURL(url);
  };

  return (
    <div style={{ textAlign: 'center', height: '300px' }}>
      <h1>Create a Tree Map Chart in React</h1>
      <button id="style-treemap" onClick={styleTreeMap}>Set Labels and Fill Colors</button>
    </div>
  );
}

export default App;
The workbook after setting treemap labels and fill colors:
FAQ
Treemap labels do not appear
Cause: Data labels are off by default on a treemap, so no names are drawn on the rectangles. TreeMapLabelOption only controls how labels are laid out, and setting it alone does not make labels visible.
Solution: Set DataLabels.HasCategoryName on the data points to true first, then set TreeMapLabelOption: use Overlapping to draw item names directly on the rectangles, or Banner to give group names a strip at the top of each group. For example:
chart.Series.get(0).DataPoints.DefaultDataPoint.DataLabels.HasCategoryName = true;
chart.Series.get(0).DataFormat.TreeMapLabelOption = xlsModule.ExcelTreeMapLabelOption.Overlapping;
How can the position and size of a treemap be adjusted
Cause: The position of a chart is controlled by TopRow, BottomRow, LeftColumn, and RightColumn, which mark the first and last row and column the chart covers.
Solution: Adjust these four properties before saving the workbook. Larger values widen the range of rows and columns the chart covers, so the chart takes up more space on the worksheet.
How should the data for a treemap be arranged
Cause: A treemap reads hierarchy and values by column, so the order of the columns determines how groups, items, and areas correspond to one another.
Solution: Arrange the data in three columns: the first for the category, the second for the item, and the third for the value, and keep the value column numeric. Start chart.DataRange at the first data row, for example sheet.Range.get("A2:C11"), so the header row is not included.
Get a Free License
Spire.XLS for JavaScript offers a 30-day full-featured free trial license with no functional limitations. Apply here to evaluate before purchasing.
Convert PowerPoint Presentations to Markdown in Java
 |
|---|
Presentation content often ends up in a documentation site, a code repository or a knowledge base, where Markdown fits better: changes can be diffed line by line, and a static site generator can render the file as it stands. Transcribing the slides by hand takes time, and heading levels and list indentation tend to drift on the way across.
Spire.Presentation for Java reads a .pptx file on the server and writes Markdown, so no Microsoft PowerPoint installation is needed in the runtime environment.
Tutorial overview
Setting up the environment
Add Spire.Presentation for Java to the project before starting the conversion.
Why Spire.Presentation for Java
A PowerPoint presentation cannot export Markdown on its own, so the conversion needs a component that can parse the structure of the slides. Spire.Presentation for Java covers a whole deck, several consecutive slides and a single slide, with one method each for loading and writing, and no Office installation is required.
Installing Spire.Presentation for Java
For a Maven project, add the following configuration to the pom.xml file to import the JAR:
<repositories>
  <repository>
    <id>com.e-iceblue</id>
    <name>e-iceblue</name>
    <url>https://repo.e-iceblue.com/nexus/content/groups/public/</url>
  </repository>
</repositories>

<dependencies>
  <dependency>
    <groupId>e-iceblue</groupId>
    <artifactId>spire.presentation</artifactId>
    <version>11.10.4</version>
  </dependency>
</dependencies>
Without Maven, download the Spire.Presentation for Java package and add the JAR file to the project's classpath.
Convert PowerPoint presentations to Markdown
Titles, sections and tables are kept in the Markdown, and the result can go straight into a repository or a site generator. The scope is chosen to fit: the whole deck, several consecutive slides or a single slide. All three load the presentation the same way; the difference is whether Presentation or ISlide writes the file.
1. Convert a whole presentation to Markdown
Converting the whole deck needs no slide range: the file is read once and written once, in the order the slides are shown.
To convert a whole PowerPoint presentation to Markdown, loading and writing each take one method:
| Syntax | Result |
|---|---|
presentation.loadFromFile("data/Sample.pptx") |
Loads the presentation to convert from the project's data directory |
presentation.saveToFile("WholePresentation.md", FileFormat.Markdown) |
Writes the whole presentation to a Markdown file |
presentation.dispose() |
Releases the resources held by the Presentation object |
The steps are:
- Create a
Presentationobject withnew Presentation(). - Load the sample presentation with
presentation.loadFromFile. - Pass the output file name and
FileFormat.Markdowntopresentation.saveToFile. - Release the resources held by the Presentation object with
presentation.dispose.
import com.spire.presentation.*;

public class ConvertWholePresentation {

    public static void main(String[] args) throws Exception {
        // Create a Presentation object
        Presentation presentation = new Presentation();

        // Load the sample presentation
        presentation.loadFromFile("data/Sample.pptx");

        // Save the whole presentation as a Markdown file
        presentation.saveToFile("WholePresentation.md", FileFormat.Markdown);

        // Release the resources held by the Presentation object
        presentation.dispose();
    }
}
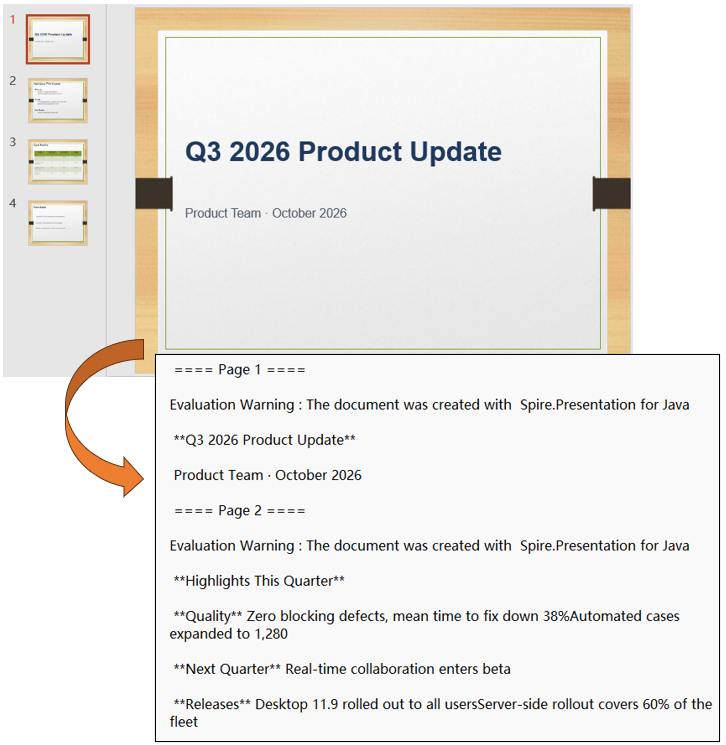
The Markdown file after converting the whole presentation:
2. Convert multiple slides to Markdown
When only part of a presentation is needed, pass a start and an end number and only that stretch is exported; nothing outside it reaches the result.
To convert multiple slides to Markdown, saveToFile takes a start and an end number ahead of the output file name and the target format:
| Syntax | Result |
|---|---|
presentation.saveToFile(1, 3, "SelectedSlides.md", FileFormat.Markdown) |
Writes slides 2 to 4 to a Markdown file |
The steps are:
- Create a
Presentationobject withnew Presentation(). - Load the sample presentation with
presentation.loadFromFile. - Pass the start number
1, the end number3, the output file name andFileFormat.Markdowntopresentation.saveToFile. - Release the resources held by the Presentation object with
presentation.dispose.
import com.spire.presentation.*;

public class ConvertSelectedSlides {

    public static void main(String[] args) throws Exception {
        // Create a Presentation object
        Presentation presentation = new Presentation();

        // Load the sample presentation
        presentation.loadFromFile("data/Sample.pptx");

        // Save slides 2 to 4 as a Markdown file
        presentation.saveToFile(1, 3, "SelectedSlides.md", FileFormat.Markdown);

        // Release the resources held by the Presentation object
        presentation.dispose();
    }
}
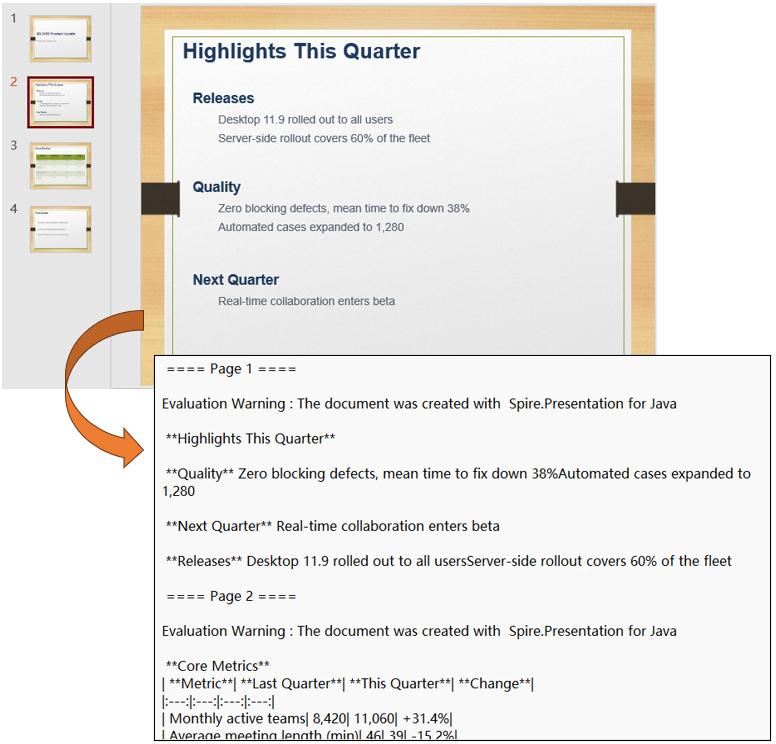
The Markdown file after converting slides 2 to 4:
3. Convert a specified slide to Markdown
When only one slide is needed, take it out of the slide collection and write it with ISlide; the result file holds that slide only.
To convert a specified slide to Markdown, the writing is done by the ISlide object taken out of the collection:
| Syntax | Result |
|---|---|
presentation.getSlides().get(1) |
Takes the second slide out of the collection and returns it as an ISlide |
slide.saveToFile("SingleSlide.md", FileFormat.Markdown) |
Writes that one slide to a Markdown file |
The steps are:
- Create a
Presentationobject withnew Presentation()and load the sample presentation withpresentation.loadFromFile. - Take the second slide by index with
presentation.getSlides().get(1)and assign it to anISlidevariable. - Pass the output file name and
FileFormat.Markdowntoslide.saveToFileto write that one slide out as a Markdown file. - Release the resources held by the Presentation object with
presentation.dispose.
import com.spire.presentation.*;

public class ConvertSingleSlide {

    public static void main(String[] args) throws Exception {
        // Create a Presentation object
        Presentation presentation = new Presentation();

        // Load the sample presentation
        presentation.loadFromFile("data/Sample.pptx");

        // Take the second slide out of the collection
        ISlide slide = presentation.getSlides().get(1);

        // Save that slide as a Markdown file
        slide.saveToFile("SingleSlide.md", FileFormat.Markdown);

        // Release the resources held by the Presentation object
        presentation.dispose();
    }
}
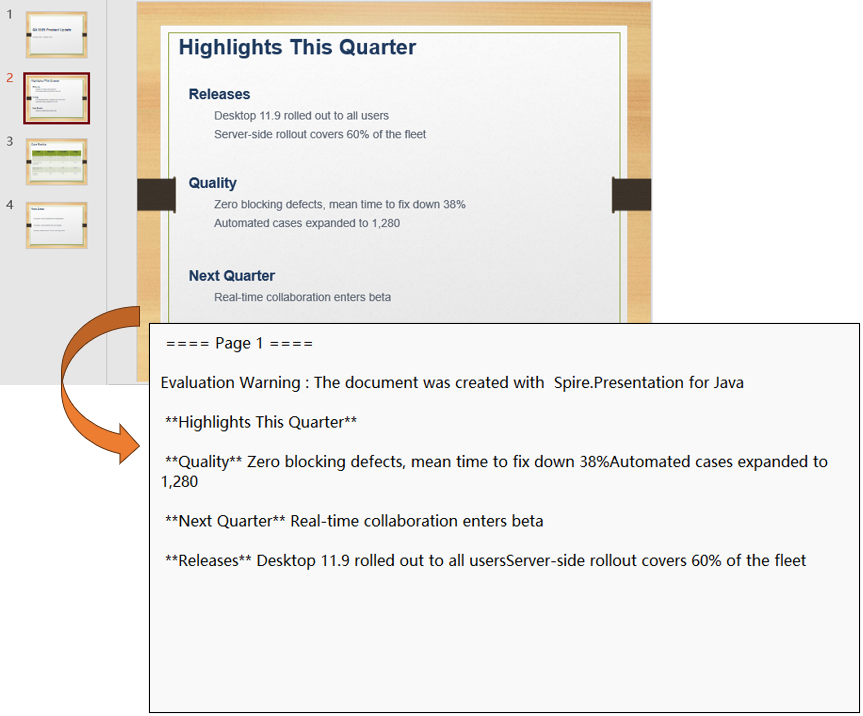
The Markdown file after converting the second slide:
Summary
Converting PowerPoint presentations to Markdown in Java is essentially reading the structure of the slides and writing it out as text. Markdown is lightweight and widely supported, which makes it a good fit for code repositories as well as documentation sites and knowledge bases. With Spire.Presentation for Java set up and the sample code in this article, the conversion can be automated, reducing manual work and improving efficiency.
If you'd like to remove the evaluation message from the generated documents, or to get rid of the function limitations, please request a 30-day trial license for yourself.
FAQ
Do the slide numbers in saveToFile start at 0 or at 1?
Cause: The start and end numbers of Presentation and the index of getSlides().get(index) all count 0 as the first slide, and both ends of the range are included. Passing 1 and 3 gives slides 2 to 4, three slides in all.
Solution: To export the first N slides, pass 0 and N - 1; getSlides().get(0) likewise takes the first slide. For a single slide, call slide.saveToFile on that slide instead of building a range.
Does the conversion require Microsoft PowerPoint to be installed?
Cause: Spire.Presentation for Java is a standalone Java library that parses .pptx files itself; it does not rely on other Office components.
Solution: The runtime environment needs only a JDK and the project dependencies; no Microsoft PowerPoint or other Office component is required.
Why are the images and speaker notes missing from the converted Markdown?
Cause: The Markdown result is text-based; images are not turned into image links, and speaker notes are not written to the result file.
Solution: To keep images and layout, convert to HTML or PDF instead; if images are needed, add image references to the converted file afterwards.
Save Documents with Spire.OfficeJS
When a user finishes editing, where the document goes and how it is stored is usually up to the business system. Saving in Spire.OfficeJS leaves that control with you: the editor only generates the current document in the browser, and you can either send it to a backend endpoint or handle it in the page. Whether it overwrites the original document, creates a new version, or saves a copy can follow your own rules. The examples below use Word to show how to save documents with Spire.OfficeJS:
Document saving process
The save takes five steps. "Business page" in the figure refers to the page that hosts the editor; the term is used throughout below.
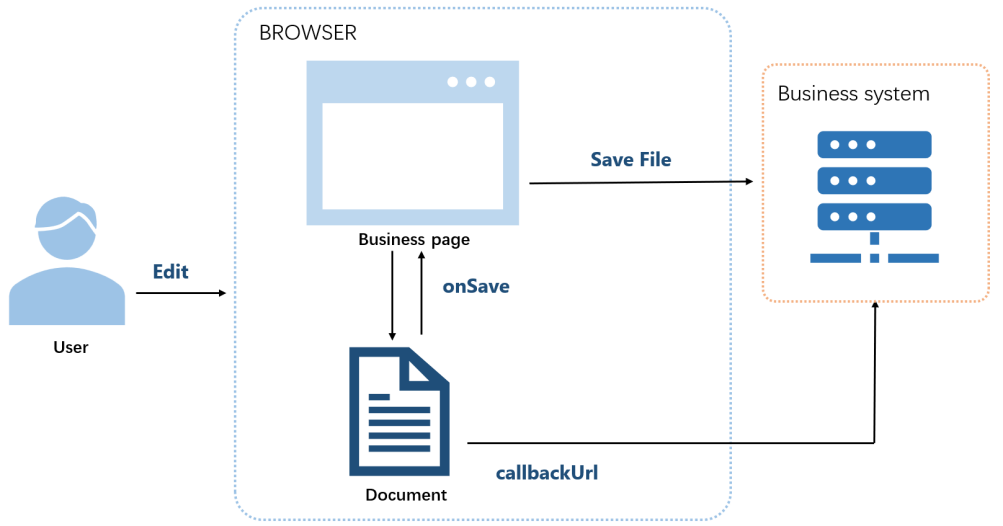
- The user edits the document.
- The user saves.
- The editor generates the current document.
- With
callbackUrl, the document is sent to that address; withonSave, the business page receives it. - The editor shows "Saved successfully".
Before you save
Saving requires the following configuration:
user.canSaveset totrue(the default).editorAttrs.editorModeset toedit.
Both examples below include these settings. Replace LocalExample with the actual deployment address.
Ways to save a document
Spire.OfficeJS supports two ways to save a document: use callbackUrl when the document should be saved by your backend, and use onSave when the page should handle the save result itself. The steps for each option are described below.
Save a document with callbackUrl
Use this when your backend saves the document. With callbackUrl configured, the editor sends the current document to that address on save, and the endpoint receives and stores it.
- Create an
.htmlpage to open the document. - Configure the save endpoint in
config.fileAttrs.callbackUrl. - Open the page, edit the document, and save. The editor shows "Saved successfully" once the endpoint returns success.
Example configuration:
var config = {
  fileAttrs: {
    fileInfo:
    { name: 'sample.docx',
      ext: 'docx',
      primary: '001'
    },
    sourceUrl: 'http://LocalExample:3000/samples/sample.docx',
    callbackUrl: 'http://LocalExample:3001/saveWebAssembly'
  },
  user:
  { id: 'uid-1',
    name: 'Jonn',
    canSave: true
  },
  editorAttrs: {
    editorMode: 'edit',
    editorType: 'document',
    viewLanguage: 'en',
    useWebAssemblyDoc: true,
    canForcesave: true,
    serverless: {
      useServerless: true,
      baseUrl: 'http://LocalExample:3000'
    },
  }
};

new SpireCloudEditor.OpenApi('editor', config);
Save a document with onSave
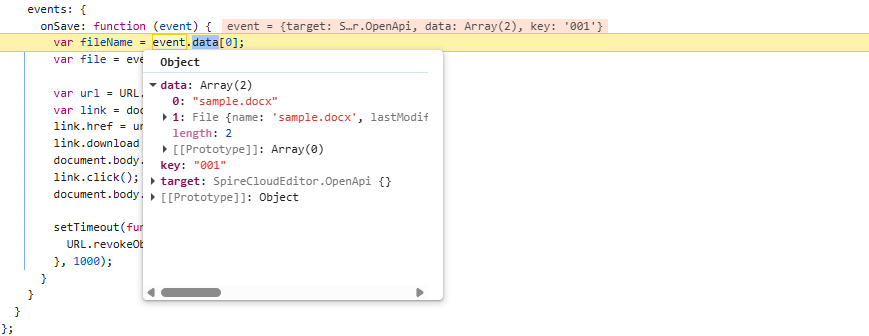
Use this when you have no save endpoint, or you want the page to handle the save result itself. On save, the editor calls onSave and passes the result in event.data:
event.data[0]is the file name, a string such assample.docx.event.data[1]is the current document content, a standard browserFileobject you can download or upload directly.
What you do with these two items is up to the page: download locally, upload to a backend, rename the document, or just show a message. The editor only generates the save result and calls the callback.
Example configuration (do not set callbackUrl in fileAttrs, or set it to empty):
var config = {
  fileAttrs: {
    fileInfo:
    { name: 'sample.docx',
      ext: 'docx',
      primary: '001' },
    sourceUrl: 'http://LocalExample:3000/samples/sample.docx'
  },
  user:
  { id: 'uid-1',
    name: 'Jonn',
    canSave: true
  },
  editorAttrs: {
    editorMode: 'edit',
    editorType: 'document',
    viewLanguage: 'en',
    useWebAssemblyDoc: true,
    serverless: {
      useServerless: true,
      baseUrl: 'http://LocalExample:3000'
    },
    events: {
      onSave: function (event) {
        var fileName = event.data[0]; // file name (FileName), e.g. sample.docx
        var file = event.data[1];     // file object (File), the current document
        var key = event.key;          // document key, equal to fileInfo.primary, e.g. 001

        // The handling below is entirely up to the page.
        // Example: download locally
        var url = URL.createObjectURL(file);
        var link = document.createElement('a');
        link.href = url;
        link.download = fileName;
        document.body.appendChild(link);
        link.click();
        document.body.removeChild(link);
        setTimeout(function () {
          URL.revokeObjectURL(url);
        }, 1000);
      },
      onDocumentStateChange: function (event) {
        console.log(event.data ? 'Unsaved' : 'Saved');
      }
    }
  }
};

new SpireCloudEditor.OpenApi('editor', config);
This is what event.data looks like at an onSave :
FAQ
Will saving overwrite the original document automatically
Cause: Spire.OfficeJS does not write the edits back to sourceUrl automatically. Saving only generates the current document and hands it to your business system.
Solution: Handle it in the callbackUrl endpoint or the onSave callback: whether to overwrite the original document, create a new version, or save a copy is up to your business system.
Both callbackUrl and onSave are configured, but onSave does not run
Cause: When both are configured, callbackUrl takes precedence and onSave does not run; with neither, the editor offers no save function.
Solution: Keep only one save outlet. If the page should handle the document itself, remove fileAttrs.callbackUrl or set it to empty.
Open Documents with Spire.OfficeJS
For many business systems, previewing a document means asking the user to download it and open it locally, or relying on a browser plug-in. Spire.OfficeJS supports opening documents directly in the page, and users do not need to install Office. The document can come from an address the business system can already access or from the user's local selection. This article uses Word as an example to explain how to open documents with Spire.OfficeJS:
Document opening process
The figure and steps below describe the process of opening a document. "Business page" refers to the page in your own business system that hosts the editor.
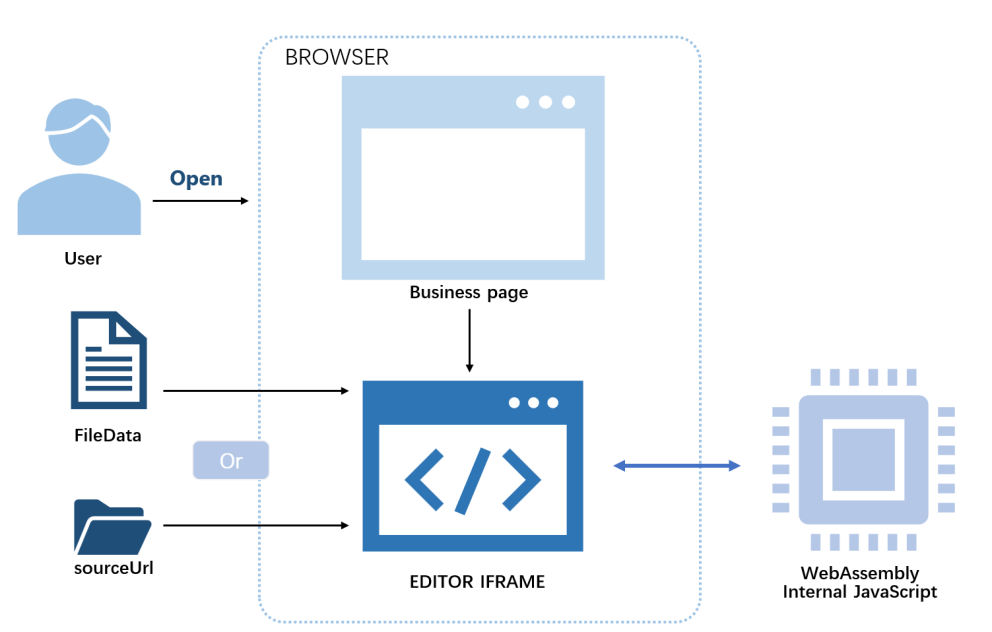
- The user opens the document through the business page to view or edit it.
- The business page prepares the
config:sourceUrl(orserverless.fileData),fileInfo,user, andeditorAttrs. SpireCloudEditor.OpenApicreates the editor iframe.- In
sourceUrlmode, the browser reads the document from your business storage; infileDatamode, the bytes passed in by the page are used directly. - WebAssembly converts the Office document into the editor's internal format, and the internal JavaScript renders the content on the page.
Ways to open a document
Spire.OfficeJS supports two ways to open a document: use sourceUrl when the document already has an accessible URL, and use fileData when the document comes from the user's local selection and has not been uploaded yet. The steps for each option are described below.
Open a document with sourceUrl
Use this option when the document already has an accessible URL. Create an empty .html file and add the key content following the steps below; replace LocalExample with the actual deployment address.
Add the editor container:
<div id="editor"></div>Include the editor script:
<script src="http://LocalExample:3000/web/editors/spireapi/SpireCloudEditor.js"></script>Prepare the
config. The important parts are the document URL and thewebresource URL:var config = { fileAttrs: { fileInfo: { name: 'sample.docx', ext: 'docx' }, sourceUrl: 'http://LocalExample:3000/samples/sample.docx' }, user: { id: 'uid-1', name: 'Jonn' }, editorAttrs: { editorMode: 'edit', editorType: 'document', viewLanguage: 'en', useWebAssemblyDoc: true, serverless: { useServerless: true, baseUrl: 'http://LocalExample:3000' } } };Initialize the editor:
new SpireCloudEditor.OpenApi('editor', config);
Open a document with fileData
Use this option when the document comes from the user's local selection and has not been uploaded yet. The page structure is the same as in the sourceUrl option (container + editor script); the difference is that you add a file selector and put the document bytes into serverless.fileData.
Add the file selector and the editor container:
<input type="file" id="fileInput" accept=".doc,.docx">
<div id="editor"></div>
Read the file, build the
config, and initialize:var opened = false; document.getElementById('fileInput').addEventListener('change', function (e) { var file = e.target.files[0]; if (!file) return; var ext = file.name.split('.').pop().toLowerCase(); var reader = new FileReader(); reader.onload = function (event) { var config = { fileAttrs: { fileInfo: { name: file.name, ext: ext }, sourceUrl: 'offline' // placeholder; it is not requested in fileData mode }, user: { id: 'uid-1', name: 'Jonn' }, editorAttrs: { editorMode: 'edit', editorType: 'document', viewLanguage: 'zh', useWebAssemblyDoc: true, serverless: { useServerless: true, baseUrl: 'http://LocalExample:3000', fileData: event.target.result } } }; var targetId = opened ? 'SpireCloudEditor' : 'editor'; opened = true; new SpireCloudEditor.OpenApi(targetId, config); }; reader.readAsArrayBuffer(file); });
FAQ
sourceUrl is configured but the document fails to load
Cause: The document is read directly by the browser. If sourceUrl cannot be reached, the editor cannot get the document and it will not open.
Solution: Set sourceUrl to an address the browser can open directly, and make sure the document can be accessed in the browser.
Do I need sourceUrl when using the fileData option
Cause: In fileData mode, the editor uses the bytes passed in by the page directly and does not request sourceUrl; however, sourceUrl must not be empty.
Solution: Set sourceUrl to a placeholder value such as offline.
The document content is incomplete and a watermark is shown
Cause: A valid license is not configured, or the license does not match the product that opens the document. Without a license, the editor shows red watermark text in the document and limits the document length, so the content is displayed incompletely.
Solution: Fill in the license field for the corresponding product in editorAttrs; for example, fill in spireDocJsLicense for WordJS. If you use the bundled example system, configure the License Key under server.customization in example/config/default.json.
Convert and Download Documents with Spire.OfficeJS
Contract delivery usually calls for PDF, archiving may call for DOCX, and some pages also need to export HTML or TXT. Spire.OfficeJS converts the document currently in the editor into these formats and hands it to the browser for download. This article uses Word as an example to explain how to convert and download documents with Spire.OfficeJS:
Document conversion and download process
The download takes four steps:
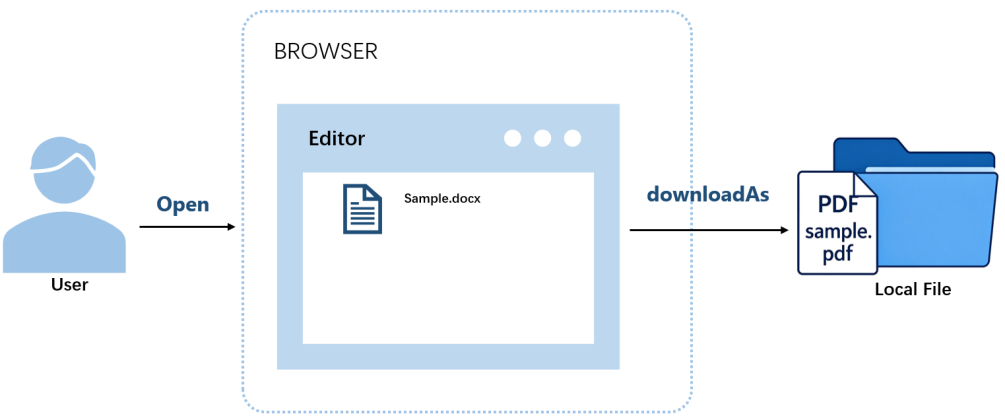
- The user opens a document in the editor.
- The user clicks the convert-and-download button on the page, which calls
docEditor.downloadAs()with the target format. - The editor converts the current document to the target format.
- The browser downloads the document locally.
Using downloadAs
The editor provides the downloadAs() method to convert the current document to a specified format and hand it to the browser for download. You can call it once the editor is initialized; the conversion runs in the browser, and the result is a local copy.
Example configuration (converting to PDF):
var onDownloadAs = function () {
  docEditor.downloadAs({ format: 'pdf'});
};
format takes the target format's file extension and is case-insensitive.
Complete code:
<!DOCTYPE html>
<html lang="en">
<head>
  <meta charset="UTF-8">
  <title>Spire.OfficeJS Convert File - downloadAs</title>
  <style>
    html, body { height: 100%; margin: 0; }
    body { display: flex; flex-direction: column; }
    #editor { flex: 1; min-height: 0; }
    #editor iframe { width: 100%; height: 100%; border: 0; }
  </style>
</head>
<body>
  <button type="button" id="download" onclick="onDownloadAs()" disabled>Download PDF</button>
  <div id="editor"></div>
  <script src="http://LocalExample:3000/web/editors/spireapi/SpireCloudEditor.js"></script>
  <script>
    var SERVER = 'http://LocalExample:3000';
    var downloadButton = document.getElementById('download');

    var config = {
      fileAttrs: {
        fileInfo: { name: 'sample.docx', ext: 'docx' },
        sourceUrl: SERVER + '/samples/sample.docx'
      },
      user: { id: 'uid-1', name: 'Jonn' },
      editorAttrs: {
        editorMode: 'edit',
        editorType: 'document',
        viewLanguage: 'en',
        canDownload: true,
        useWebAssemblyDoc: true,
        serverless: { useServerless: true, baseUrl: SERVER },
        events: {
          onStart: function () {
            downloadButton.disabled = false;
          }
        }
      }
    };

    var docEditor = new SpireCloudEditor.OpenApi('editor', config);

    function onDownloadAs() {
      docEditor.downloadAs({ format: 'pdf' });
    }
  </script>
</body>
</html>
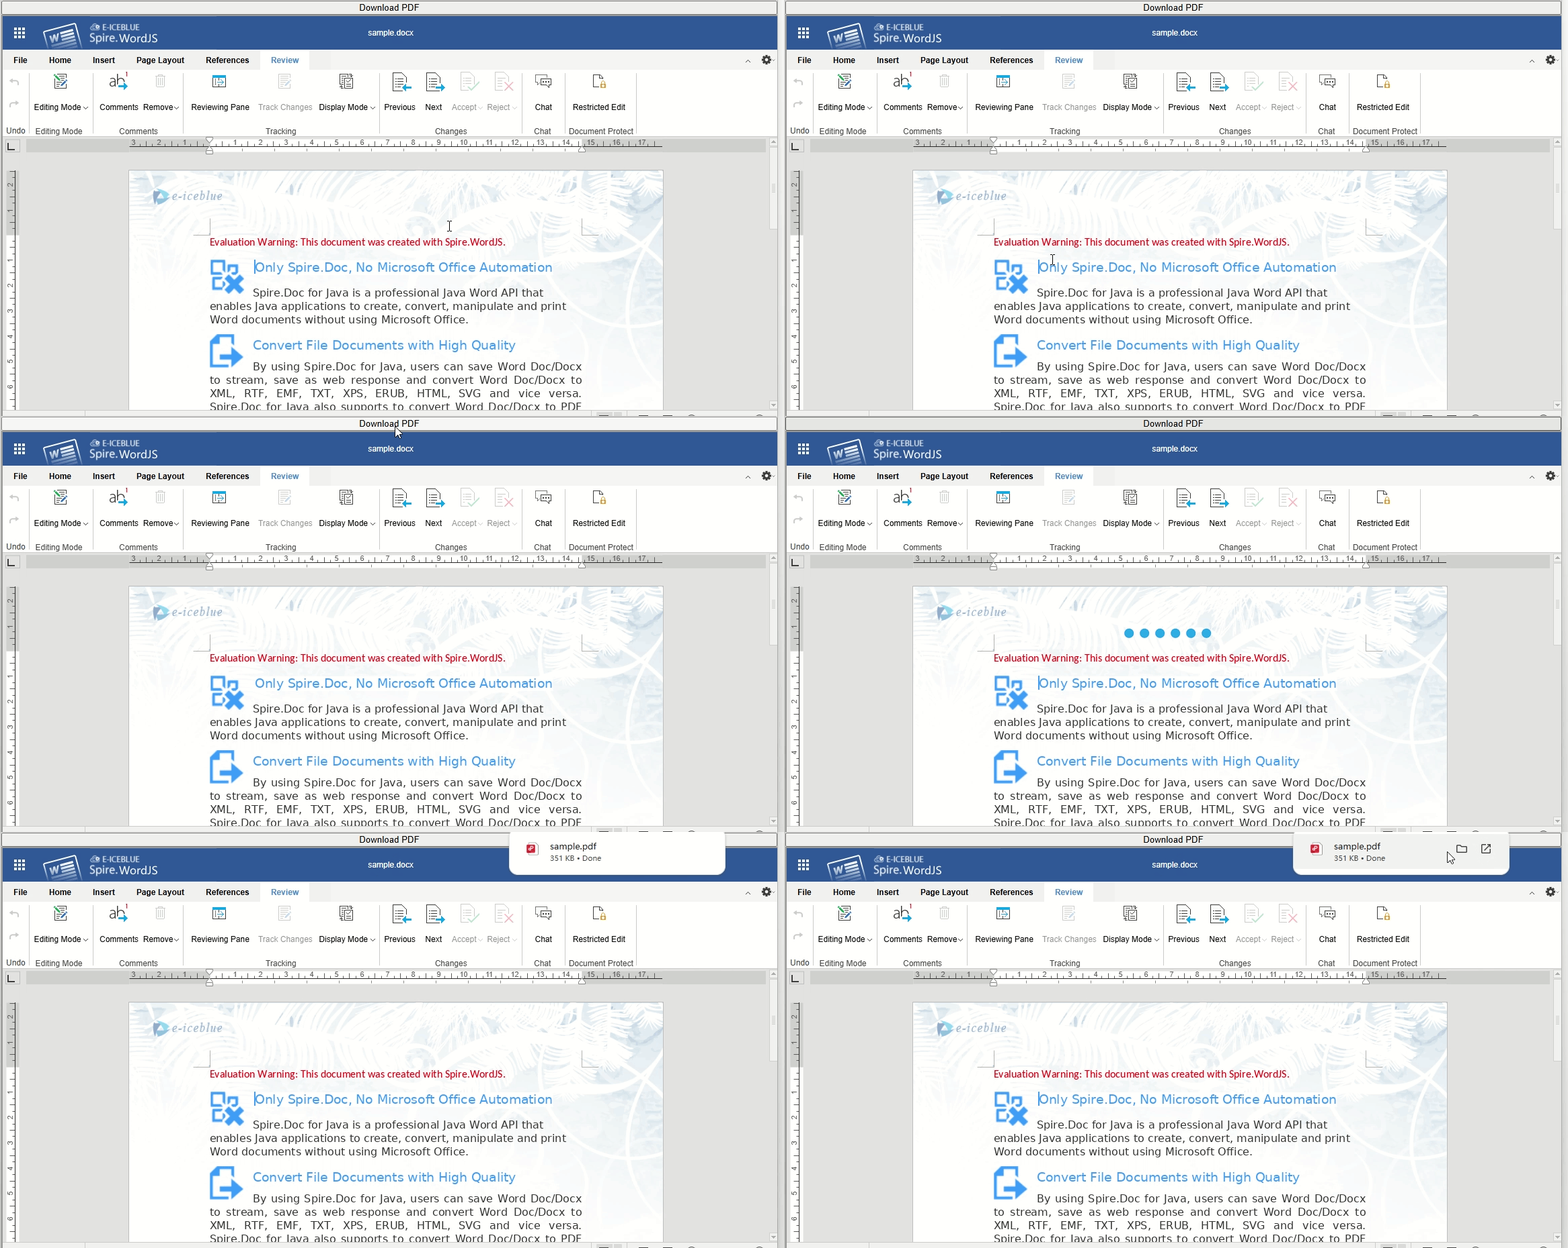
After selecting a document and clicking the download button, the editor converts it and the browser downloads the resulting PDF:
Supported formats
The formats you can convert to depend on the editor that opened the document. Word, Excel, and Presentation load on different pages and support different target formats, so pick the format for the editor that matches the document. The target formats supported by each editor are listed below:
| Editor | Supported formats |
|---|---|
| Spire.WordJS | DOCX, PDF, PDFA, ODT, DOTX, OTT, RTF, HTML, TXT |
| Spire.ExcelJS | XLSX, XLTX, PDF, PDFA, CSV, ODS, OTS |
| Spire.PresentationJS | PPTX, PDF, ODP, POTX, OTP |
FAQ
Does downloading modify the original document or trigger save callbacks
Cause: Downloading does not call callbackUrl or onSave, and it does not write back to sourceUrl; it only generates the document in the browser and downloads it.
Solution: No extra handling is needed. The download is a local copy; neither the original document nor the one in your business system is modified.
format is set, but the downloaded document's format does not change
Cause: If format is unrecognized, the document editor falls back to the document's original format.
Solution: Use the target formats listed for the matching editor in the supported formats table. For example, with sample.docx as the original and format: 'bogus', the downloaded document is still sample.docx.
Can multiple documents be converted at once
Cause: downloadAs() converts only the document currently open in the editor, and one call produces one document in the target format.
Solution: To convert multiple documents, open each document in turn and call downloadAs() for each one, for example by opening the next document after each conversion on the business page.
Spire.OfficeJS License Configuration
A valid License is required after Spire.OfficeJS is deployed. Without a License, opened documents show a red trial notice and the content is restricted: Word is limited to 500 paragraphs and 25 tables, Excel to 5 worksheets with up to 200 rows per worksheet, and Presentation and PDF to 10 pages. For details on the restrictions, see the trial version notes on the official download page.
Get a License
To purchase a License or apply for a 30-day temporary License, contact [email protected]. When you contact us, please provide the IP address or domain name of the server you plan to deploy on, and the email address that should receive the license file.
After purchasing or applying for a trial, you will receive a license file in XML format, usually named license.elic.xml. Open the file with a text editor, copy the value of the Key attribute from the root element <License Key="..."> (without the quotes and tags), and fill it into the corresponding field in the table below. The file is digitally signed; do not modify it.
License configuration
The bundled example system and your own frontend project use the same license fields; only the location where you configure them differs. The licensed products and their corresponding fields are:
| Licensed product | License field |
|---|---|
| Spire.OfficeJS | spireOfficeJsLicense |
| Spire.WordJS | spireDocJsLicense |
| Spire.ExcelJS | spireXlsJsLicense |
| Spire.PresentationJS | spirePresentationJsLicense |
| Spire.PDFJS | spirePdfJsLicense |
Whichever product you purchased, fill its License Key into the corresponding field, and leave the fields for products you have not purchased as empty strings "". For example, if you only purchased Spire.WordJS, fill in spireDocJsLicense:
"editorAttrs": {
  "spireDocJsLicense": "WordJS License Key",
  "spireXlsJsLicense": "",
  "spirePresentationJsLicense": "",
  "spirePdfJsLicense": "",
  "spireOfficeJsLicense": ""
}
If you purchased the Spire.OfficeJS suite license, fill in only spireOfficeJsLicense and leave the other four fields empty. The suite already includes Spire.WordJS, Spire.ExcelJS, Spire.PresentationJS, and Spire.PDFJS.
Where to configure the License depends on how you use Spire.OfficeJS: use the example system bundled with the product package for a quick trial, or integrate the editor into your own frontend project.
Option 1: Use the bundled example system (default port 3000)
When using the example system bundled with the product package, the license fields are located under server.customization in example/config/default.json. Only the license fields are listed below; leave the other settings unchanged:
"customization": {
  "spireDocJsLicense": "WordJS License Key",
  "spireXlsJsLicense": "",
  "spirePresentationJsLicense": "",
  "spirePdfJsLicense": "",
  "spireOfficeJsLicense": ""
}
After saving, restart the example service for the new configuration to take effect.
Option 2: Integrate into your own frontend project
In your own frontend project, the license fields are written under the editorAttrs object passed to the editor. For example, in Vue:
config.value = {
        "editorAttrs": {
            "spireDocJsLicense": "WordJS License Key",
            "spireXlsJsLicense": "",
            "spirePresentationJsLicense": "",
            "spirePdfJsLicense": "",
            "spireOfficeJsLicense": "",
        }
    };
Other frameworks work the same way: find editorAttrs in your configuration and fill in the same fields.
For complete integration steps for each framework, see: JavaScript, Vue, React, Angular.
Take effect and verify
After modifying editorAttrs, save and refresh the page for the changes to take effect. When only the frontend configuration is changed, there is no need to restart OfficeServer.
- Vue / React (Vite): hot reload usually applies the changes automatically. If the editor does not reload, refresh the page first; if that still does not work, run
npm run dev. - Angular: if the changes do not take effect, run
ng serve.
After making the changes, open a document of a licensed product and check whether the red trial notice is gone. For a suite license, open one document each in Word, Excel, Presentation, and PDF to verify.
Create Scatter Charts in Excel with JavaScript in React
In everyday data analysis, a scatter chart is an intuitive tool for examining the relationship between two numeric variables — for example, exploring the correlation between product price and sales, or income and spending. With a scatter chart, you can quickly spot how data points are distributed and any potential relationships. Spire.XLS for JavaScript creates scatter charts directly in the browser based on WebAssembly, and manages input/output files through a virtual file system (VFS), with no backend service required.
This article covers two core features:
For installation and project configuration, refer to Integrating Spire.XLS for JavaScript in a React Project. The examples below assume Spire.XLS is installed and the WebAssembly module is initialized.
Create a Basic Scatter Chart
A scatter chart places two sets of numeric values on the horizontal and vertical axes, using the position of each point to show how the two variables correspond. Compared with reading a table, it makes clusters, gaps and upward or downward relationships easier to see. Mapping the source data onto the chart and fixing its position on the worksheet is all it takes to start examining that relationship.
Creating a basic scatter chart:
| Syntax | Result |
|---|---|
workbook.LoadFromFile(...) |
Loads the workbook that contains the source data |
sheet.Charts.Add({ chartType: xlsModule.ExcelChartType.ScatterMarkers }) |
Adds a scatter chart with data markers to the worksheet |
chart.DataRange = sheet.Range.get("B2:B13") |
Sets the data range used by the chart |
chart.Series.get(0).CategoryLabels = sheet.Range.get("A2:A13") |
Uses column A for the horizontal axis |
chart.Series.get(0).Values = sheet.Range.get("B2:B13") |
Uses column B for the vertical axis |
chart.LeftColumn / TopRow / RightColumn / BottomRow |
Positions the chart on the worksheet |
chart.ChartTitle, PrimaryCategoryAxis.Title, PrimaryValueAxis.Title |
Sets the chart title and the axis titles |
workbook.SaveToFile(...) |
Saves the workbook with the scatter chart to the VFS |
The steps are:
- Load the font file and the source data file into the VFS.
- Create a
Workbookobject, load the Excel document withWorkbook.LoadFromFile(), and get the first worksheet withWorkbook.Worksheets.get(0). - Use the
Worksheets.Charts.Add()method with theScatterMarkerschart type to add a scatter chart. - Set the chart's
DataRangeandSeriesDataFromRange, and specify the horizontal and vertical axis data withSeries.get(0).CategoryLabelsandSeries.get(0).Values. - Set the chart position with the
LeftColumn,TopRow,RightColumnandBottomRowproperties. - Set the chart title with the
ChartTitleproperty, and set the X-axis and Y-axis titles with thePrimaryCategoryAxis.TitleandPrimaryValueAxis.Titleproperties. - Use the
Workbook.SaveToFile()method to save the document, then release resources withDispose().
Here is a complete code example showing how to create a basic scatter chart in React:
function App() {
  const createScatterChart = async () => {
    // Get the Spire.XLS WASM module
    const xlsModule = window.wasmModule?.spirexls;

    // Check whether the module is ready
    if (!xlsModule) {
      alert('Spire.Xls is not ready yet');
      return;
    }

    // Load the font and Excel file into the VFS
    await window.spire.FetchFileToVFS('ARIAL.TTF', '/Library/Fonts/', `${process.env.PUBLIC_URL}/font/`);
    const inputFileName = 'ScatterChartData.xlsx';
    await window.spire.FetchFileToVFS(inputFileName, '', `${process.env.PUBLIC_URL}data/`);

    // Load the workbook
    const workbook = new xlsModule.Workbook();
    workbook.LoadFromFile({ fileName: inputFileName });

    // Get the first worksheet
    const sheet = workbook.Worksheets.get(0);

    // Add a scatter chart with data markers
    let chart = sheet.Charts.Add({ chartType: xlsModule.ExcelChartType.ScatterMarkers });

    // Set the chart's data range
    chart.DataRange = sheet.Range.get("B2:B13");
    chart.SeriesDataFromRange = false;

    // Set the series data: column A for the X-axis and column B for the Y-axis
    chart.Series.get(0).CategoryLabels = sheet.Range.get("A2:A13");
    chart.Series.get(0).Values = sheet.Range.get("B2:B13");

    // Set the position of the chart
    chart.LeftColumn = 1;
    chart.TopRow = 15;
    chart.RightColumn = 10;
    chart.BottomRow = 32;

    // Set the chart title
    chart.ChartTitle = "Scatter Chart";

    // Set the X-axis and Y-axis titles
    chart.PrimaryCategoryAxis.Title = "Car Price";
    chart.PrimaryValueAxis.Title = "Salary";

    // Save the document
    const outputFileName = 'CreateScatterChart_output.xlsx';
    workbook.SaveToFile({ fileName: outputFileName });

    // Release resources
    workbook.Dispose();

    // Read the converted file from the VFS and trigger a download
    const fileArray = window.dotnetRuntime.Module.FS.readFile(outputFileName);
    const blob = new Blob([fileArray], { type: 'application/vnd.openxmlformats-officedocument.spreadsheetml.sheet' });
    const url = URL.createObjectURL(blob);
    const a = document.createElement('a');
    a.href = url;
    a.download = outputFileName;
    a.click();
    URL.revokeObjectURL(url);
  };

  return (
    <div style={{ textAlign: 'center', height: '300px' }}>
      <h1>Create Scatter Chart</h1>
      <button onClick={createScatterChart}>
        Start
      </button>
    </div>
  );
}

export default App;
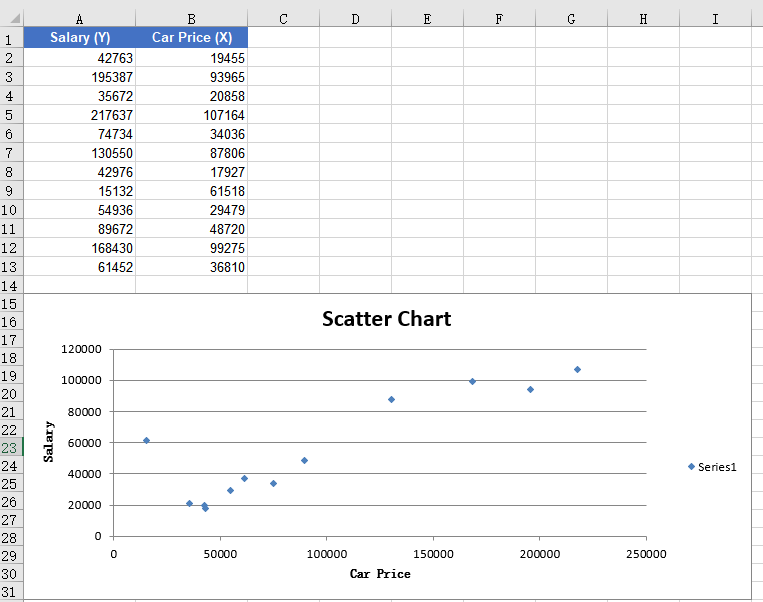
The chart after creating a basic scatter chart:
Add a Trend Line to the Scatter Chart
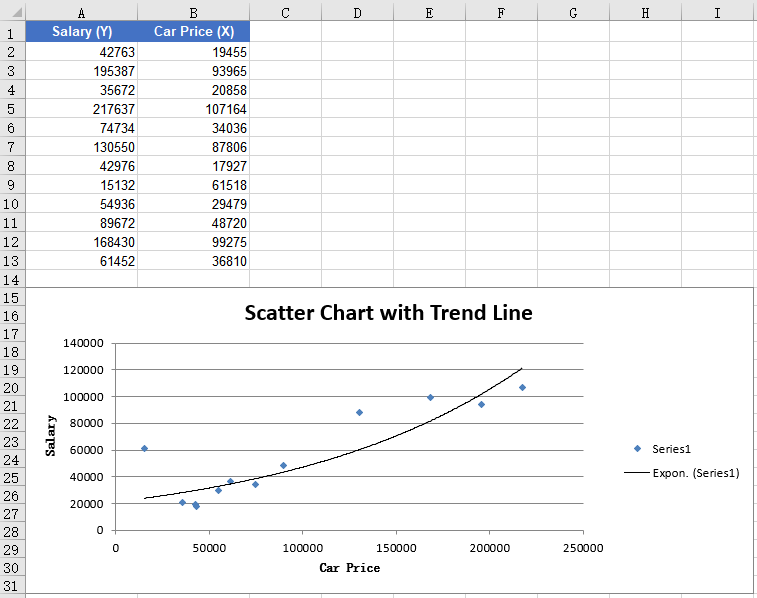
A trend line adds a fitted curve on top of the scatter points to summarize the overall direction of the data. The more scattered the points are, the more useful the trend line becomes for judging whether the variables rise, fall or stay roughly flat together. Adding an exponential trend line to the chart's data series records that trend in the workbook.
Adding a trend line to the scatter chart:
| Syntax | Result |
|---|---|
sheet.Charts.Add({ chartType: xlsModule.ExcelChartType.ScatterMarkers }) |
Adds a scatter chart with data markers |
chart.Series.get(0).TrendLines.Add({ type: xlsModule.TrendLineType.Exponential }) |
Adds an exponential trend line to the first series |
workbook.SaveToFile(...) |
Saves the workbook with the trend line to the VFS |
The steps are:
- Load the font file and the source data file into the VFS.
- Create a
Workbookobject, load the Excel document withLoadFromFile(), and get the first worksheet withWorkbook.Worksheets.get(0). - Use the
Worksheets.Charts.Add()method to add a scatter chart, and setDataRange,CategoryLabelsandValues. - Set the chart title with the
ChartTitleproperty, and set the X-axis and Y-axis titles with the axis title properties. - Use the
Series.get(0).TrendLines.Add()method to add an exponential trend line to the first data series. - Use the
Workbook.SaveToFile()method to save the document, then release resources withDispose().
Here is a complete code example showing how to add an exponential trend line to a scatter chart in React:
function App() {
  const addTrendLine = async () => {
    // Get the Spire.XLS WASM module
    const xlsModule = window.wasmModule?.spirexls;

    // Check whether the module is ready
    if (!xlsModule) {
      alert('Spire.Xls is not ready yet');
      return;
    }

    // Load the font and Excel file into the VFS
    await window.spire.FetchFileToVFS('ARIAL.TTF', '/Library/Fonts/', `${process.env.PUBLIC_URL}/font/`);
    const inputFileName = 'ScatterChartData.xlsx';
    await window.spire.FetchFileToVFS(inputFileName, '', `${process.env.PUBLIC_URL}data/`);

    // Load the workbook
    const workbook = new xlsModule.Workbook();
    workbook.LoadFromFile({ fileName: inputFileName });

    // Get the first worksheet
    const sheet = workbook.Worksheets.get(0);

    // Add a scatter chart
    let chart = sheet.Charts.Add({ chartType: xlsModule.ExcelChartType.ScatterMarkers });
    chart.DataRange = sheet.Range.get("B2:B13");
    chart.SeriesDataFromRange = false;
    chart.Series.get(0).CategoryLabels = sheet.Range.get("A2:A13");
    chart.Series.get(0).Values = sheet.Range.get("B2:B13");

    // Set the position of the chart
    chart.LeftColumn = 1;
    chart.TopRow = 15;
    chart.RightColumn = 10;
    chart.BottomRow = 32;

    // Set the chart title
    chart.ChartTitle = "Scatter Chart with Trend Line";

    // Set the X-axis and Y-axis titles
    chart.PrimaryCategoryAxis.Title = "Car Price";
    chart.PrimaryValueAxis.Title = "Salary";

    // Add an exponential trend line to the first data series
    chart.Series.get(0).TrendLines.Add({ type: xlsModule.TrendLineType.Exponential });

    // Save the document
    const outputFileName = 'ScatterChartTrendLine_output.xlsx';
    workbook.SaveToFile({ fileName: outputFileName });

    // Release resources
    workbook.Dispose();

    // Read the converted file from the VFS and trigger a download
    const fileArray = window.dotnetRuntime.Module.FS.readFile(outputFileName);
    const blob = new Blob([fileArray], { type: 'application/vnd.openxmlformats-officedocument.spreadsheetml.sheet' });
    const url = URL.createObjectURL(blob);
    const a = document.createElement('a');
    a.href = url;
    a.download = outputFileName;
    a.click();
    URL.revokeObjectURL(url);
  };

  return (
    <div style={{ textAlign: 'center', height: '300px' }}>
      <h1>Add Trend Line to Scatter Chart</h1>
      <button onClick={addTrendLine}>
        Start
      </button>
    </div>
  );
}

export default App;
The scatter chart after adding a trend line:
FAQ
Data points are all clustered at the bottom-left of the axes
Cause: The data range set for the chart includes the header row or empty cells. These non-numeric contents are treated as zero or ignored, so all data points cluster at the bottom-left of the axes.
Solution: Make sure the chart data range starts from the data rows (for example sheet.Range.get("A2:A13")), and that CategoryLabels and Values point to the same row range so the X and Y values correspond one-to-one.
Adding an exponential trend line fails
Cause: An exponential trend line requires all data values to be positive. When the data contains zero or negative values, the exponential regression fit cannot be completed, and the trend line may fail to be added or may not be displayed.
Solution: Check whether the data contains zero or negative values. If necessary, use a trend line type that fits the current data, such as linear (Linear) or polynomial (Polynomial).
How do the horizontal and vertical axis values correspond?
Cause: A scatter chart takes the horizontal axis from CategoryLabels and the vertical axis from Values. If the two ranges cover different rows or start at different rows, the points are paired incorrectly and may even fall outside the plot area.
Solution: Point CategoryLabels and Values at the same row range, for example rows 2 through 13, and change only the column. Each horizontal value then has a matching vertical value.
Obtain a Free License
Spire.XLS for JavaScript offers a 30-day full-featured free trial license with no functional limitations. Apply here to evaluate before purchasing.
Add Headers and Footers to Excel with JavaScript in React
The header and footer in Excel are text or images placed at the top and bottom of every printed page. The text or images in the header and footer can display basic information about the page or document, such as the file name, company logo, page number, date and time. Spire.XLS for JavaScript completes this directly in the browser based on WebAssembly, managing input/output files through a virtual file system (VFS), with no backend service required.
The PageSetup class provided by Spire.XLS for JavaScript can configure the page of an Excel workbook, including setting the header and footer. The LeftHeader, CenterHeader, RightHeader, LeftFooter, CenterFooter, RightFooter properties in this class add content to the left, center and right of the header or footer. To add fields to the header or footer or to set the text format of the header and footer, you can use the format codes listed in the table below.
| Code | Description |
|---|---|
&P |
Current page number |
&N |
Total number of pages |
&D |
Current date |
&T |
Current time |
&G |
Picture |
&A |
The worksheet name |
&F |
The file name |
&B |
Bold text |
&I |
Italic text |
&U |
Underline text |
&"Font Name" |
The font name, e.g. &"Arial" |
& + Integer |
The font size, e.g. &12 |
&K + 16-digit color code |
The font color, e.g. &KFF0000 |
This article introduces two core features:
For installation and project configuration, refer to Integrating Spire.XLS for JavaScript in a React Project. The examples below assume Spire.XLS is installed and the WebAssembly module is initialized.
Add an Image and Formatted Text to the Header
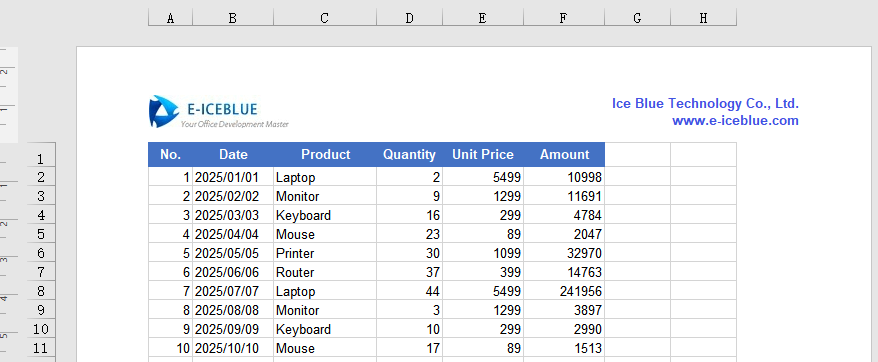
The header sits at the top of every page and is a natural place for a company logo, a document name or other fixed information. Putting the image on the left and text with its own font and color on the right gives every printed or previewed page the same identification without adding it page by page.
Adding an image and formatted text to the header:
| Syntax | Result |
|---|---|
new xlsModule.Stream(imgFileName) |
Reads the image stream from the VFS |
sheet.PageSetup.LeftHeaderImage = image |
Sets the image as the left header image |
sheet.PageSetup.LeftHeader = "&G" |
Displays the image in the left header |
sheet.PageSetup.RightHeader = "&\"Arial\"&B&10&K4253E2..." |
Writes text with the specified font, bold, size and color in the right header |
sheet.ViewMode = xlsModule.ViewMode.Layout |
Switches to Page Layout view for previewing |
workbook.SaveToFile(...) |
Saves the workbook with the header to the VFS |
The steps are:
- Load the font, Excel file and image into the VFS.
- Create a
Workbookobject, load the Excel file withLoadFromFile(), and get the first worksheet withWorkbook.Worksheets.get(0). - Use
Streamto load the image, and set it as the image source of the left header through thePageSetup.LeftHeaderImageproperty. - Use the
PageSetup.LeftHeaderproperty to display the image in the left header. - Use the
PageSetup.RightHeaderproperty to insert formatted text in the right header. - Switch the worksheet to Page Layout view with
ViewMode.Layoutto preview the header. - Use the
Workbook.SaveToFile()method to save the workbook, then release resources withWorkbook.Dispose().
Here is a complete code example showing how to add an image and formatted text to the header of a worksheet in React:
function App() {
  const addImageAndTextToHeader = async () => {
    // Get the Spire.XLS WASM module
    const xlsModule = window.wasmModule?.spirexls;

    // Check whether the module is ready
    if (!xlsModule) {
      alert('Spire.Xls is not ready yet');
      return;
    }

    // Load the font, Excel file and image into the VFS
    await window.spire.FetchFileToVFS('ARIAL.TTF', '/Library/Fonts/', `${process.env.PUBLIC_URL}/font/`);
    const inputFileName = 'HeaderFooter.xlsx';
    await window.spire.FetchFileToVFS(inputFileName, '', `${process.env.PUBLIC_URL}data/`);
    const imgFileName = 'logo.png';
    await window.spire.FetchFileToVFS(imgFileName, '', `${process.env.PUBLIC_URL}data/`);

    // Load the workbook
    const workbook = new xlsModule.Workbook();
    workbook.LoadFromFile({ fileName: inputFileName });

    // Get the first worksheet
    const sheet = workbook.Worksheets.get(0);

    // Load the image and set it as the image source of the left header
    const image = new xlsModule.Stream(imgFileName);
    sheet.PageSetup.LeftHeaderImage = image;
    sheet.PageSetup.LeftHeader = "&G";

    // Add formatted text to the right header
    sheet.PageSetup.RightHeader = "&\"Arial\"&B&10&K4253E2Ice Blue Technology Co., Ltd.  \n www.e-iceblue.com";

    // Switch to Page Layout view to preview the header and footer
    sheet.ViewMode = xlsModule.ViewMode.Layout;

    // Save the document
    const outputFileName = 'HeaderImageAndText_output.xlsx';
    workbook.SaveToFile({ fileName: outputFileName, version: xlsModule.ExcelVersion.Version2010 });

    // Release resources
    workbook.Dispose();

    // Read the converted file from the VFS and trigger a download
    const fileArray = window.dotnetRuntime.Module.FS.readFile(outputFileName);
    const blob = new Blob([fileArray], { type: 'application/vnd.openxmlformats-officedocument.spreadsheetml.sheet' });
    const url = URL.createObjectURL(blob);
    const a = document.createElement('a');
    a.href = url;
    a.download = outputFileName;
    a.click();
    URL.revokeObjectURL(url);
  };

  return (
    <div style={{ textAlign: 'center', height: '300px' }}>
      <h1>Add Image and Formatted Text to Header</h1>
      <button onClick={addImageAndTextToHeader}>
        Start
      </button>
    </div>
  );
}

export default App;
The worksheet after adding an image and formatted text to the header:
Add the Current Date and Page Number to the Footer
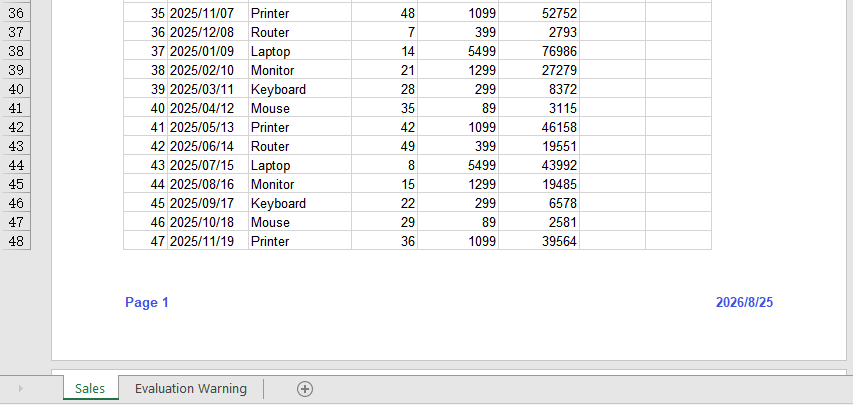
The footer sits at the bottom of every page and is commonly used for page numbers and dates. Both update automatically as pages are printed, so there is no need to maintain them in the sheet body; placing them on the left and right also helps readers find their position when paging through a report.
Adding the current date and page number to the footer:
| Syntax | Result |
|---|---|
sheet.PageSetup.LeftFooter = "...&P..." |
Shows the current page number in the left footer |
sheet.PageSetup.RightFooter = "...&D" |
Shows the current date in the right footer |
sheet.ViewMode = xlsModule.ViewMode.Layout |
Switches to Page Layout view for previewing |
workbook.SaveToFile(...) |
Saves the workbook with the footer to the VFS |
The steps are:
- Load the font and Excel file into the VFS.
- Create a
Workbookobject, load the Excel file withLoadFromFile(), and get the first worksheet withWorkbook.Worksheets.get(0). - Use the
PageSetup.LeftFooterproperty to add a formatted page number to the left footer, customizing its format as you like. - Use the
PageSetup.RightFooterproperty to add the current date to the right footer, and change the appearance of the date text as needed. - Switch the worksheet to Page Layout view with
ViewMode.Layoutto preview the footer. - Use the
Workbook.SaveToFile()method to save the workbook, then release resources withWorkbook.Dispose().
Here is a complete code example showing how to add the current date and page number to the footer of a worksheet in React:
function App() {
  const addDateAndPageNumberToFooter = async () => {
    // Get the Spire.XLS WASM module
    const xlsModule = window.wasmModule?.spirexls;

    // Check whether the module is ready
    if (!xlsModule) {
      alert('Spire.Xls is not ready yet');
      return;
    }

    // Load the font and Excel file into the VFS
    await window.spire.FetchFileToVFS('ARIAL.TTF', '/Library/Fonts/', `${process.env.PUBLIC_URL}/font/`);
    const inputFileName = 'HeaderFooter.xlsx';
    await window.spire.FetchFileToVFS(inputFileName, '', `${process.env.PUBLIC_URL}data/`);

    // Load the workbook
    const workbook = new xlsModule.Workbook();
    workbook.LoadFromFile({ fileName: inputFileName });

    // Get the first worksheet
    const sheet = workbook.Worksheets.get(0);

    // Add the page number to the left footer; &P represents the current page number
    sheet.PageSetup.LeftFooter = "&\"Arial\"&B&10&K4253E2Page &P";

    // Add the current date to the right footer; &D represents the current date
    sheet.PageSetup.RightFooter = "&\"Arial\"&B&10&K4253E2&D";

    // Switch to Page Layout view to preview the header and footer
    sheet.ViewMode = xlsModule.ViewMode.Layout;

    // Save the document
    const outputFileName = 'FooterDatePageNumber_output.xlsx';
    workbook.SaveToFile({ fileName: outputFileName, version: xlsModule.ExcelVersion.Version2010 });

    // Release resources
    workbook.Dispose();

    // Read the converted file from the VFS and trigger a download
    const fileArray = window.dotnetRuntime.Module.FS.readFile(outputFileName);
    const blob = new Blob([fileArray], { type: 'application/vnd.openxmlformats-officedocument.spreadsheetml.sheet' });
    const url = URL.createObjectURL(blob);
    const a = document.createElement('a');
    a.href = url;
    a.download = outputFileName;
    a.click();
    URL.revokeObjectURL(url);
  };

  return (
    <div style={{ textAlign: 'center', height: '300px' }}>
      <h1>Add Current Date and Page Number to Footer</h1>
      <button onClick={addDateAndPageNumberToFooter}>
        Start
      </button>
    </div>
  );
}

export default App;
The worksheet after adding the current date and page number to the footer:
FAQ
Headers and footers are not visible in Excel
Cause: An Excel worksheet is in Normal view by default, and headers and footers are only displayed in Page Layout view or when printing.
Solution: Switch the worksheet to Page Layout view in code with sheet.ViewMode = xlsModule.ViewMode.Layout;, or switch to the "Page Layout" view manually in Excel.
The picture in the header is not displayed
Cause: Only the image source (such as LeftHeaderImage) was set, but the &G placeholder was not used in the corresponding header text, or the image file was not loaded into the VFS correctly.
Solution: Make sure the image has been loaded into the VFS with FetchFileToVFS() and add &G to the header string, for example sheet.PageSetup.LeftHeader = "&G";.
How can the current page number and total page count appear together?
Cause: The footer used only the &P field, so it shows the current page number without any information about the total number of pages.
Solution: Put both &P and &N in the footer string, for example sheet.PageSetup.LeftFooter = "&P / &N";. When printing or previewing, the two fields are replaced with the current page number and the total page count respectively.
Obtain a Free License
Spire.XLS for JavaScript offers a 30-day full-featured free trial license with no functional limitations. Apply here to evaluate before purchasing.
Add and Remove Watermarks in Excel with JavaScript in React
Excel does not have a built-in watermark feature, but in scenarios such as contracts, reports, and internal documents, we often need to mark files with identifiers like "Confidential" or "Sample" to prevent information from being copied and distributed at will. Spire.XLS for JavaScript processes Excel documents directly in the browser based on WebAssembly, and manages input and output files through a virtual file system (VFS), with no backend service required. With the header image feature, you can easily add and remove watermarks in worksheets.
This article covers two core features:
For installation and project configuration, refer to Integrating Spire.XLS for JavaScript in a React Project. The examples below assume Spire.XLS is installed and the WebAssembly module is initialized.
Add a Watermark to an Excel Worksheet
Excel does not have a built-in watermark feature, yet contracts, reports and internal documents often need to mark their origin or scope of use. A watermark lays pale text across the center of the page, leaving the body readable while signaling what the document is for. Drawing the watermark as an image the size of the page and placing it in the header makes it appear on every page.
Adding a watermark to an Excel worksheet:
| Syntax | Result |
|---|---|
sheet.PageSetup.PageWidth / PageHeight |
Gets the page size used to draw a matching watermark image |
watermarkCanvas.toBlob(...) and FS.writeFile(...) |
Creates the watermark image and writes it to the VFS |
new xlsModule.Stream(imgFileName) |
Reads the watermark image stream from the VFS |
sheet.PageSetup.LeftHeaderImage = watermark |
Sets the watermark image as the left header image |
sheet.PageSetup.LeftHeader = "&G" |
Displays the image in the header |
sheet.ViewMode = xlsModule.ViewMode.Layout |
Switches to Page Layout view for previewing |
workbook.SaveToFile(...) |
Saves the watermarked workbook to the VFS |
The steps are:
- Load the font file and the input file into the VFS.
- Create a
Workbookobject, load the Excel document withLoadFromFile(), and get the first worksheet withWorkbook.Worksheets.get(0). - Use the Canvas API to draw a watermark image that matches the page size: a white background with centered LightCoral text rotated -45°.
- Save the watermark image to the virtual file system (VFS) and load it with a
Streamobject. - Set the watermark image as the left header image (
LeftHeaderImage) and set the header text to the image placeholder&G. - Switch the worksheet to Page Layout view with
ViewMode.Layoutto preview the watermark effect. - Use the
Workbook.SaveToFile()method to save the document, then release resources withWorkbook.Dispose().
Here is a complete code example showing how to add a watermark to a worksheet in React:
function App() {
  const addWatermark = async () => {
    // Get the Spire.XLS WASM module
    const xlsModule = window.wasmModule?.spirexls;

    // Check whether the module is ready
    if (!xlsModule) {
      alert('Spire.Xls is not ready yet');
      return;
    }

    // Load the font and the Excel file into the VFS
    await window.spire.FetchFileToVFS('ARIAL.TTF', '/Library/Fonts/', `${process.env.PUBLIC_URL}/font/`);
    const inputFileName = 'Watermark.xlsx';
    await window.spire.FetchFileToVFS(inputFileName, '', `${process.env.PUBLIC_URL}data/`);

    // Load the workbook
    const workbook = new xlsModule.Workbook();
    workbook.LoadFromFile({ fileName: inputFileName });

    // Get the first worksheet
    const sheet = workbook.Worksheets.get(0);

    // Define the watermark text, text color, and background color
    const watermarkText = 'Internal Use';
    const textColor = 'lightcoral';
    const backColor = 'white';

    // Draw the watermark image according to the page size (white background with centered text rotated -45°)
    const drawWatermarkImage = (text, color, bg, width, height) => {
      const canvas = document.createElement('canvas');
      canvas.width = width;
      canvas.height = height;
      const ctx = canvas.getContext('2d');
      // Draw the background
      ctx.fillStyle = bg;
      ctx.fillRect(0, 0, width, height);
      // Set the text style and draw the rotated text at the center of the page
      ctx.fillStyle = color;
      ctx.font = 'bold 48px Arial';
      ctx.textAlign = 'center';
      ctx.textBaseline = 'middle';
      ctx.save();
      ctx.translate(width / 2, height / 2);
      ctx.rotate(-Math.PI / 4);
      ctx.fillText(text, 0, 0);
      ctx.restore();
      return canvas;
    };

    // Draw the watermark image and write it to the virtual file system (VFS)
    const watermarkCanvas = drawWatermarkImage(watermarkText, textColor, backColor, sheet.PageSetup.PageWidth, sheet.PageSetup.PageHeight);
    const watermarkBlob = await new Promise((resolve) => watermarkCanvas.toBlob(resolve, 'image/png'));
    const watermarkBytes = new Uint8Array(await watermarkBlob.arrayBuffer());
    const imgFileName = 'Watermark.png';
    window.dotnetRuntime.Module.FS.writeFile(imgFileName, watermarkBytes);

    // Load the watermark image
    const watermark = new xlsModule.Stream(imgFileName);

    // Set the watermark image as the left header image and display it with the &G placeholder
    sheet.PageSetup.LeftHeaderImage = watermark;
    sheet.PageSetup.LeftHeader = "&G";

    // Switch to Page Layout view to preview the watermark effect
    sheet.ViewMode = xlsModule.ViewMode.Layout;

    // Save the document
    const outputFileName = 'AddWatermark_output.xlsx';
    workbook.SaveToFile({ fileName: outputFileName, version: xlsModule.ExcelVersion.Version2010 });

    // Release resources
    workbook.Dispose();

    // Read the converted file from the VFS and trigger a download
    const fileArray = window.dotnetRuntime.Module.FS.readFile(outputFileName);
    const blob = new Blob([fileArray], { type: 'application/vnd.openxmlformats-officedocument.spreadsheetml.sheet' });
    const url = URL.createObjectURL(blob);
    const a = document.createElement('a');
    a.href = url;
    a.download = outputFileName;
    a.click();
    URL.revokeObjectURL(url);
  };

  return (
    <div style={{ textAlign: 'center', height: '300px' }}>
      <h1>Add Watermark to Excel</h1>
      <button onClick={addWatermark}>
        Start
      </button>
    </div>
  );
}

export default App;
The worksheet after adding a watermark:

Remove a Watermark from an Excel Worksheet
Because the watermark is carried by the header, removing it means clearing the reference in that header. Once the header text is empty, the image is no longer displayed and the body of the worksheet stays as it is.
Removing a watermark from an Excel worksheet:
| Syntax | Result |
|---|---|
workbook.LoadFromFile(...) |
Loads the watermarked workbook |
workbook.Worksheets.get(0) |
Gets the first worksheet to process |
sheet.PageSetup.LeftHeader = "" |
Clears the left header text and the image placeholder |
workbook.SaveToFile(...) |
Saves the workbook without the watermark to the VFS |
The steps are:
- Load the watermarked Excel file into the VFS.
- Create a
Workbookobject, load the document withLoadFromFile(), and get the first worksheet withWorkbook.Worksheets.get(0). - Set
PageSetup.LeftHeaderto an empty string to remove the watermark image placeholder from the header. - Use the
Workbook.SaveToFile()method to save the document, then release resources withWorkbook.Dispose().
Here is a complete code example showing how to remove a watermark from a worksheet in React:
function App() {
  const removeWatermark = async () => {
    // Get the Spire.XLS WASM module
    const xlsModule = window.wasmModule?.spirexls;

    // Check whether the module is ready
    if (!xlsModule) {
      alert('Spire.Xls is not ready yet');
      return;
    }

    // Load the watermarked Excel file into the VFS
    const inputFileName = 'AddWatermark.xlsx';
    await window.spire.FetchFileToVFS(inputFileName, '', `${process.env.PUBLIC_URL}data/`);

    // Load the workbook
    const workbook = new xlsModule.Workbook();
    workbook.LoadFromFile({ fileName: inputFileName });

    // Get the first worksheet
    const sheet = workbook.Worksheets.get(0);

    // Clear the left header text to remove the watermark
    sheet.PageSetup.LeftHeader = "";

    // Save the document
    const outputFileName = 'RemoveWatermark_output.xlsx';
    workbook.SaveToFile({ fileName: outputFileName, version: xlsModule.ExcelVersion.Version2010 });

    // Release resources
    workbook.Dispose();

    // Read the converted file from the VFS and trigger a download
    const fileArray = window.dotnetRuntime.Module.FS.readFile(outputFileName);
    const blob = new Blob([fileArray], { type: 'application/vnd.openxmlformats-officedocument.spreadsheetml.sheet' });
    const url = URL.createObjectURL(blob);
    const a = document.createElement('a');
    a.href = url;
    a.download = outputFileName;
    a.click();
    URL.revokeObjectURL(url);
  };

  return (
    <div style={{ textAlign: 'center', height: '300px' }}>
      <h1>Remove Watermark from Excel</h1>
      <button onClick={removeWatermark}>
        Start
      </button>
    </div>
  );
}

export default App;
The worksheet after removing the watermark:
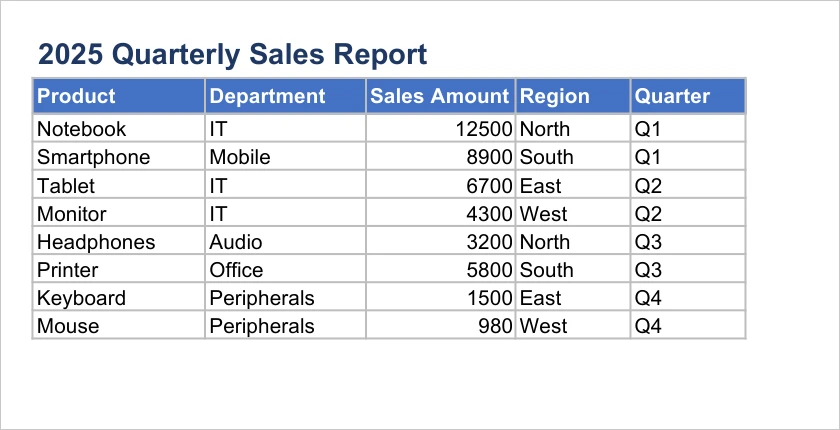
FAQ
The watermark is not visible in Normal view
Cause: A watermark implemented through a header image is only displayed in Page Layout view and print preview, and is not visible in Excel's Normal view.
Solution: Switch the worksheet view to Page Layout mode to preview the watermark, for example by setting sheet.ViewMode = xlsModule.ViewMode.Layout in the code.
The watermark position is different from expected
Cause: A header image watermark is displayed in the header area, and its horizontal position can be controlled by the left, center, and right header positions. If the position does not match expectations, it is usually because the header position set is inconsistent with the requirement.
Solution: Choose LeftHeaderImage, CenterHeaderImage, or RightHeaderImage to set the watermark image according to your needs, and set the corresponding image placeholder &G with the LeftHeader, CenterHeader, or RightHeader property.
Residual content remains in the file after removing the watermark
Cause: The watermark is implemented through a header image. If only part of the header area is cleared, other areas (such as the left or right header) may still contain the watermark image.
Solution: Make sure to clear the text of all header areas where the watermark was set, including LeftHeader, CenterHeader, and RightHeader.
Obtain a Free License
Spire.XLS for JavaScript offers a 30-day full-featured free trial license with no functional limitations. Apply here to evaluate before purchasing.