
Data (8)
The most direct way to get data into Excel is to assign one cell at a time, which means ten rows take ten loop iterations. But data usually arrives in JavaScript already in blocks -- a list from an API, a table rendered on the page, a computed result set -- and there is no reason to break an array apart just to feed it back cell by cell. The InsertArray method of Spire.XLS for JavaScript takes a whole array at once; combined with a starting row and column and a write direction, a single call drops an entire column or row of data into the worksheet. Spire.XLS for JavaScript performs these operations directly in the browser through WebAssembly, managing input and output files with a virtual file system (VFS) and requiring no backend service.
This article covers two core feature points:
- Import a one-dimensional array into a worksheet
- Import a two-dimensional data table into a worksheet
For installation and project setup, see Integrating Spire.XLS for JavaScript in a React Project. The examples below assume Spire.XLS is installed and the WebAssembly module has been initialized.
Import a one-dimensional array into a worksheet
InsertArray is split into several overloads by data type: stringArray for text, intArray for integers and doubleArray for decimals. That split is not needless fussiness -- Excel treats cells according to their data type. Numbers sit right-aligned and can take part in sums and charts directly, while a number written as text sits left-aligned and a formula referencing it only yields 0. Scores, amounts and quantities -- anything that will be used in a calculation -- belong in a numeric overload.
The remaining parameters decide where the data lands: firstRow and firstColumn give the starting position, with rows and columns both counted from 1, and isVertical picks the direction the array spreads -- false lays it along a row, true down a column. The same ['Jan', 'Feb', 'Mar'] becomes either a header row spanning A1 to C1 or a column of data running down A1 to A3. The steps are:
- Load the font into the VFS.
- Create a
Workbookand get the first worksheet withWorksheets.get(0). - Write a header row horizontally with the
stringArrayoverload ofInsertArray. - Write the name column vertically with
stringArrayand the score column withintArray. - Auto-fit the columns with
AllocatedRange.AutoFitColumns, then save the workbook withSaveToFile.
The complete code example below shows how to import a one-dimensional array into a worksheet in React:
function App() {
  const importArray = async () => {
    // Get the Spire.XLS WASM module
    const xlsModule = window.wasmModule?.spirexls;

    // Check if the module is ready
    if (!xlsModule) {
      alert('Spire.Xls is not ready yet');
      return;
    }

    // Load the font into the VFS
    await window.spire.FetchFileToVFS('ARIAL.TTF', '/Library/Fonts/', `${process.env.PUBLIC_URL}/font/`);

    // Create a new workbook and get the first worksheet
    const workbook = new xlsModule.Workbook();
    const sheet = workbook.Worksheets.get(0);

    // Write a header row horizontally: isVertical false spreads the array across A1:B1
    sheet.InsertArray({
      stringArray: ['Name', 'Score'],
      firstRow: 1,
      firstColumn: 1,
      isVertical: false,
    });

    // Write the name column vertically: isVertical true spreads the array down A2:A4
    sheet.InsertArray({
      stringArray: ['Alice', 'Bob', 'Carol'],
      firstRow: 2,
      firstColumn: 1,
      isVertical: true,
    });

    // Write the score column: numbers go through the intArray overload, so the cells hold
    // numbers rather than text
    sheet.InsertArray({
      intArray: [92, 85, 78],
      firstRow: 2,
      firstColumn: 2,
      isVertical: true,
    });

    // Auto-fit the columns to their content
    sheet.AllocatedRange.AutoFitColumns();

    // Save the workbook
    const outputFileName = 'ImportArray.xlsx';
    workbook.SaveToFile({ fileName: outputFileName });

    // Dispose of the workbook object to release resources
    workbook.Dispose();

    // Read the result file from the VFS and trigger the download
    const fileArray = window.dotnetRuntime.Module.FS.readFile(outputFileName);
    const blob = new Blob([fileArray], { type: 'application/vnd.openxmlformats-officedocument.spreadsheetml.sheet' });
    const url = URL.createObjectURL(blob);
    const a = document.createElement('a');
    a.href = url;
    a.download = outputFileName;
    a.click();
    URL.revokeObjectURL(url);
  };

  return (
    <div style={{ textAlign: 'center', height: '300px' }}>
      <h1>Import 1-D Array</h1>
      <button onClick={importArray}>Start</button>
    </div>
  );
}

export default App;
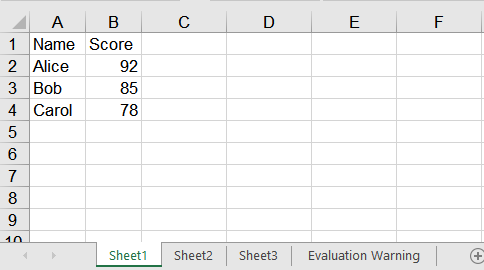
After running, the effect of importing a one-dimensional array into a worksheet:
Import a two-dimensional data table into a worksheet
A data table is naturally a two-dimensional array -- a header row first, then one record per row, as in [['Name', 'Subject', 'Score'], ['Alice', 'Math', 92]]. Importing a two-dimensional data table into Excel means splitting it by column and writing each column as a one-dimensional array on its own: write the header across one row, then write the body column by column, text columns with stringArray and numeric ones with intArray. A column holds a single data type throughout, so each call only has to pick one form. When the data arrives in batches, read LastRow to find the last row currently in use and write the next batch from the row after it. The steps are:
- Load the font into the VFS.
- Create a
Workbookand get the first worksheet withWorksheets.get(0). - Write the header across the first row with the
stringArrayoverload ofInsertArray. - Split the body by column and write each one vertically with
stringArrayorintArray. - When a second batch arrives, locate its starting row with
LastRowand write the columns the same way. - Auto-fit the columns with
AllocatedRange.AutoFitColumns, then save the workbook withSaveToFile.
The complete code example below shows how to import a two-dimensional data table into a worksheet in React:
function App() {
  const importDataTable = async () => {
    // Get the Spire.XLS WASM module
    const xlsModule = window.wasmModule?.spirexls;

    // Check if the module is ready
    if (!xlsModule) {
      alert('Spire.Xls is not ready yet');
      return;
    }

    // Load the font into the VFS
    await window.spire.FetchFileToVFS('ARIAL.TTF', '/Library/Fonts/', `${process.env.PUBLIC_URL}/font/`);

    // The two-dimensional data to import, with the header as its first row
    const rows = [
      ['Name', 'Subject', 'Score'],
      ['Alice', 'Math', 92],
      ['Bob', 'Chinese', 85],
    ];

    // Create a new workbook and get the first worksheet
    const workbook = new xlsModule.Workbook();
    const sheet = workbook.Worksheets.get(0);

    // Write one column: text columns go through stringArray, numeric ones through intArray
    const writeColumn = (values, firstRow, firstColumn) => {
      const isNumeric = values.every((value) => typeof value === 'number');
      if (isNumeric) {
        sheet.InsertArray({ intArray: values, firstRow, firstColumn, isVertical: true });
      } else {
        sheet.InsertArray({ stringArray: values, firstRow, firstColumn, isVertical: true });
      }
    };

    // Write the header across the first row
    sheet.InsertArray({
      stringArray: rows[0],
      firstRow: 1,
      firstColumn: 1,
      isVertical: false,
    });

    // Split the body by column and write each one vertically, starting at row 2
    const body = rows.slice(1);
    for (let column = 0; column < rows[0].length; column++) {
      writeColumn(body.map((row) => row[column]), 2, column + 1);
    }

    // A second batch arrives: use LastRow to find where the existing data ends
    const nextBatch = [
      ['Carol', 'English', 78],
      ['Dave', 'Physics', 91],
    ];
    const startRow = sheet.LastRow + 1;
    for (let column = 0; column < rows[0].length; column++) {
      writeColumn(nextBatch.map((row) => row[column]), startRow, column + 1);
    }

    // Auto-fit the columns to their content
    sheet.AllocatedRange.AutoFitColumns();

    // Save the workbook
    const outputFileName = 'ImportDataTable.xlsx';
    workbook.SaveToFile({ fileName: outputFileName });

    // Dispose of the workbook object to release resources
    workbook.Dispose();

    // Read the result file from the VFS and trigger the download
    const fileArray = window.dotnetRuntime.Module.FS.readFile(outputFileName);
    const blob = new Blob([fileArray], { type: 'application/vnd.openxmlformats-officedocument.spreadsheetml.sheet' });
    const url = URL.createObjectURL(blob);
    const a = document.createElement('a');
    a.href = url;
    a.download = outputFileName;
    a.click();
    URL.revokeObjectURL(url);
  };

  return (
    <div style={{ textAlign: 'center', height: '300px' }}>
      <h1>Import 2-D Data Table</h1>
      <button onClick={importDataTable}>Start</button>
    </div>
  );
}

export default App;
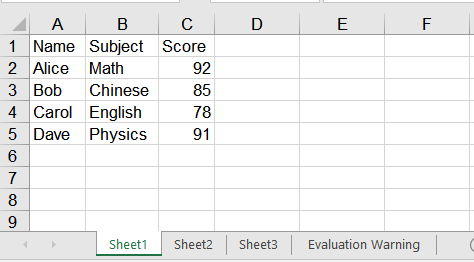
After running, the effect of importing a two-dimensional data table into a worksheet:
FAQ
How do I put a date into a cell?
Cause: dateTimeArray cannot be used to write a JavaScript Date -- it lands as 0001/1/1. Assigning cell by cell through Range.DateTimeValue does work, but it only accepts a Date object; hand it a string and it reports Value is not a Date.
Solution: For a whole column, the least fuss is to write the date as a yyyy-mm-dd string and pass it to stringArray. The saved cell holds a real date value -- reading NumberValue back gives the date serial number, such as 46037 -- and no number format has to be set:
sheet.InsertArray({
  stringArray: ['2026-01-15', '2026-02-20'],
  firstRow: 1,
  firstColumn: 1,
  isVertical: true,
});
When only one cell needs setting, assign it directly instead, taking care to pass a Date object rather than a string:
sheet.Range.get('A1').DateTimeValue = new Date(Date.UTC(2026, 0, 15));
Do empty values in the array break the write?
Cause: No. null, undefined and the empty string all write an empty cell. InsertArray places each value by its index, so what the value happens to be makes no difference: later elements do not shift, and nothing throws.
Solution: Nothing extra is needed; pass the array as it is. The line below fills A1:D1, with D still landing in the fourth column:
sheet.InsertArray({
  stringArray: ['A', null, '', 'D'],
  firstRow: 1,
  firstColumn: 1,
  isVertical: false,
});
Get a Free License
Spire.XLS for JavaScript offers a 30-day full-featured free trial license with no functional limitations. Apply here to evaluate before purchasing.
Set the Alignment, Indent, Orientation and Wrapping of Excel Cell Text in React with JavaScript
2026-09-17 05:55:07 Written by liu taliaHow readable a table is often has nothing to do with the data itself and everything to do with how the text sits inside its cells. Titles need to be centred, amounts need to be pushed right, multi-line descriptions need to be indented, a long sentence in a narrow column needs to fold, and a header set at an angle fits more information into limited column width. All of these are cell text layout settings. Spire.XLS for JavaScript performs them directly in the browser through WebAssembly, managing input and output files with a virtual file system (VFS) and requiring no backend service.
This article covers four key features:
- Set the Alignment of Text
- Set the Indent of Text
- Set the Orientation of Text
- Set the Wrapping of Text
For installation and project setup, see Integrating Spire.XLS for JavaScript in a React Project. The examples below assume Spire.XLS is already installed and the WebAssembly module has been initialized.
Set the Alignment of Text
Alignment works along two axes. Vertical alignment decides where the text sits within the height of the cell and is set through the VerticalAlignment property, which accepts Top, Center, Bottom and others. Horizontal alignment decides where the text sits within the width of the cell and is set through the HorizontalAlignment property, which accepts General, Left, Center, Right and others. The two are independent and can be combined freely. The steps are as follows:
- Create a workbook and get the first worksheet.
- Write the sample text.
- Set the vertical alignment through
VerticalAlignment. - Set the horizontal alignment through
HorizontalAlignment. - Save the workbook.
Here is a complete code example that sets the alignment of cell text in React:
function App() {
  const setTextAlignment = async () => {
    // Get the Spire.XLS WASM module
    const xlsModule = window.wasmModule?.spirexls;

    // Check if the module is ready
    if (!xlsModule) {
      alert('Spire.Xls is not ready yet');
      return;
    }

    // Load the font into VFS
    await window.spire.FetchFileToVFS('ARIAL.TTF', '/Library/Fonts/', `${process.env.PUBLIC_URL}/font/`);

    // Create a new workbook
    const workbook = new xlsModule.Workbook();

    // Get the first worksheet
    const sheet = workbook.Worksheets.get(0);

    // Write the sample text for vertical alignment
    sheet.Range.get("A1").Text = "Alignment";
    sheet.Range.get("B1").Text = "Sample";
    sheet.Range.get("A2").Text = "Vertical Top";
    sheet.Range.get("B2").Text = "VerticalAlignType.Top";
    sheet.Range.get("A3").Text = "Vertical Center";
    sheet.Range.get("B3").Text = "VerticalAlignType.Center";
    sheet.Range.get("A4").Text = "Vertical Bottom";
    sheet.Range.get("B4").Text = "VerticalAlignType.Bottom";

    // Write the sample text for horizontal alignment
    sheet.Range.get("A6").Text = "Horizontal General";
    sheet.Range.get("B6").Text = "HorizontalAlignType.General";
    sheet.Range.get("A7").Text = "Horizontal Left";
    sheet.Range.get("B7").Text = "HorizontalAlignType.Left";
    sheet.Range.get("A8").Text = "Horizontal Center";
    sheet.Range.get("B8").Text = "HorizontalAlignType.Center";
    sheet.Range.get("A9").Text = "Horizontal Right";
    sheet.Range.get("B9").Text = "HorizontalAlignType.Right";

    // Set the vertical alignment
    sheet.Range.get("B2").Style.VerticalAlignment = xlsModule.VerticalAlignType.Top;
    sheet.Range.get("B3").Style.VerticalAlignment = xlsModule.VerticalAlignType.Center;
    sheet.Range.get("B4").Style.VerticalAlignment = xlsModule.VerticalAlignType.Bottom;

    // Set the horizontal alignment
    sheet.Range.get("B6").Style.HorizontalAlignment = xlsModule.HorizontalAlignType.General;
    sheet.Range.get("B7").Style.HorizontalAlignment = xlsModule.HorizontalAlignType.Left;
    sheet.Range.get("B8").Style.HorizontalAlignment = xlsModule.HorizontalAlignType.Center;
    sheet.Range.get("B9").Style.HorizontalAlignment = xlsModule.HorizontalAlignType.Right;

    // Widen column B and raise rows 2-4 so the alignment differences are visible
    sheet.Range.get("B1:B9").ColumnWidth = 32;
    sheet.Range.get("A2:B4").RowHeight = 40;

    // Save the workbook
    const outputFileName = "TextAlignment.xlsx";
    workbook.SaveToFile(outputFileName);

    // Release resources
    workbook.Dispose();

    // Read the result file from VFS and trigger the download
    const fileArray = window.dotnetRuntime.Module.FS.readFile(outputFileName);
    const blob = new Blob([fileArray], { type: "application/vnd.openxmlformats-officedocument.spreadsheetml.sheet" });
    const url = URL.createObjectURL(blob);
    const a = document.createElement('a');
    a.href = url;
    a.download = outputFileName;
    a.click();
    URL.revokeObjectURL(url);
  };

  return (
    <div style={{ textAlign: 'center', height: '300px' }}>
      <h1>Set Text Alignment</h1>
      <button onClick={setTextAlignment}>Start</button>
    </div>
  );
}

export default App;
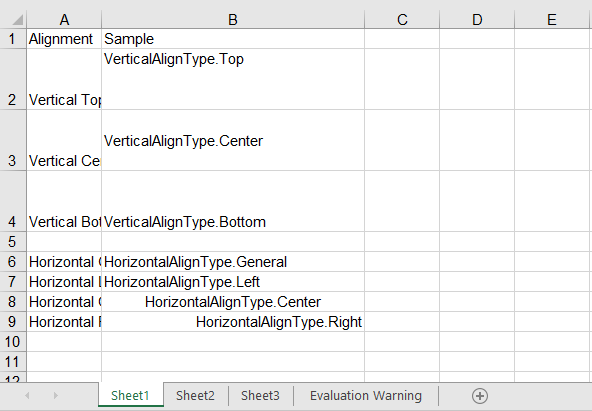
Vertical alignment is only visible once the row is tall enough, which is why the example sets rows 2-4 to a height of 40; horizontal alignment is at its clearest once the column is wide enough.
After running, the effect of setting the alignment of text:
Set the Indent of Text
Indentation leaves blank space on the left (or right) inside a cell, which suits data that has a hierarchy, such as "region → city". The indent level is set through the IndentLevel property, where one level is roughly one character wide. The steps are as follows:
- Create a workbook and get the first worksheet.
- Write the sample text.
- Set the horizontal alignment to left so the indentation takes effect.
- Set an increasing indent level through
IndentLevel. - Save the workbook.
Here is a complete code example that sets the indent of cell text in React:
function App() {
  const setTextIndent = async () => {
    // Get the Spire.XLS WASM module
    const xlsModule = window.wasmModule?.spirexls;

    // Check if the module is ready
    if (!xlsModule) {
      alert('Spire.Xls is not ready yet');
      return;
    }

    // Load the font into VFS
    await window.spire.FetchFileToVFS('ARIAL.TTF', '/Library/Fonts/', `${process.env.PUBLIC_URL}/font/`);

    // Create a new workbook
    const workbook = new xlsModule.Workbook();

    // Get the first worksheet
    const sheet = workbook.Worksheets.get(0);

    // Write the sample text
    sheet.Range.get("A1").Text = "Indent Level";
    sheet.Range.get("B1").Text = "Sample";
    sheet.Range.get("A2").Text = "0";
    sheet.Range.get("B2").Text = "Worldwide";
    sheet.Range.get("A3").Text = "1";
    sheet.Range.get("B3").Text = "North Region";
    sheet.Range.get("A4").Text = "2";
    sheet.Range.get("B4").Text = "Beijing";
    sheet.Range.get("A5").Text = "3";
    sheet.Range.get("B5").Text = "Haidian District";

    // Indentation only takes effect together with left alignment
    sheet.Range.get("B2:B5").Style.HorizontalAlignment = xlsModule.HorizontalAlignType.Left;

    // Set the indentation level of the text
    sheet.Range.get("B2").Style.IndentLevel = 0;
    sheet.Range.get("B3").Style.IndentLevel = 1;
    sheet.Range.get("B4").Style.IndentLevel = 2;
    sheet.Range.get("B5").Style.IndentLevel = 3;

    // Widen column B so the indentation differences are visible
    sheet.Range.get("B1:B5").ColumnWidth = 32;

    // Save the workbook
    const outputFileName = "Indentation.xlsx";
    workbook.SaveToFile(outputFileName);

    // Release resources
    workbook.Dispose();

    // Read the result file from VFS and trigger the download
    const fileArray = window.dotnetRuntime.Module.FS.readFile(outputFileName);
    const blob = new Blob([fileArray], { type: "application/vnd.openxmlformats-officedocument.spreadsheetml.sheet" });
    const url = URL.createObjectURL(blob);
    const a = document.createElement('a');
    a.href = url;
    a.download = outputFileName;
    a.click();
    URL.revokeObjectURL(url);
  };

  return (
    <div style={{ textAlign: 'center', height: '300px' }}>
      <h1>Set Text Indent</h1>
      <button onClick={setTextIndent}>Start</button>
    </div>
  );
}

export default App;
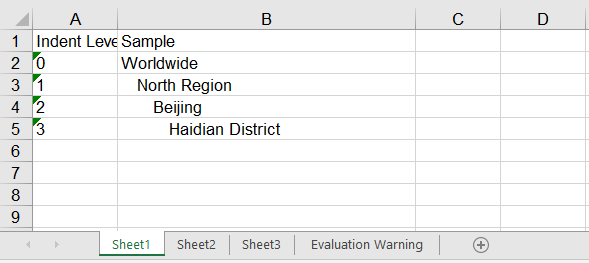
The four rows step in one level at a time, forming exactly the hierarchy "Worldwide → North Region → Beijing → Haidian District". Cell B5 has an IndentLevel of 3, so its text starts about three characters in from the left edge.
After running, the effect of setting the indent of text:
Set the Orientation of Text
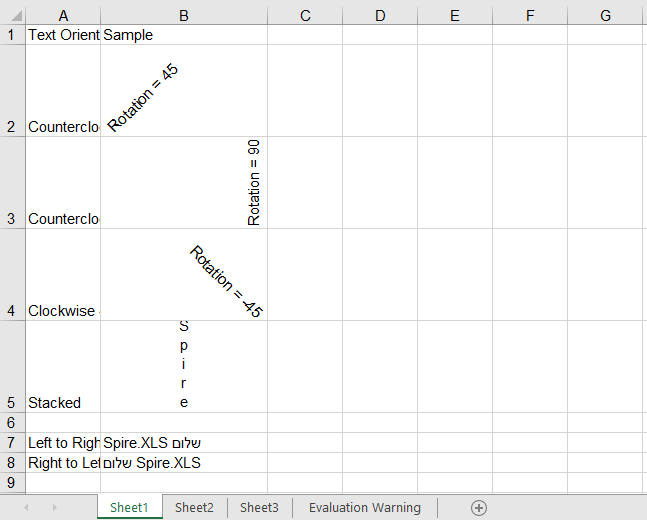
Text orientation covers two independent settings. The first is the rotation angle, set through the Rotation property, where values 0 to 90 are degrees counterclockwise and -1 to -90 are degrees clockwise. There is also the special value 255, which stacks the text vertically one character per line; rotation is often used to fit a long header into a narrow column. The second is the reading order, set through the ReadingOrder property, which accepts LeftToRight, RightToLeft and Context. It decides which direction the mixed content in a cell is laid out from, and is used for languages written from right to left such as Arabic and Hebrew. Rotated or stacked text takes up far more height than usual, so the row height has to be raised at the same time to keep the text inside the cell. The steps are as follows:
- Create a workbook and get the first worksheet.
- Write the sample text.
- Set the rotation angle through
Rotation. - Set the reading order through
ReadingOrder. - Save the workbook.
Here is a complete code example that sets the orientation of cell text in React:
function App() {
  const setTextOrientation = async () => {
    // Get the Spire.XLS WASM module
    const xlsModule = window.wasmModule?.spirexls;

    // Check if the module is ready
    if (!xlsModule) {
      alert('Spire.Xls is not ready yet');
      return;
    }

    // Load the font into VFS
    await window.spire.FetchFileToVFS('ARIAL.TTF', '/Library/Fonts/', `${process.env.PUBLIC_URL}/font/`);

    // Create a new workbook
    const workbook = new xlsModule.Workbook();

    // Get the first worksheet
    const sheet = workbook.Worksheets.get(0);

    // Write the sample text for the rotation angle
    sheet.Range.get("A1").Text = "Text Orientation";
    sheet.Range.get("B1").Text = "Sample";
    sheet.Range.get("A2").Text = "Counterclockwise 45";
    sheet.Range.get("B2").Text = "Rotation = 45";
    sheet.Range.get("A3").Text = "Counterclockwise 90";
    sheet.Range.get("B3").Text = "Rotation = 90";
    sheet.Range.get("A4").Text = "Clockwise 45";
    sheet.Range.get("B4").Text = "Rotation = -45";
    sheet.Range.get("A5").Text = "Stacked";
    sheet.Range.get("B5").Text = "Spire";

    // Write the sample text for the reading order: Latin mixed with Hebrew, so the
    // difference between the two directions is actually visible
    sheet.Range.get("A7").Text = "Left to Right";
    sheet.Range.get("B7").Text = "Spire.XLS שלום";
    sheet.Range.get("A8").Text = "Right to Left";
    sheet.Range.get("B8").Text = "Spire.XLS שלום";

    // Set the rotation angle of the text; 255 stacks the text vertically
    sheet.Range.get("B2").Style.Rotation = 45;
    sheet.Range.get("B3").Style.Rotation = 90;
    sheet.Range.get("B4").Style.Rotation = -45;
    sheet.Range.get("B5").Style.Rotation = 255;

    // Set the reading order of the text
    sheet.Range.get("B7").Style.ReadingOrder = xlsModule.ReadingOrderType.LeftToRight;
    sheet.Range.get("B8").Style.ReadingOrder = xlsModule.ReadingOrderType.RightToLeft;

    // Widen column B and raise rows 2-5 so the rotated and stacked text fits
    sheet.Range.get("B1:B8").ColumnWidth = 20;
    sheet.Range.get("A2:B5").RowHeight = 60;

    // Save the workbook
    const outputFileName = "TextOrientation.xlsx";
    workbook.SaveToFile(outputFileName);

    // Release resources
    workbook.Dispose();

    // Read the result file from VFS and trigger the download
    const fileArray = window.dotnetRuntime.Module.FS.readFile(outputFileName);
    const blob = new Blob([fileArray], { type: "application/vnd.openxmlformats-officedocument.spreadsheetml.sheet" });
    const url = URL.createObjectURL(blob);
    const a = document.createElement('a');
    a.href = url;
    a.download = outputFileName;
    a.click();
    URL.revokeObjectURL(url);
  };

  return (
    <div style={{ textAlign: 'center', height: '300px' }}>
      <h1>Set Text Orientation</h1>
      <button onClick={setTextOrientation}>Start</button>
    </div>
  );
}

export default App;
In the example, B2, B3 and B4 are rotated 45 degrees, 90 degrees and -45 degrees respectively, and B5 uses a Rotation of 255, which stacks the text into a column running top to bottom; all five rows are given a height of 60. B7 and B8 hold the same mixed Latin and Hebrew string with opposite reading orders, and the Hebrew ends up on opposite sides in the two rows — which is exactly what reading order does to mixed content.
After running, the effect of setting the orientation of text:
Set the Wrapping of Text
When a piece of text is longer than the column, it spills over onto the neighbouring empty cell by default, and is cut off as soon as that neighbour has content of its own. Setting the WrapText property to true folds the text inside the cell instead; setting it to false returns the text to a single line. As with rotation, wrapping only changes how the text is laid out and does not adjust the row height by itself, so the row height is usually raised as well to show every folded line in full. The steps are as follows:
- Create a workbook and get the first worksheet.
- Write a long piece of text.
- Turn wrapping on or off through
WrapText. - Adjust the column width and row height so the folding is fully visible.
- Save the workbook.
Here is a complete code example that sets the wrapping of cell text in React:
function App() {
  const setTextWrap = async () => {
    // Get the Spire.XLS WASM module
    const xlsModule = window.wasmModule?.spirexls;

    // Check if the module is ready
    if (!xlsModule) {
      alert('Spire.Xls is not ready yet');
      return;
    }

    // Load the font into VFS
    await window.spire.FetchFileToVFS('ARIAL.TTF', '/Library/Fonts/', `${process.env.PUBLIC_URL}/font/`);

    // Create a new workbook
    const workbook = new xlsModule.Workbook();

    // Get the first worksheet
    const sheet = workbook.Worksheets.get(0);

    // Write the sample text
    sheet.Range.get("A1").Text = "Wrap Text";
    sheet.Range.get("B1").Text = "Sample";
    sheet.Range.get("A2").Text = "On";
    sheet.Range.get("B2").Text = "Spire.XLS for JavaScript can wrap text inside a cell in the browser.";
    sheet.Range.get("A3").Text = "Off";
    sheet.Range.get("B3").Text = "Spire.XLS for JavaScript can wrap text inside a cell in the browser.";

    // Turn wrapping on so the text folds inside the cell when it is wider than the column
    sheet.Range.get("B2").Style.WrapText = true;

    // Turn wrapping off so the text stays on a single line
    sheet.Range.get("B3").Style.WrapText = false;

    // Narrow column B and raise rows 2-3 so the wrapping is visible
    sheet.Range.get("B1:B3").ColumnWidth = 24;
    sheet.Range.get("A2:B3").RowHeight = 60;

    // Save the workbook
    const outputFileName = "WrapText.xlsx";
    workbook.SaveToFile(outputFileName);

    // Release resources
    workbook.Dispose();

    // Read the result file from VFS and trigger the download
    const fileArray = window.dotnetRuntime.Module.FS.readFile(outputFileName);
    const blob = new Blob([fileArray], { type: "application/vnd.openxmlformats-officedocument.spreadsheetml.sheet" });
    const url = URL.createObjectURL(blob);
    const a = document.createElement('a');
    a.href = url;
    a.download = outputFileName;
    a.click();
    URL.revokeObjectURL(url);
  };

  return (
    <div style={{ textAlign: 'center', height: '300px' }}>
      <h1>Set Text Wrap</h1>
      <button onClick={setTextWrap}>Start</button>
    </div>
  );
}

export default App;
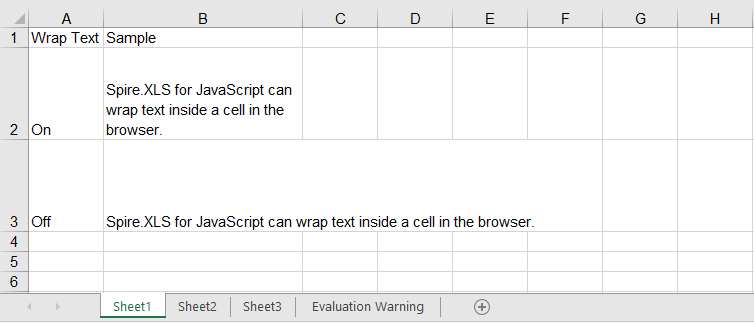
B2 and B3 hold the very same sentence; the only difference is the value of WrapText. B2 folds into several lines and shows in full, while B3 stays on one line. The cell to the right of B3 is empty, so the text spills into it; if there were content there, the overflow would simply be cut off.
After running, the effect of setting the wrapping of text:
FAQ
I set IndentLevel and the text is not indented at all?
Cause: Indentation is only displayed when the horizontal alignment is a non-General value such as Left or Right. Cells default to General alignment, and IndentLevel is ignored outright in that case — so setting only the indent level shows no change.
Solution: Set HorizontalAlignment first, then IndentLevel:
// Indentation only takes effect together with left alignment
sheet.Range.get("B2").Style.HorizontalAlignment = xlsModule.HorizontalAlignType.Left;
sheet.Range.get("B3").Style.HorizontalAlignment = xlsModule.HorizontalAlignType.Left;

// Set the indent level of the text
sheet.Range.get("B2").Style.IndentLevel = 1;
sheet.Range.get("B3").Style.IndentLevel = 2;
I want the text stacked vertically, one character per line — why does Rotation = 90 not do it?
Cause: The 0 to 90 and -1 to -90 ranges of Rotation only deal with the rotation angle. 90 merely lays the text on its side; it never breaks it into a column of single characters.
Solution: Stacked text needs the special value 255:
// 90 degrees simply rotates the text
sheet.Range.get("B2").Style.Rotation = 90;

// 255 stacks the text vertically, one character per line
sheet.Range.get("B3").Style.Rotation = 255;
Get a Free License
Spire.XLS for JavaScript offers a 30-day full-featured free trial license with no functional limitations. Apply here to evaluate before purchasing.
When organizing data such as sales records or statistical reports, converting a plain data range into an Excel table (Table / ListObject) gives the data a dedicated header row, automatic filter drop-downs, banded styling, and a "total row", which makes later browsing and summarizing more convenient. After the table is created, its appearance can also be adjusted at any time through built-in styles and various display options. Spire.XLS for JavaScript completes all of these operations directly in the browser based on WebAssembly, and manages input/output files through a virtual file system (VFS), with no backend service required.
This article covers two core features:
For installation and project configuration, refer to Integrating Spire.XLS for JavaScript in a React Project. The examples below assume Spire.XLS is installed and the WebAssembly module is initialized.
Create a Table in Excel
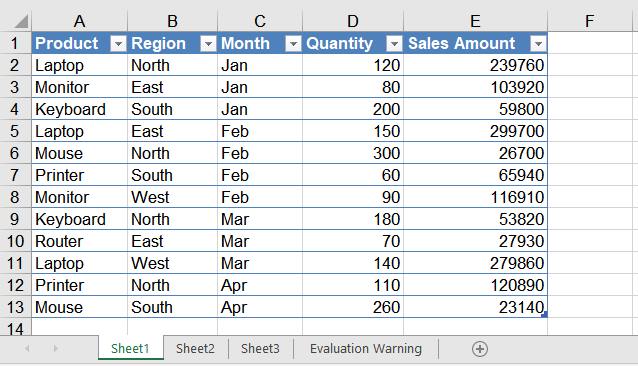
Converting a data range into a table is a quick way to obtain a structured range that has built-in filter buttons and banded styling. In this example, a sales detail list (Product, Region, Month, Quantity, Sales Amount) is first written into the worksheet, then the A1:E13 range is converted into a table named "Table1" with ListObjects.Create(), and finally the built-in light style TableStyleLight9 is applied. The main steps are as follows:
- Create a
Workbookobject and get the first worksheet. - Write the headers and the sample data into the cells.
- Call the
Worksheet.ListObjects.Create()method to convert the range that contains the headers into a table. - Apply a built-in style to the table through the
IListObject.BuiltInTableStyleproperty. - Save the workbook with the
Workbook.SaveToFile()method.
Here is a complete code example showing how to create an Excel table for a worksheet in React:
function App() {
  const createTable = async () => {
    // Get the Spire.XLS WASM module
    const xlsModule = window.wasmModule?.spirexls;

    // Check whether the module is ready
    if (!xlsModule) {
      alert('Spire.Xls is not ready yet');
      return;
    }

    // Load the font into the VFS for text measurement and column auto-fit
    await window.spire.FetchFileToVFS('ARIAL.TTF', '/Library/Fonts/', `${process.env.PUBLIC_URL}/font/`);

    // Create a new workbook and get the first worksheet
    const workbook = new xlsModule.Workbook();
    const sheet = workbook.Worksheets.get(0);

    // Write the headers
    sheet.Range.get('A1').Value = 'Product';
    sheet.Range.get('B1').Value = 'Region';
    sheet.Range.get('C1').Value = 'Month';
    sheet.Range.get('D1').Value = 'Quantity';
    sheet.Range.get('E1').Value = 'Sales Amount';

    // Write the sample data
    sheet.Range.get('A2').Value = 'Laptop';
    sheet.Range.get('B2').Value = 'North';
    sheet.Range.get('C2').Value = 'Jan';
    sheet.Range.get('D2').NumberValue = 120;
    sheet.Range.get('E2').NumberValue = 239760;

    sheet.Range.get('A3').Value = 'Monitor';
    sheet.Range.get('B3').Value = 'East';
    sheet.Range.get('C3').Value = 'Jan';
    sheet.Range.get('D3').NumberValue = 80;
    sheet.Range.get('E3').NumberValue = 103920;

    sheet.Range.get('A4').Value = 'Keyboard';
    sheet.Range.get('B4').Value = 'South';
    sheet.Range.get('C4').Value = 'Jan';
    sheet.Range.get('D4').NumberValue = 200;
    sheet.Range.get('E4').NumberValue = 59800;

    sheet.Range.get('A5').Value = 'Laptop';
    sheet.Range.get('B5').Value = 'East';
    sheet.Range.get('C5').Value = 'Feb';
    sheet.Range.get('D5').NumberValue = 150;
    sheet.Range.get('E5').NumberValue = 299700;

    sheet.Range.get('A6').Value = 'Mouse';
    sheet.Range.get('B6').Value = 'North';
    sheet.Range.get('C6').Value = 'Feb';
    sheet.Range.get('D6').NumberValue = 300;
    sheet.Range.get('E6').NumberValue = 26700;

    sheet.Range.get('A7').Value = 'Printer';
    sheet.Range.get('B7').Value = 'South';
    sheet.Range.get('C7').Value = 'Feb';
    sheet.Range.get('D7').NumberValue = 60;
    sheet.Range.get('E7').NumberValue = 65940;

    sheet.Range.get('A8').Value = 'Monitor';
    sheet.Range.get('B8').Value = 'West';
    sheet.Range.get('C8').Value = 'Feb';
    sheet.Range.get('D8').NumberValue = 90;
    sheet.Range.get('E8').NumberValue = 116910;

    sheet.Range.get('A9').Value = 'Keyboard';
    sheet.Range.get('B9').Value = 'North';
    sheet.Range.get('C9').Value = 'Mar';
    sheet.Range.get('D9').NumberValue = 180;
    sheet.Range.get('E9').NumberValue = 53820;

    sheet.Range.get('A10').Value = 'Router';
    sheet.Range.get('B10').Value = 'East';
    sheet.Range.get('C10').Value = 'Mar';
    sheet.Range.get('D10').NumberValue = 70;
    sheet.Range.get('E10').NumberValue = 27930;

    sheet.Range.get('A11').Value = 'Laptop';
    sheet.Range.get('B11').Value = 'West';
    sheet.Range.get('C11').Value = 'Mar';
    sheet.Range.get('D11').NumberValue = 140;
    sheet.Range.get('E11').NumberValue = 279860;

    sheet.Range.get('A12').Value = 'Printer';
    sheet.Range.get('B12').Value = 'North';
    sheet.Range.get('C12').Value = 'Apr';
    sheet.Range.get('D12').NumberValue = 110;
    sheet.Range.get('E12').NumberValue = 120890;

    sheet.Range.get('A13').Value = 'Mouse';
    sheet.Range.get('B13').Value = 'South';
    sheet.Range.get('C13').Value = 'Apr';
    sheet.Range.get('D13').NumberValue = 260;
    sheet.Range.get('E13').NumberValue = 23140;

    // Convert the A1:E13 data range into an Excel table (ListObject)
    const table = sheet.ListObjects.Create('Table1', sheet.Range.get({ row: 1, column: 1, lastRow: 13, lastColumn: 5 }));

    // Apply a built-in light table style
    table.BuiltInTableStyle = xlsModule.TableBuiltInStyles.TableStyleLight9;

    // Auto-fit the columns so that the contents are fully shown
    sheet.AllocatedRange.AutoFitColumns();

    // Save the workbook
    const outputFileName = 'CreateTable.xlsx';
    workbook.SaveToFile({ fileName: outputFileName, version: xlsModule.ExcelVersion.Version2010 });

    // Release resources
    workbook.Dispose();

    // Read the saved file from the VFS and trigger the download
    const fileArray = window.dotnetRuntime.Module.FS.readFile(outputFileName);
    const blob = new Blob([fileArray], { type: 'application/vnd.openxmlformats-officedocument.spreadsheetml.sheet' });
    const url = URL.createObjectURL(blob);
    const a = document.createElement('a');
    a.href = url;
    a.download = outputFileName;
    a.click();
    URL.revokeObjectURL(url);
  };

  return (
    <div style={{ textAlign: 'center', height: '300px' }}>
      <h1>Create Table</h1>
      <button onClick={createTable}>Start</button>
    </div>
  );
}

export default App;
Effect of creating the table:
Set the Table Style, Total Row and Stripes
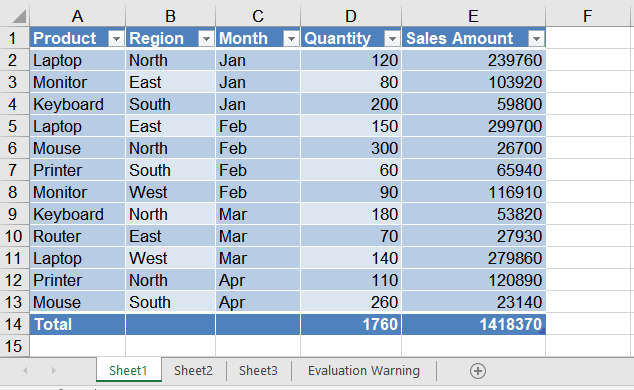
A created table can be restyled at any time: for example, replace the light style with the built-in Medium dark style, show a total row at the bottom of the table and let the "Quantity" and "Sales Amount" columns be summed automatically, and enable both row and column stripes to make the data easier to read. The main steps are as follows:
- Create a
Workbookobject and load a workbook that already contains a table with theWorkbook.LoadFromFile()method. - Get the worksheet with the
Workbook.Worksheets.get()method, and then get the table object withListObjects.get(). - Assign a new built-in style through the
BuiltInTableStyleproperty. - Set
DisplayTotalRowtotrueto show the total row, and useColumns[].TotalsRowLabelandColumns[].TotalsCalculationto set the label and the calculation of the total row columns. - Enable row and column stripes with
ShowTableStyleRowStripesandShowTableStyleColumnStripes. - Save the workbook with the
Workbook.SaveToFile()method.
Here is a complete code example showing how to load a created table in React and set its style and total row:
function App() {
  const formatTable = async () => {
    // Get the Spire.XLS WASM module
    const xlsModule = window.wasmModule?.spirexls;

    // Check whether the module is ready
    if (!xlsModule) {
      alert('Spire.Xls is not ready yet');
      return;
    }

    // Load the font into the VFS for text measurement and column auto-fit
    await window.spire.FetchFileToVFS('ARIAL.TTF', '/Library/Fonts/', `${process.env.PUBLIC_URL}/font/`);

    // Load the Excel file created in the previous section, which already contains a table
    const inputFileName = 'CreateTable.xlsx';
    await window.spire.FetchFileToVFS(inputFileName, '', `${process.env.PUBLIC_URL}data/`);

    // Create a Workbook object and load the workbook
    const workbook = new xlsModule.Workbook();
    workbook.LoadFromFile({ fileName: inputFileName });

    // Get the first worksheet and the table in it
    const sheet = workbook.Worksheets.get(0);
    const table = sheet.ListObjects.get(0);

    // Apply a built-in Medium table style
    table.BuiltInTableStyle = xlsModule.TableBuiltInStyles.TableStyleMedium9;

    // Show the total row
    table.DisplayTotalRow = true;

    // Set the label of the first column of the total row to "Total"
    table.Columns.get(0).TotalsRowLabel = 'Total';

    // Do not calculate the text columns, and sum the "Quantity" and "Sales Amount" columns automatically
    table.Columns.get(1).TotalsCalculation = xlsModule.ExcelTotalsCalculation.None;
    table.Columns.get(2).TotalsCalculation = xlsModule.ExcelTotalsCalculation.None;
    table.Columns.get(3).TotalsCalculation = xlsModule.ExcelTotalsCalculation.Sum;
    table.Columns.get(4).TotalsCalculation = xlsModule.ExcelTotalsCalculation.Sum;

    // Show the row stripes and column stripes
    table.ShowTableStyleRowStripes = true;
    table.ShowTableStyleColumnStripes = true;

    // Auto-fit the columns so that the contents are fully shown
    sheet.AllocatedRange.AutoFitColumns();

    // Save the workbook
    const outputFileName = 'FormatTable_out.xlsx';
    workbook.SaveToFile({ fileName: outputFileName, version: xlsModule.ExcelVersion.Version2010 });

    // Release resources
    workbook.Dispose();

    // Read the saved file from the VFS and trigger the download
    const fileArray = window.dotnetRuntime.Module.FS.readFile(outputFileName);
    const blob = new Blob([fileArray], { type: 'application/vnd.openxmlformats-officedocument.spreadsheetml.sheet' });
    const url = URL.createObjectURL(blob);
    const a = document.createElement('a');
    a.href = url;
    a.download = outputFileName;
    a.click();
    URL.revokeObjectURL(url);
  };

  return (
    <div style={{ textAlign: 'center', height: '300px' }}>
      <h1>Format Table</h1>
      <button onClick={formatTable}>Start</button>
    </div>
  );
}

export default App;
Effect of setting the table style:
Frequently Asked Questions
How do I change the built-in style of a table? What styles are available?
Reason: The BuiltInTableStyle property was not reassigned after the table was created, or the wrong enum type was assigned to the property.
Solution: Reassign the IListObject.BuiltInTableStyle property. Its values come from the TableBuiltInStyles enum, which provides multiple built-in styles including Light (TableStyleLight1 ~ TableStyleLight21), Medium (TableStyleMedium1 ~ TableStyleMedium28) and Dark (TableStyleDark1 ~ TableStyleDark11). For example, this article first applies TableStyleLight9 and then switches to TableStyleMedium9.
How do I name a table or rename it? What happens if two tables have the same name?
Reason: The first parameter of ListObjects.Create() is the table name, e.g. Create("Table1", ...). Within the same worksheet, table names must be unique; otherwise creating another table with the same name raises an error.
Solution: Pass a unique name when creating the table (e.g. "SalesTable1"). To rename an existing table, set its DisplayName property directly, for example table.DisplayName = "SalesTable2025";.
Get a Free License
Spire.XLS for JavaScript offers a 30-day full-featured free trial license with no functional limitations. Apply here to evaluate before purchasing.
Group or Ungroup Rows and Columns in Excel with JavaScript in React
2026-09-04 08:50:04 Written by jie zouIn everyday Excel spreadsheet handling, grouping rows or columns lets you collapse detail data and show only summary information, making large tables cleaner and easier to read. Spire.XLS for JavaScript performs grouping and ungrouping directly in the browser based on WebAssembly, and manages input/output files through a virtual file system (VFS), with no backend service required.
This article covers two core features:
For installation and project configuration, refer to Integrate Spire.XLS for JavaScript in a React Project. The examples below assume Spire.XLS is installed and the WebAssembly module is initialized.
Group Rows or Columns
After grouping rows or columns, you can collapse the detail data inside a group and keep only the summary rows or columns you need, making the worksheet tidier. Spire.XLS for JavaScript groups rows with the GroupByRows() method and columns with the GroupByColumns() method. The main steps are as follows:
- Create a
Workbookobject and use theLoadFromFile()method to load the Excel document. - Use the
Workbook.Worksheets.get()method to get a specific worksheet. - Use the
Worksheet.GroupByRows()method to group rows. - Use the
Worksheet.GroupByColumns()method to group columns. - Use the
Workbook.SaveToFile()method to save the document to a specified path.
Here is a complete code example showing how to group rows or columns in React:
function App() {
  const groupRowsAndColumns = async () => {
    // Get the Spire.XLS WASM module
    const xlsModule = window.wasmModule?.spirexls;

    // Check whether the module is ready
    if (!xlsModule) {
      alert('Spire.Xls is not ready yet');
      return;
    }

    // Load the font and Excel file into the VFS
    await window.spire.FetchFileToVFS('ARIAL.TTF', '/Library/Fonts/', `${process.env.PUBLIC_URL}/font/`);
    const inputFileName = 'GroupRowsAndColumns.xlsx';
    await window.spire.FetchFileToVFS(inputFileName, '', `${process.env.PUBLIC_URL}data/`);

    // Load the workbook
    const workbook = new xlsModule.Workbook();
    workbook.LoadFromFile({ fileName: inputFileName });

    // Get the first worksheet
    const sheet = workbook.Worksheets.get(0);

    // Group rows
    sheet.GroupByRows(6, 10, false);
    sheet.GroupByRows(14, 16, false);

    // Group columns
    sheet.GroupByColumns(2, 7, false);

    // Save the document
    const outputFileName = 'GroupRowsAndColumns_output.xlsx';
    workbook.SaveToFile({ fileName: outputFileName, version: xlsModule.ExcelVersion.Version2010 });

    // Release resources
    workbook.Dispose();

    // Read the converted file from the VFS and trigger a download
    const fileArray = window.dotnetRuntime.Module.FS.readFile(outputFileName);
    const blob = new Blob([fileArray], { type: 'application/vnd.openxmlformats-officedocument.spreadsheetml.sheet' });
    const url = URL.createObjectURL(blob);
    const a = document.createElement('a');
    a.href = url;
    a.download = outputFileName;
    a.click();
    URL.revokeObjectURL(url);
  };

  return (
    <div style={{ textAlign: 'center', height: '300px' }}>
      <h1>Group Rows And Columns</h1>
      <button onClick={groupRowsAndColumns}>
        Start
      </button>
    </div>
  );
}

export default App;
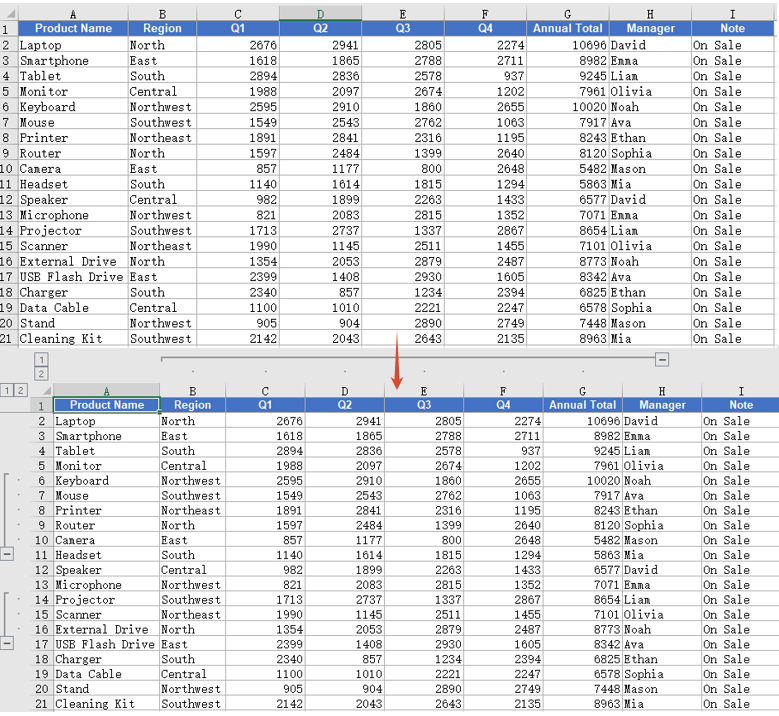
After grouping, group markers appear on the left side of the grouped rows or above the grouped columns. Click a marker to collapse or expand the detail data.
Ungroup Rows or Columns
When the grouping structure is no longer needed, you can ungroup the existing groups so that all rows and columns return to their normal display. Spire.XLS for JavaScript ungroups rows with the UngroupByRows() method and columns with the UngroupByColumns() method. The main steps are as follows:
- Create a
Workbookobject and use theLoadFromFile()method to load the Excel document that contains groups. - Use the
Workbook.Worksheets.get()method to get a specific worksheet. - Use the
Worksheet.UngroupByRows()method to ungroup rows. - Use the
Worksheet.UngroupByColumns()method to ungroup columns. - Use the
Workbook.SaveToFile()method to save the document to a specified path.
Here is a complete code example showing how to ungroup rows or columns in React:
function App() {
  const ungroupRowsAndColumns = async () => {
    // Get the Spire.XLS WASM module
    const xlsModule = window.wasmModule?.spirexls;

    // Check whether the module is ready
    if (!xlsModule) {
      alert('Spire.Xls is not ready yet');
      return;
    }

    // Load the font and Excel file into the VFS
    await window.spire.FetchFileToVFS('ARIAL.TTF', '/Library/Fonts/', `${process.env.PUBLIC_URL}/font/`);
    const inputFileName = 'GroupRowsAndColumns.xlsx';
    await window.spire.FetchFileToVFS(inputFileName, '', `${process.env.PUBLIC_URL}data/`);

    // Load the workbook
    const workbook = new xlsModule.Workbook();
    workbook.LoadFromFile({ fileName: inputFileName });

    // Get the first worksheet
    const sheet = workbook.Worksheets.get(0);

    // Ungroup rows
    sheet.UngroupByRows(6, 10);
    sheet.UngroupByRows(14, 16);

    // Ungroup columns
    sheet.UngroupByColumns(2, 7);

    // Save the document
    const outputFileName = 'UngroupRowsAndColumns_output.xlsx';
    workbook.SaveToFile({ fileName: outputFileName, version: xlsModule.ExcelVersion.Version2010 });

    // Release resources
    workbook.Dispose();

    // Read the converted file from the VFS and trigger a download
    const fileArray = window.dotnetRuntime.Module.FS.readFile(outputFileName);
    const blob = new Blob([fileArray], { type: 'application/vnd.openxmlformats-officedocument.spreadsheetml.sheet' });
    const url = URL.createObjectURL(blob);
    const a = document.createElement('a');
    a.href = url;
    a.download = outputFileName;
    a.click();
    URL.revokeObjectURL(url);
  };

  return (
    <div style={{ textAlign: 'center', height: '300px' }}>
      <h1>Ungroup Rows And Columns</h1>
      <button onClick={ungroupRowsAndColumns}>
        Start
      </button>
    </div>
  );
}

export default App;
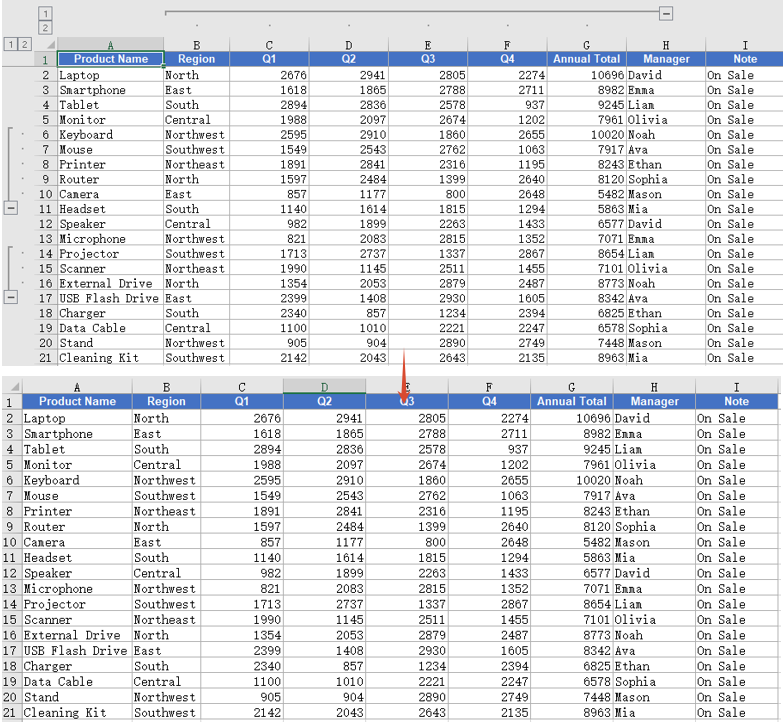
After ungrouping, the group markers on the rows or columns disappear and the data returns to the normal ungrouped display.
FAQ
Cannot collapse or expand detail data after grouping
Cause: The third parameter isCollapsed of the GroupByRows() and GroupByColumns() methods is set to false, so the groups are displayed expanded by default.
Solution: Set this parameter to true, and the groups will be displayed collapsed after saving:
sheet.GroupByRows(6, 10, true);
Some rows or columns still show group symbols after ungrouping
Cause: The UngroupByRows() and UngroupByColumns() methods only ungroup the rows or columns within the specified range. If these rows or columns also belong to a higher-level group, the higher-level group symbols are still retained.
Solution: Make sure the range passed when ungrouping matches the range used when grouping. If nested groups exist, call the ungroup methods repeatedly to ungroup level by level:
sheet.UngroupByRows(6, 10);
sheet.UngroupByRows(14, 16);
sheet.UngroupByColumns(2, 7);
Obtain a Free License
Spire.XLS for JavaScript offers a 30-day full-featured free trial license with no functional limitations. Apply here to evaluate before purchasing.
In everyday Excel data processing, sorting is one of the most common operations — whether rearranging data by name, value, or date, it makes tables more organized and easier to search. Spire.XLS for JavaScript performs data sorting directly in the browser based on WebAssembly, and manages input/output files through a virtual file system (VFS), with no backend service required.
This article covers two core features:
For installation and project configuration, refer to Integrating Spire.XLS for JavaScript in a React Project. The examples below assume Spire.XLS is installed and the WebAssembly module is initialized.
Sort Data in a Cell Range in Ascending Order
Sorting a specified cell range in ascending order is the most common data arrangement requirement. Spire.XLS for JavaScript adds a sort field and specifies the sort order with the Workbook.DataSorter.SortColumns.Add() method, then sorts the specified range with the Workbook.DataSorter.Sort() method. The main steps are as follows:
- Create a
Workbookobject and use theLoadFromFile()method to load the Excel document. - Use the
Workbook.Worksheets.get()method to get a specific worksheet. - Use the
Workbook.DataSorter.SortColumns.Add()method to add a sort field, specifying the column and the sort order. - Use the
Workbook.DataSorter.Sort()method to sort the specified cell range. - Use the
Workbook.SaveToFile()method to save the document to a specified path.
Here is a complete code example showing how to sort a cell range in ascending order by a single column in React:
function App() {
  const sortAscending = async () => {
    // Get the Spire.XLS WASM module
    const xlsModule = window.wasmModule?.spirexls;

    // Check whether the module is ready
    if (!xlsModule) {
      alert('Spire.Xls is not ready yet');
      return;
    }

    // Load the font and Excel file into the VFS
    await window.spire.FetchFileToVFS('ARIAL.TTF', '/Library/Fonts/', `${process.env.PUBLIC_URL}/font/`);
    const inputFileName = 'DataSorting.xlsx';
    await window.spire.FetchFileToVFS(inputFileName, '', `${process.env.PUBLIC_URL}data/`);

    // Load the workbook
    const workbook = new xlsModule.Workbook();
    workbook.LoadFromFile({ fileName: inputFileName });

    // Get the first worksheet
    const sheet = workbook.Worksheets.get(0);

    // Add a sort field: sort by the 5th column (Population) in ascending order
    workbook.DataSorter.SortColumns.Add({ key: 4, orderBy: xlsModule.OrderBy.Ascending });

    // Sort the specified cell range A1:E19
    workbook.DataSorter.Sort(sheet.Range.get("A1:E19"));

    // Save the document
    const outputFileName = 'SortDataAscending_output.xlsx';
    workbook.SaveToFile({ fileName: outputFileName, version: xlsModule.ExcelVersion.Version2010 });

    // Release resources
    workbook.Dispose();

    // Read the converted file from the VFS and trigger a download
    const fileArray = window.dotnetRuntime.Module.FS.readFile(outputFileName);
    const blob = new Blob([fileArray], { type: 'application/vnd.openxmlformats-officedocument.spreadsheetml.sheet' });
    const url = URL.createObjectURL(blob);
    const a = document.createElement('a');
    a.href = url;
    a.download = outputFileName;
    a.click();
    URL.revokeObjectURL(url);
  };

  return (
    <div style={{ textAlign: 'center', height: '300px' }}>
      <h1>Sort Data in Ascending Order</h1>
      <button onClick={sortAscending}>
        Start
      </button>
    </div>
  );
}

export default App;
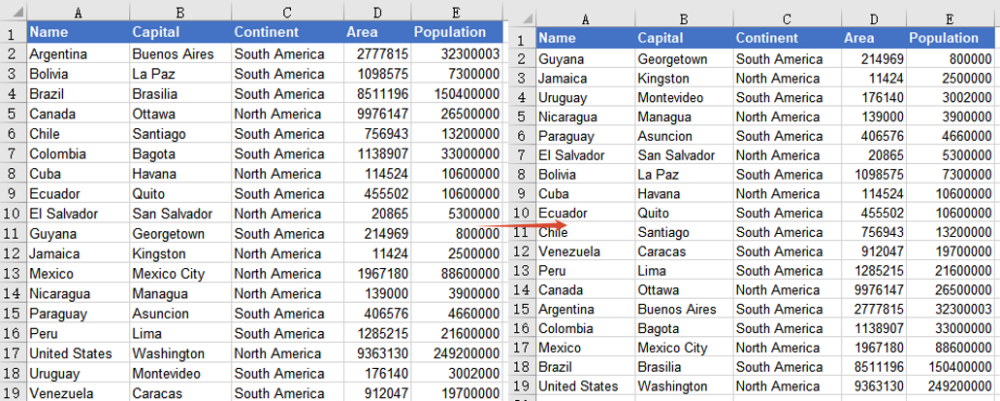
After sorting, the data is rearranged in ascending numerical order based on the 5th column (Population), from the smallest to the largest, and the other columns in the same row stay aligned with the Population column.
Sort Data by Multiple Columns
When a single-column sort is not enough, you can sort by multiple columns at the same time. Spire.XLS for JavaScript supports adding multiple sort fields by calling the SortColumns.Add() method several times. Data is sorted by the first field first, then by the subsequent fields. The main steps are as follows:
- Create a
Workbookobject and use theLoadFromFile()method to load the Excel document. - Use the
Workbook.Worksheets.get()method to get a specific worksheet. - Call the
Workbook.DataSorter.SortColumns.Add()method several times to add multiple sort fields. - Use the
Workbook.DataSorter.Sort()method to sort the specified cell range. - Use the
Workbook.SaveToFile()method to save the document to a specified path.
Here is a complete code example showing how to sort a cell range by multiple columns in React:
function App() {
  const sortMultipleColumns = async () => {
    // Get the Spire.XLS WASM module
    const xlsModule = window.wasmModule?.spirexls;

    // Check whether the module is ready
    if (!xlsModule) {
      alert('Spire.Xls is not ready yet');
      return;
    }

    // Load the font and Excel file into the VFS
    await window.spire.FetchFileToVFS('ARIAL.TTF', '/Library/Fonts/', `${process.env.PUBLIC_URL}/font/`);
    const inputFileName = 'DataSorting.xlsx';
    await window.spire.FetchFileToVFS(inputFileName, '', `${process.env.PUBLIC_URL}data/`);

    // Load the workbook
    const workbook = new xlsModule.Workbook();
    workbook.LoadFromFile({ fileName: inputFileName });

    // Get the first worksheet
    const sheet = workbook.Worksheets.get(0);

    // Add multiple sort fields: first by the 3rd column (Continent), then by the 4th column (Area), ascending
    workbook.DataSorter.SortColumns.Add({ key: 2, orderBy: xlsModule.OrderBy.Ascending });
    workbook.DataSorter.SortColumns.Add({ key: 3, orderBy: xlsModule.OrderBy.Ascending });

    // Sort the specified cell range A1:E19
    workbook.DataSorter.Sort(sheet.Range.get("A1:E19"));

    // Save the document
    const outputFileName = 'SortDataMultipleColumns_output.xlsx';
    workbook.SaveToFile({ fileName: outputFileName, version: xlsModule.ExcelVersion.Version2010 });

    // Release resources
    workbook.Dispose();

    // Read the converted file from the VFS and trigger a download
    const fileArray = window.dotnetRuntime.Module.FS.readFile(outputFileName);
    const blob = new Blob([fileArray], { type: 'application/vnd.openxmlformats-officedocument.spreadsheetml.sheet' });
    const url = URL.createObjectURL(blob);
    const a = document.createElement('a');
    a.href = url;
    a.download = outputFileName;
    a.click();
    URL.revokeObjectURL(url);
  };

  return (
    <div style={{ textAlign: 'center', height: '300px' }}>
      <h1>Sort Data by Multiple Columns</h1>
      <button onClick={sortMultipleColumns}>
        Start
      </button>
    </div>
  );
}

export default App;
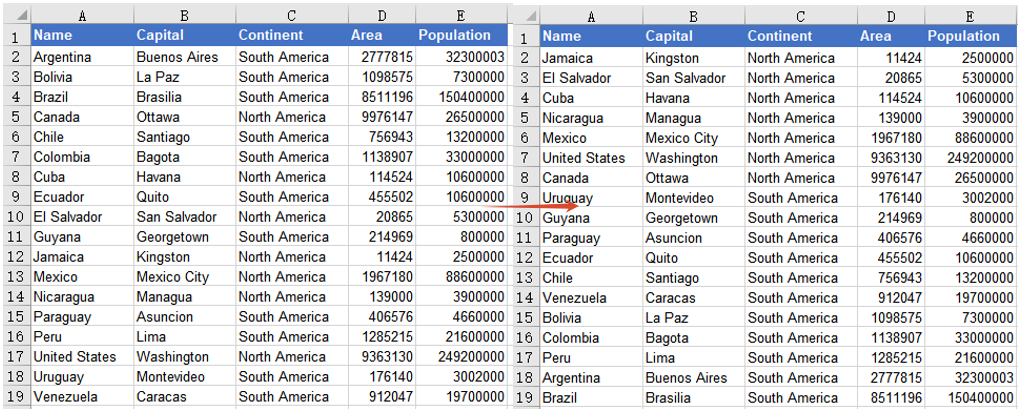
After sorting, the data is first arranged in ascending order by the 3rd column (Continent), grouping countries from the same continent together; when the continents are the same, it is then sorted in ascending order by the 4th column (Area).
FAQ
The header row is also included in the sorting
Cause: By default, the DataSorter.Sort() method treats the first row of the sort range as a title row and keeps it in place. If the header is moved into the data rows, it is usually because the starting row of the sort range is set incorrectly.
Solution: Make sure the range passed to the Sort() method includes the header row and that the header row is at the top of the range, for example sheet.Range.get("A1:E19"). You can also start the sort from the data rows, such as sheet.Range.get("A2:E19").
After a single-column sort, other columns do not change accordingly
Cause: The sort only takes effect on the cell range passed to the Sort() method. If you sort only a single column's range, the other columns will not be rearranged, causing data in the same row to become misaligned.
Solution: Make the sort range cover all related columns (for example, the complete range that includes name, capital, continent, area, and population, A1:E19), so that the entire row moves together.
Obtain a Free License
Spire.XLS for JavaScript offers a 30-day full-featured free trial license with no functional limitations. Apply here to evaluate before purchasing.
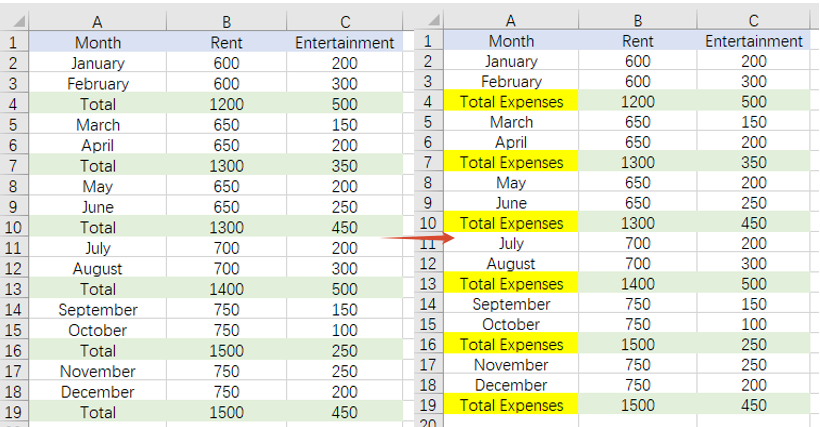
Finding and replacing data is a common requirement when processing Excel files in web applications. Spire.XLS for JavaScript runs entirely in the browser via WebAssembly, using a virtual file system (VFS) to manage input and output files — no backend server required. It provides search methods such as FindAllString() and FindAllNumber() that let you locate target data across an entire worksheet or within a specified cell range, quickly replace it with new content, and optionally mark the replaced cells with a highlight color.
With Spire.XLS for JavaScript, you can batch-replace text across an entire worksheet or restrict the search to a specific cell range, giving you both efficiency and flexibility when updating partial data precisely.
This article covers two core features:
- Find and Replace Data in a Worksheet in Excel
- Find and Replace Data in a Specific Cell Range in Excel
For installation and project setup, refer to Integrating Spire.XLS for JavaScript in a React Project. The examples below assume Spire.XLS is installed and the WebAssembly module is initialized.
Find and Replace Data in a Worksheet in Excel
With Spire.XLS for JavaScript, you can find all cells containing a specified text in an entire worksheet and replace them with new content. The FindAllString() method returns all matching cell ranges. You can then replace the text by setting the range.Text property and highlight the replaced cells by setting the range.Style.Color property, making it easy to identify where modifications were made. The steps are as follows:
- Create a
Workbookobject and load an existing Excel file. - Get the worksheet to operate on via
workbook.Worksheets.get(). - Use
worksheet.FindAllString()to find all cell ranges containing the specified text in the worksheet. - Iterate through the search results, replacing the text via
range.Textand setting the highlight color viarange.Style.Color. - Save the workbook to an Excel file using
SaveToFile().
Below is a complete code example demonstrating how to find and replace data across an entire worksheet in React:
function App() {
  const findAndReplace = async () => {
    // Get the Spire.XLS WASM module
    const xlsModule = window.wasmModule?.spirexls;

    // Check if the module is ready
    if (!xlsModule) {
      alert('Spire.Xls is not ready yet');
      return;
    }

    let excelFileName = 'Sample.xlsx';
    await window.spire.FetchFileToVFS(excelFileName, '', `${process.env.PUBLIC_URL}static/data/`);

    // Create a new workbook and load an existing Excel file
    const workbook = new xlsModule.Workbook();
    workbook.LoadFromFile({ fileName: excelFileName });

    // Get the first worksheet
    let worksheet = workbook.Worksheets.get(0);

    // Find all cells containing the text "Total" in the worksheet
    let ranges = worksheet.FindAllString("Total", false, false);

    // Iterate through the search results, replace the text, and set the highlight color
    for (let range of ranges) {
      range.Text = "Total Expenses";
      range.Style.Color = xlsModule.Color.get_Yellow();
    }

    // Save the workbook
    const outputFileName = 'FindAndReplaceData.xlsx';
    workbook.SaveToFile({ fileName: outputFileName, version: xlsModule.ExcelVersion.Version2010 });
    workbook.Dispose();

    // Read the file from VFS and trigger download
    const fileArray = window.dotnetRuntime.Module.FS.readFile(outputFileName);
    const blob = new Blob([fileArray], { type: 'application/vnd.openxmlformats-officedocument.spreadsheetml.sheet' });
    const url = URL.createObjectURL(blob);
    const a = document.createElement('a');
    a.href = url;
    a.download = outputFileName;
    a.click();
    URL.revokeObjectURL(url);
  };

  return (
    <div style={{ textAlign: 'center', height: '300px' }}>
      <h1>Find and Replace Data in a Worksheet</h1>
      <button onClick={findAndReplace}>
        Generate
      </button>
    </div>
  );
}

export default App;
Find and replace data in a worksheet in Excel
Find and Replace Data in a Specific Cell Range in Excel
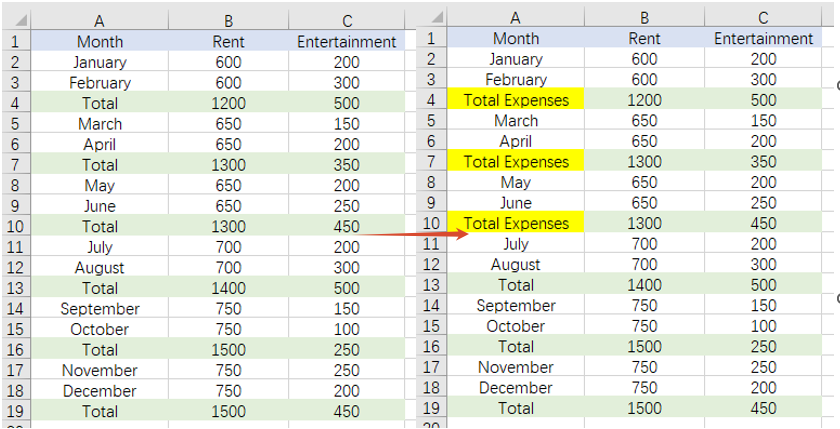
When you only need to update part of the data, you can restrict the search to a specific cell range. After specifying the target range with the sheet.Range.get() method, range.FindAllString() searches for cells containing the specified text only within that range, ensuring that data outside the range remains unaffected. The steps are as follows:
- Create a
Workbookobject and load an existing Excel file. - Get the worksheet to operate on via
workbook.Worksheets.get(). - Specify the cell range to search with
sheet.Range.get(). - Use
range.FindAllString()to find cells containing the target text within the specified range, then iterate through the results to replace the text and set the highlight color. - Save the workbook to an Excel file using
SaveToFile().
Below is a complete code example demonstrating how to find and replace data in a specific cell range in React:
function App() {
  const findAndReplaceInRange = async () => {
    // Get the Spire.XLS WASM module
    const xlsModule = window.wasmModule?.spirexls;

    // Check if the module is ready
    if (!xlsModule) {
      alert('Spire.Xls is not ready yet');
      return;
    }

    // Load the sample file into the Virtual File System (VFS)
    let excelFileName = 'FindCellsSample.xlsx';
    await window.spire.FetchFileToVFS(excelFileName, '', `${process.env.PUBLIC_URL}static/data/`);

    // Create a new workbook and load an existing Excel file
    const workbook = new xlsModule.Workbook();
    workbook.LoadFromFile({ fileName: excelFileName });

    // Get the first worksheet
    let worksheet = workbook.Worksheets.get(0);

    // Specify the cell range to search
    let range = worksheet.Range.get({
      row: 1,
      column: 1,
      lastRow: 12,
      lastColumn: 2,
    });

    // Find all cells containing the text "Total" within the specified range
    let ranges = range.FindAllString("Total", false, false);

    // Iterate through the search results, replace the text, and set the highlight color
    for (let r of ranges) {
      r.Text = "Total Expenses";
      r.Style.Color = xlsModule.Color.get_Yellow();
    }

    // Save the workbook
    const outputFileName = 'FindAndReplaceInRange.xlsx';
    workbook.SaveToFile({ fileName: outputFileName, version: xlsModule.ExcelVersion.Version2010 });
    workbook.Dispose();

    // Read the file from VFS and trigger download
    const fileArray = window.dotnetRuntime.Module.FS.readFile(outputFileName);
    const blob = new Blob([fileArray], { type: 'application/vnd.openxmlformats-officedocument.spreadsheetml.sheet' });
    const url = URL.createObjectURL(blob);
    const a = document.createElement('a');
    a.href = url;
    a.download = outputFileName;
    a.click();
    URL.revokeObjectURL(url);
  };

  return (
    <div style={{ textAlign: 'center', height: '300px' }}>
      <h1>Find and Replace Data in a Specific Cell Range</h1>
      <button onClick={findAndReplaceInRange}>
        Generate
      </button>
    </div>
  );
}

export default App;
Find and replace data in a specific cell range in Excel
FAQ
How to control whether the search is case-sensitive or matches whole words
Cause: The last two boolean parameters of the FindAllString() method control whether the search is case-sensitive and whether it must match whole words. If these parameters are set incorrectly, you may find too many or too few matching results.
Solution: Adjust the parameters of FindAllString() according to your actual needs:
// Case-insensitive, whole-word matching not required
let ranges = worksheet.FindAllString("Area", false, false);

// Case-sensitive, whole-word matching required
let ranges = worksheet.FindAllString("Total", true, true);
How to find and replace numbers in a specific range
Cause: Find and replace works not only with text but also with numbers. If you only use FindAllString() to handle text, numeric cells cannot be matched.
Solution: Use the range.FindAllNumber() method to find numbers within the specified range, then replace the values by setting the Text property:
let numberRanges = range.FindAllNumber(100, true);
for (let r of numberRanges) {
  r.Text = "200";
  r.Style.Color = xlsModule.Color.get_Yellow();
}
Get a Free License
Spire.XLS for JavaScript offers a 30-day full-featured free trial license with no functional limitations. Apply here to evaluate before purchasing.
Add, Get, and Remove Excel Data Validation with JavaScript in React
2026-08-27 08:46:45 Written by Lisa LiData validation is an effective way to control the input content of Excel cells. It can intercept incorrect input at the data entry stage, ensuring that data is standardized and accurate. Spire.XLS for JavaScript uses WebAssembly to add, read, and remove data validation directly in the browser, managing input and output files through a virtual file system (VFS) — no backend server required.
This article covers three core features:
For installation and project configuration, refer to Integrating Spire.XLS for JavaScript in a React Project. The examples below assume Spire.XLS is installed and the WebAssembly module is initialized.
Add Data Validation
In daily forms and reports, we often need to restrict the input of cells, for example only allowing numbers or dates within a certain range, or limiting the text length. Spire.XLS for JavaScript sets validation rules through the DataValidation property of a cell, supporting multiple validation types such as Decimal, Whole Number, Date, Time, Text Length, and List.
function App() {
  const sheetToSVG = async () => {
    // Get the Spire.XLS WASM module
    const xlsModule = window.wasmModule?.spirexls;

    // Check if the module is ready
    if (!xlsModule) {
      alert('Spire.Xls is not ready yet');
      return;
    }

    // Load the font into VFS
    await window.spire.FetchFileToVFS('ARIAL.TTF', '/Library/Fonts/', `${process.env.PUBLIC_URL}/font/`);

    // Create a new workbook
    const workbook = new xlsModule.Workbook();

    // Get the first worksheet
    const sheet = workbook.Worksheets.get(0);

    // Add a decimal validation: cell B12 can only accept numbers between 3 and 6
    sheet.Range.get("B11").Text = "Input Number(3-6):";
    let rangeNumber = sheet.Range.get("B12");
    rangeNumber.DataValidation.CompareOperator = xlsModule.ValidationComparisonOperator.Between;
    rangeNumber.DataValidation.Formula1 = "3";
    rangeNumber.DataValidation.Formula2 = "6";
    rangeNumber.DataValidation.AllowType = xlsModule.CellDataType.Decimal;
    rangeNumber.DataValidation.ErrorMessage = "Please input correct number!";
    rangeNumber.DataValidation.ShowError = true;
    rangeNumber.Style.KnownColor = xlsModule.ExcelColors.Gray25Percent;

    // Add a date validation: cell B15 can only accept dates within the year 2024
    sheet.Range.get("B14").Text = "Input Date: 1/1/2024";
    let rangeDate = sheet.Range.get("B15");
    rangeDate.DataValidation.AllowType = xlsModule.CellDataType.Date;
    rangeDate.DataValidation.CompareOperator = xlsModule.ValidationComparisonOperator.Between;
    rangeDate.DataValidation.Formula1 = "1/1/2024";
    rangeDate.DataValidation.Formula2 = "12/31/2024";
    rangeDate.DataValidation.ErrorMessage = "Please input correct date!";
    rangeDate.DataValidation.ShowError = true;
    // Supports setting AlertStyleType.Warning; AlertStyleType.Info; AlertStyleType.Stop
    rangeDate.DataValidation.AlertStyle = xlsModule.AlertStyleType.Warning;
    rangeDate.Style.KnownColor = xlsModule.ExcelColors.Gray25Percent;

    // Add a text length validation: the text length in cell B18 cannot exceed 5 characters
    sheet.Range.get("B17").Text = "Input Text:";
    let rangeTextLength = sheet.Range.get("B18");
    rangeTextLength.DataValidation.AllowType = xlsModule.CellDataType.TextLength;
    rangeTextLength.DataValidation.CompareOperator = xlsModule.ValidationComparisonOperator.LessOrEqual;
    rangeTextLength.DataValidation.Formula1 = "5";
    rangeTextLength.DataValidation.ErrorMessage = "Enter a Valid String!";
    rangeTextLength.DataValidation.ShowError = true;
    rangeTextLength.DataValidation.AlertStyle = xlsModule.AlertStyleType.Stop;
    rangeTextLength.Style.KnownColor = xlsModule.ExcelColors.Gray25Percent;

    // Auto-fit the width of column 2
    sheet.AutoFitColumn(2);

    const outputFileName = "DataValidation_out.xlsx";
    workbook.SaveToFile({ fileName: outputFileName, version: xlsModule.ExcelVersion.Version2010 });

    // Release the workbook object to free resources
    workbook.Dispose();

    // Read the converted file from VFS and trigger the download
    const fileArray = window.dotnetRuntime.Module.FS.readFile(outputFileName);
    const blob = new Blob([fileArray], { type: "application/vnd.openxmlformats-officedocument.spreadsheetml.sheet" });
    const url = URL.createObjectURL(blob);
    const a = document.createElement('a');
    a.href = url;
    a.download = outputFileName;
    a.click();
    URL.revokeObjectURL(url);
  };

  return (
    <div style={{ textAlign: 'center', height: '300px' }}>
      <h1>Add Data Validation</h1>
      <button onClick={sheetToSVG}>
        Start
      </button>
    </div>
  );
}

export default App;
Add data validation 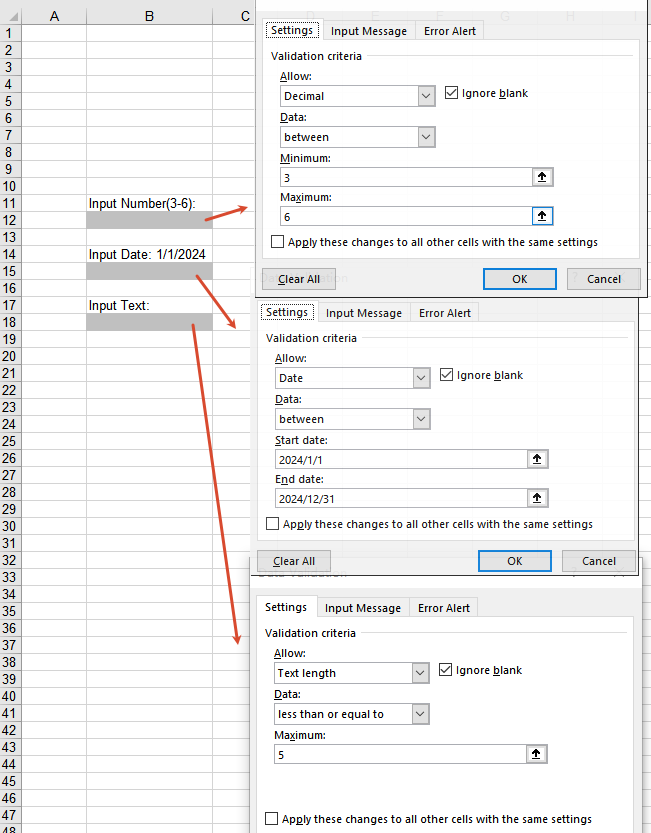
Get Data Validation Settings
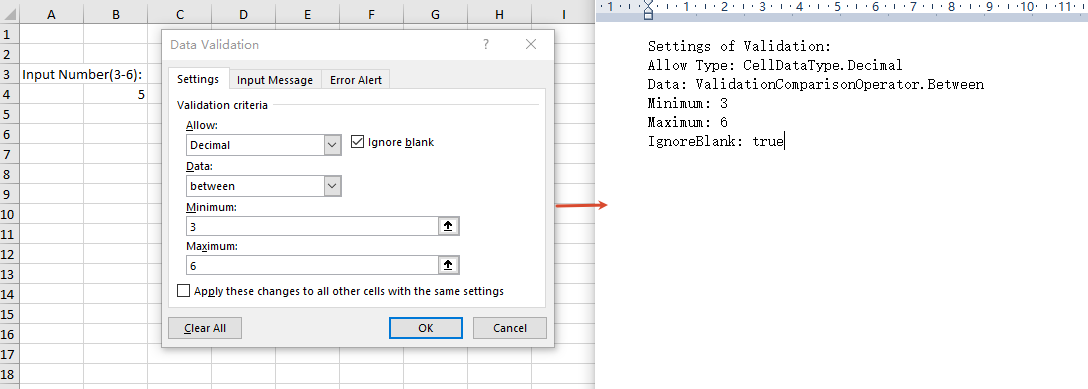
When processing an Excel document that already has data validation, you may sometimes need to read the validation rules to understand the input constraints of a cell. Through the DataValidation property of a cell, you can obtain the validation object and then read settings such as AllowType (validation type), CompareOperator (comparison operator), Formula1 (minimum/lower limit), Formula2 (maximum/upper limit), and IgnoreBlank (whether blank values are ignored).
function App() {
  const sheetToSVG = async () => {
    // Get the Spire.XLS WASM module
    const xlsModule = window.wasmModule?.spirexls;

    // Check if the module is ready
    if (!xlsModule) {
      alert('Spire.Xls is not ready yet');
      return;
    }

    // Load the font and Excel file into VFS
    await window.spire.FetchFileToVFS('ARIAL.TTF', '/Library/Fonts/', `${process.env.PUBLIC_URL}/font/`);
    const inputFileName = 'GetSettingsOfDataValidation.xlsx';
    await window.spire.FetchFileToVFS(inputFileName, '', `${process.env.PUBLIC_URL}/static/data/`);

    // Load the workbook
    const workbook = new xlsModule.Workbook();
    workbook.LoadFromFile({ fileName: inputFileName });

    // Get the first worksheet
    const worksheet = workbook.Worksheets.get(0);

    // Cell B4 has a decimal validation set
    const cell = worksheet.Range.get("B4");

    // Get the data validation object of this cell
    const validation = cell.DataValidation;

    // Get the validation settings
    let allowType = validation.AllowType.toString();
    let data = validation.CompareOperator.toString();
    let minimum = validation.Formula1.toString();
    let maximum = validation.Formula2.toString();
    let ignoreBlank = validation.IgnoreBlank.toString();

    // Concatenate the result into a string
    let result = `Settings of Validation: \r\nAllow Type: ${allowType}\r\nData: ${data}\r\nMinimum: ${minimum}\r\nMaximum: ${maximum}\r\nIgnoreBlank: ${ignoreBlank}`;

    const outputFileName = 'GetSettingsOfDataValidation-out.txt';

    // Write the result to a txt file
    window.dotnetRuntime.Module.FS.writeFile(outputFileName, result);

    // Release the workbook object to free resources
    workbook.Dispose();

    // Read the converted file from VFS and trigger the download
    const fileArray = window.dotnetRuntime.Module.FS.readFile(outputFileName);
    const blob = new Blob([fileArray], { type: 'text/plain' });
    const url = URL.createObjectURL(blob);
    const a = document.createElement('a');
    a.href = url;
    a.download = outputFileName;
    a.click();
    URL.revokeObjectURL(url);
  };

  return (
    <div style={{ textAlign: 'center', height: '300px' }}>
      <h1>Get Data Validation Settings</h1>
      <button onClick={sheetToSVG}>
        Start
      </button>
    </div>
  );
}

export default App;
Remove Data Validation
When the validation rules are no longer needed, you can remove data validation in bulk by cell range through the Remove method of the worksheet's DVTable. When removing, you need to pass in an array composed of rectangles, which are used to locate the ranges in the worksheet where the validations should be removed.
function App() {
  const sheetToSVG = async () => {
    // Get the Spire.XLS WASM module
    const xlsModule = window.wasmModule?.spirexls;

    // Check if the module is ready
    if (!xlsModule) {
      alert('Spire.Xls is not ready yet');
      return;
    }

    // Load the font and Excel file into VFS
    await window.spire.FetchFileToVFS('ARIAL.TTF', '/Library/Fonts/', `${process.env.PUBLIC_URL}/font/`);
    const inputFileName = 'RemoveDataValidation.xlsx';
    await window.spire.FetchFileToVFS(inputFileName, '', `${process.env.PUBLIC_URL}/static/data/`);

    // Load the workbook
    const workbook = new xlsModule.Workbook();
    workbook.LoadFromFile({ fileName: inputFileName });

    // Create an array of rectangles, which is used to locate the ranges in the worksheet
    let rectangles = [];

    // Add a rectangle to the array. This rectangle specifies the cells from A1 to B3.
    rectangles.push(xlsModule.Rectangle.FromLTRB(0, 0, 1, 2));

    // Remove the validations in the ranges represented by the rectangles
    workbook.Worksheets.get(0).DVTable.Remove(rectangles);

    const outputFileName = 'RemoveDataValidation-out.xlsx';
    workbook.SaveToFile({ fileName: outputFileName, version: xlsModule.ExcelVersion.Version2010 });

    // Release the workbook object to free resources
    workbook.Dispose();

    // Read the converted file from VFS and trigger the download
    const fileArray = window.dotnetRuntime.Module.FS.readFile(outputFileName);
    const blob = new Blob([fileArray], { type: "application/vnd.openxmlformats-officedocument.spreadsheetml.sheet" });
    const url = URL.createObjectURL(blob);
    const a = document.createElement('a');
    a.href = url;
    a.download = outputFileName;
    a.click();
    URL.revokeObjectURL(url);
  };

  return (
    <div style={{ textAlign: 'center', height: '300px' }}>
      <h1>Remove Data Validation</h1>
      <button onClick={sheetToSVG}>
        Start
      </button>
    </div>
  );
}

export default App;
Remove data validation 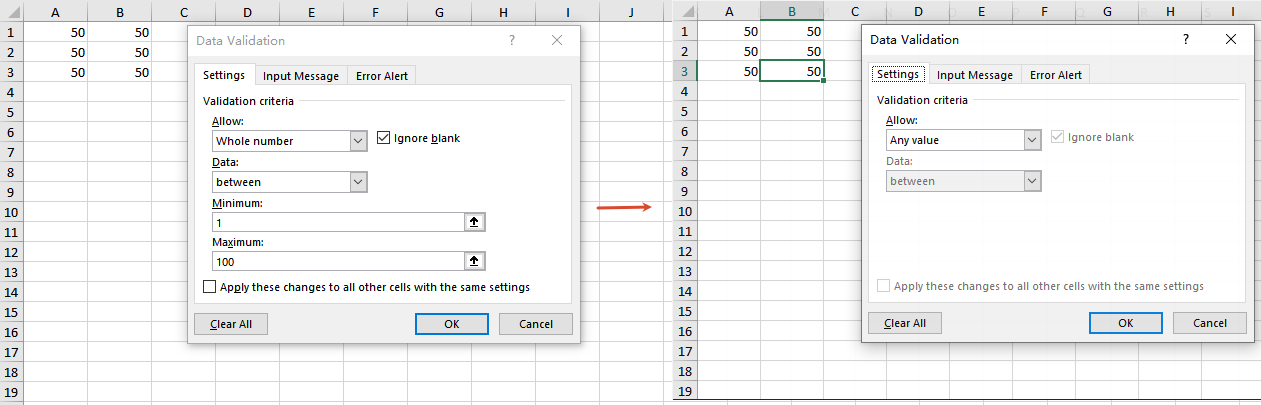
Frequently Asked Questions
The added data validation does not take effect
Cause: Other validation rules already exist on the target cell, or the validation type or comparison operator does not match the requirement.
Solution: Make sure the validation rule is applied to the correct cell range, and check whether the values of properties such as AllowType, CompareOperator, Formula1, and Formula2 meet the expectation.
The result is empty when getting data validation settings
Cause: No data validation is set on the target cell, or the cell range being read does not match the location of the validation.
Solution: Make sure the cell has data validation set, and check whether the cell address referenced by the Range.get method is correct.
Data validation still exists after removal
Cause: The rectangle range passed to the DVTable.Remove method does not cover the actual validation area.
Solution: Adjust the coordinates in the Rectangle.FromLTRB method according to the cell range covered by the validations, ensuring that the rectangle range includes all the cells whose validations need to be removed.
Get a Free License
If you want to remove the evaluation messages in the output documents, or get rid of the feature limitations, please contact our sales team to obtain a free 30-day temporary license.
During daily Excel data processing, filtering is one of the most common ways to quickly locate and view target data. The AutoFilter feature allows users to quickly filter out data rows that match the conditions by clicking the drop-down arrow on the column header, avoiding the need to search manually through large amounts of data. Spire.XLS for JavaScript, powered by WebAssembly, completes this operation directly in the browser, managing input and output files through a Virtual File System (VFS) with no backend service required.
This article covers three key features:
For installation and project configuration, please refer to How to Integrate Spire.XLS for JavaScript in a React Project. The examples below assume that Spire.XLS is already installed and the WebAssembly module has been initialized.
Add AutoFilters
In Excel, the AutoFilter is an important feature for quickly processing large amounts of data. Through the drop-down arrow on the right side of the column header, you can set filter conditions for each column. Spire.XLS for JavaScript provides the AutoFilters.Range property — you can add AutoFilters to a worksheet simply by setting the worksheet's auto-filter range to the cell range of the header row.
function App() {
  const addAutoFilter = async () => {
    // Get the Spire.XLS WASM module
    const xlsModule = window.wasmModule?.spirexls;

    // Check if the module is ready
    if (!xlsModule) {
      alert('Spire.Xls is not ready yet');
      return;
    }

    // Load the font and Excel file into VFS
    await window.spire.FetchFileToVFS('ARIAL.TTF', '/Library/Fonts/', `${process.env.PUBLIC_URL}/font/`);
    const inputFileName = 'FilterData.xlsx';
    await window.spire.FetchFileToVFS(inputFileName, '', `${process.env.PUBLIC_URL}data/`);

    // Load the workbook
    const workbook = new xlsModule.Workbook();
    workbook.LoadFromFile({ fileName: inputFileName });

    // Get the first worksheet
    const sheet = workbook.Worksheets.get(0);

    // Set the auto filter range: columns A to C of the header row
    sheet.AutoFilters.Range = sheet.Range.get("A1:C1");

    // Save the result file, specifying Excel version 2016
    const outputFileName = "AddAutoFilter_output.xlsx";
    workbook.SaveToFile({ fileName: outputFileName, version: xlsModule.ExcelVersion.Version2016 });

    // Dispose of the workbook object to release resources
    workbook.Dispose();

    // Read the converted file from VFS and trigger the download
    const fileArray = window.dotnetRuntime.Module.FS.readFile(outputFileName);
    const blob = new Blob([fileArray], { type: "application/vnd.openxmlformats-officedocument.spreadsheetml.sheet" });
    const url = URL.createObjectURL(blob);
    const a = document.createElement('a');
    a.href = url;
    a.download = outputFileName;
    a.click();
    URL.revokeObjectURL(url);
  };

  return (
    <div style={{ textAlign: 'center', height: '300px' }}>
      <h1>Add AutoFilter</h1>
      <button onClick={addAutoFilter}>
        Start
      </button>
    </div>
  );
}

export default App;
Add AutoFilters 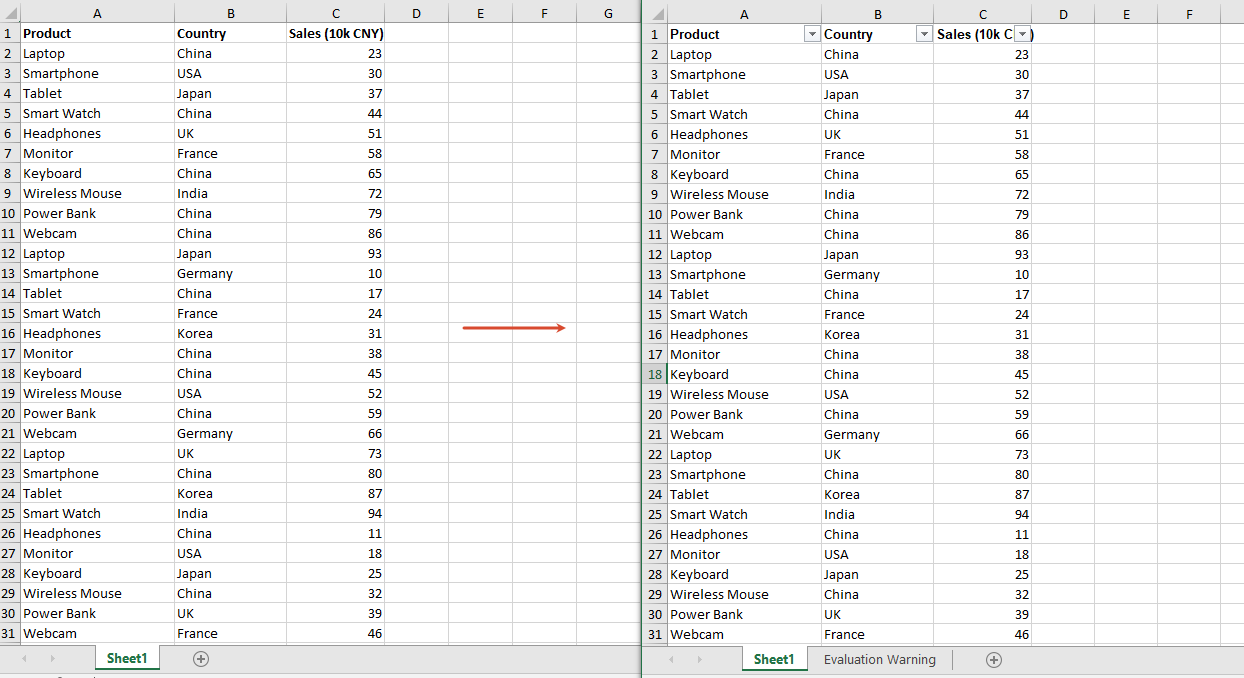
Apply Filter Conditions to Filter Data
After adding AutoFilters, you can also set a custom filter condition for a specified column through the CustomFilter method in code, and then call the Filter method to apply the filter, so that data rows matching the condition are automatically filtered out. For example, the following code sets the filter condition of the second column (Country) to equal "China"; after applying the filter, only data rows whose country is "China" are kept, and the remaining rows are hidden.
function App() {
  const applyFilter = async () => {
    // Get the Spire.XLS WASM module
    const xlsModule = window.wasmModule?.spirexls;

    // Check if the module is ready
    if (!xlsModule) {
      alert('Spire.Xls is not ready yet');
      return;
    }

    // Load the font and Excel file into VFS
    await window.spire.FetchFileToVFS('ARIAL.TTF', '/Library/Fonts/', `${process.env.PUBLIC_URL}/font/`);
    const inputFileName = 'FilterData.xlsx';
    await window.spire.FetchFileToVFS(inputFileName, '', `${process.env.PUBLIC_URL}data/`);

    // Load the workbook
    const workbook = new xlsModule.Workbook();
    workbook.LoadFromFile({ fileName: inputFileName });

    // Get the first worksheet
    const sheet = workbook.Worksheets.get(0);

    // Set the auto filter range: the header and data rows of the second column (Country)
    sheet.AutoFilters.Range = sheet.Range.get("B1:B51");

    // Get the first column of the auto filters
    const filterColumn = sheet.AutoFilters.get(0);

    // Set the custom filter condition: filter rows whose country is "China"
    const strCrt = "China";
    sheet.AutoFilters.CustomFilter({
      column: filterColumn,
      operatorType: xlsModule.FilterOperatorType.Equal,
      criteria: new xlsModule.String(strCrt)
    });

    // Apply the filter
    sheet.AutoFilters.Filter();

    // Save the result file, specifying Excel version 2016
    const outputFileName = "ApplyFilter_output.xlsx";
    workbook.SaveToFile({ fileName: outputFileName, version: xlsModule.ExcelVersion.Version2016 });

    // Dispose of the workbook object to release resources
    workbook.Dispose();

    // Read the converted file from VFS and trigger the download
    const fileArray = window.dotnetRuntime.Module.FS.readFile(outputFileName);
    const blob = new Blob([fileArray], { type: "application/vnd.openxmlformats-officedocument.spreadsheetml.sheet" });
    const url = URL.createObjectURL(blob);
    const a = document.createElement('a');
    a.href = url;
    a.download = outputFileName;
    a.click();
    URL.revokeObjectURL(url);
  };

  return (
    <div style={{ textAlign: 'center', height: '300px' }}>
      <h1>Apply Filter Condition</h1>
      <button onClick={applyFilter}>
        Start
      </button>
    </div>
  );
}

export default App;
Apply Filter Conditions to Filter Data 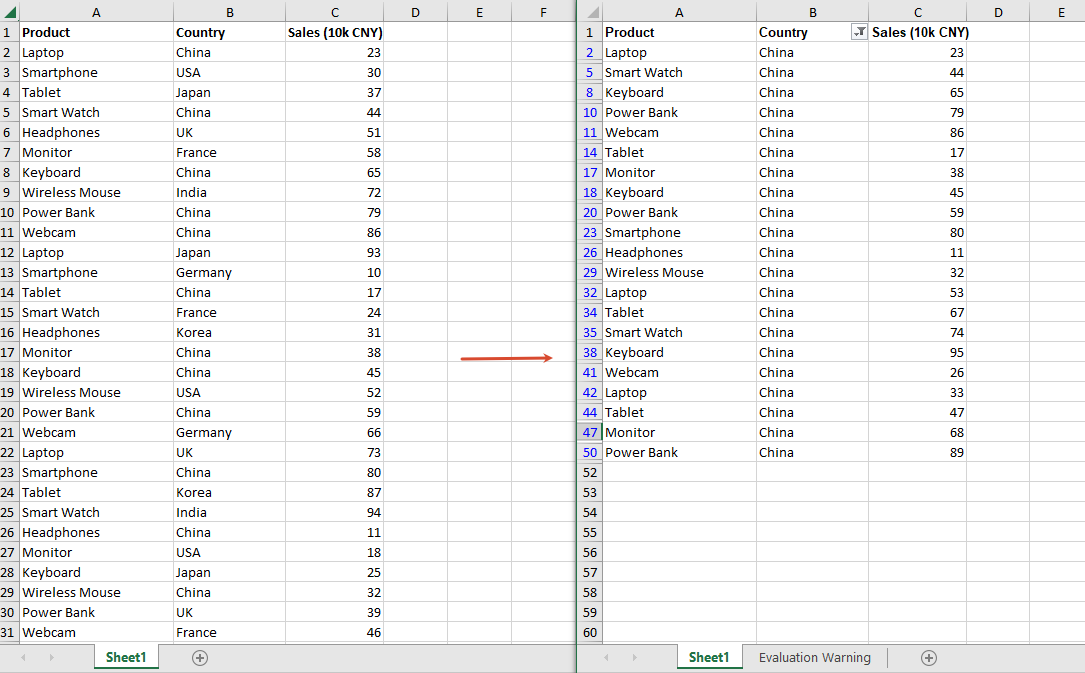
Remove AutoFilters
When you no longer need to filter data, you can remove all AutoFilters from the worksheet through the AutoFilters.Clear method, so that the data is fully displayed again.
function App() {
  const removeAutoFilter = async () => {
    // Get the Spire.XLS WASM module
    const xlsModule = window.wasmModule?.spirexls;

    // Check if the module is ready
    if (!xlsModule) {
      alert('Spire.Xls is not ready yet');
      return;
    }

    // Load the font and Excel file into VFS
    await window.spire.FetchFileToVFS('ARIAL.TTF', '/Library/Fonts/', `${process.env.PUBLIC_URL}/font/`);
    const inputFileName = 'FilteredData.xlsx';
    await window.spire.FetchFileToVFS(inputFileName, '', `${process.env.PUBLIC_URL}data/`);

    // Load the workbook
    const workbook = new xlsModule.Workbook();
    workbook.LoadFromFile({ fileName: inputFileName });

    // Get the first worksheet
    const sheet = workbook.Worksheets.get(0);

    // Remove all AutoFilters from the worksheet
    sheet.AutoFilters.Clear();

    // Save the result file, specifying Excel version 2016
    const outputFileName = "RemoveAutoFilter_output.xlsx";
    workbook.SaveToFile({ fileName: outputFileName, version: xlsModule.ExcelVersion.Version2016 });

    // Dispose of the workbook object to release resources
    workbook.Dispose();

    // Read the converted file from VFS and trigger the download
    const fileArray = window.dotnetRuntime.Module.FS.readFile(outputFileName);
    const blob = new Blob([fileArray], { type: "application/vnd.openxmlformats-officedocument.spreadsheetml.sheet" });
    const url = URL.createObjectURL(blob);
    const a = document.createElement('a');
    a.href = url;
    a.download = outputFileName;
    a.click();
    URL.revokeObjectURL(url);
  };

  return (
    <div style={{ textAlign: 'center', height: '300px' }}>
      <h1>Remove AutoFilter</h1>
      <button onClick={removeAutoFilter}>
        Start
      </button>
    </div>
  );
}

export default App;
Remove AutoFilters 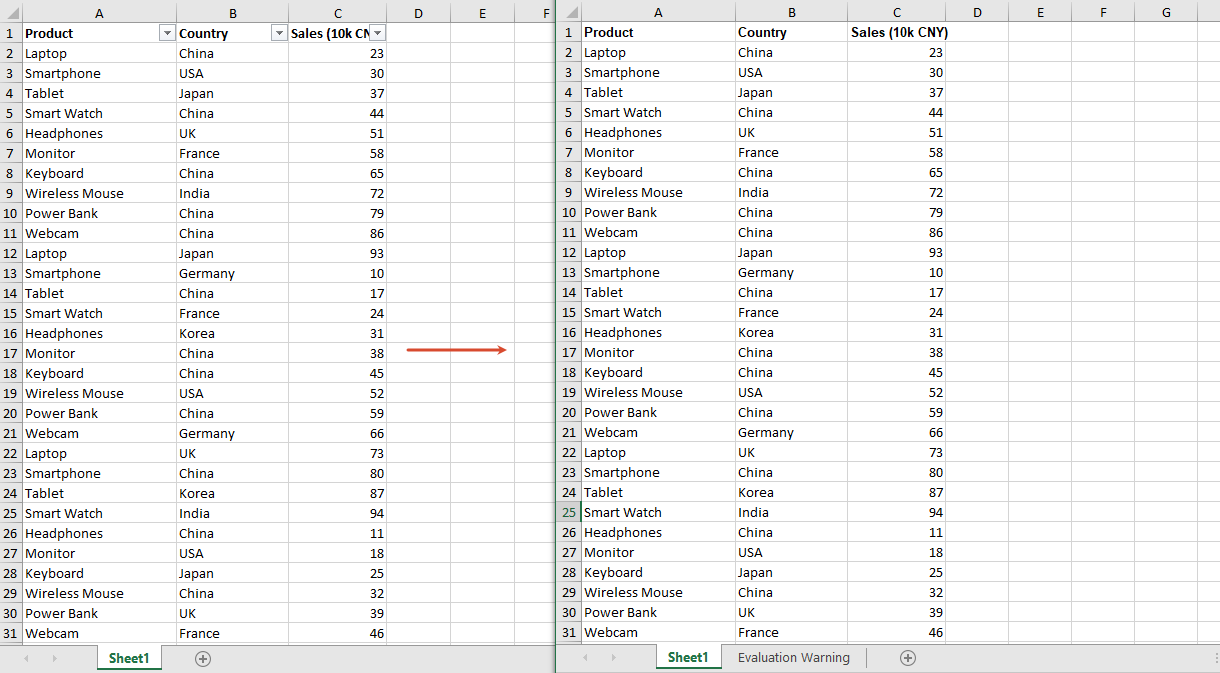
Frequently Asked Questions
Data rows are not hidden after filtering
Reason: The Filter() method was not called to apply the filter after the filter condition was set, or the range set by AutoFilters.Range does not cover the data rows you want to filter.
Solution: Call sheet.AutoFilters.Filter() after setting the filter condition, and make sure AutoFilters.Range covers the header row and all data rows, for example "B1:B51" in the example above.
Filtering by Chinese content fails
Reason: The filter condition is an exact match. If the filter value does not exactly match the cell content (for example, it contains leading or trailing spaces), it will not match.
Solution: Make sure the filter value exactly matches the cell content.
Get a Free License
If you wish to remove the evaluation message from the result documents, or get rid of the feature limitations, please contact sales to get a 30-day temporary license.
