Spire.Presentation supports to work with multiple functions in chart, such as set number format and remove tick marks, format data labels of series. This article will focus on demonstrate how to set the color for datapoints of series in the PowerPoint document in C#.
In the class of ChartDataPoint, it represents a data point on the chart. Developers can access it to set the color, fill type and set the line property, etc. Now let's access to the datapoints to set color for datapoints of series with following code snippet:
Step 1: Create a new instance of Presentation class and load the file that contains the column chart.
Presentation ppt = new Presentation();
ppt.LoadFromFile("sample.pptx ");
Step 2: Get the chart in the document
IChart chart = ppt.Slides[0].Shapes[3] as IChart;
chart.Categories.CategoryLabels = chart.ChartData["A2", "A5"];
chart.Series.SeriesLabel = chart.ChartData["B1", "C1"];
chart.Series[0].Values = chart.ChartData["B2", "B5"];
Step 3: Access datapoints to set the property
ChartDataPoint cdp = new ChartDataPoint(chart.Series[0]);
chart.Series[1].Values = chart.ChartData["C2", "C5"];
cdp.Index = 1;
//set the type of filling
cdp.Fill.FillType = FillFormatType.Solid;
//set the fill color
cdp.Fill.SolidColor.KnownColor = KnownColors.Red;
chart.Series[0].DataPoints.Add(cdp);
Step 4: Save and Launch to view the resulted PPTX file.
ppt.SaveToFile("Accessdatapoint.pptx", FileFormat.Pptx2007);
System.Diagnostics.Process.Start("Accessdatapoint.pptx");
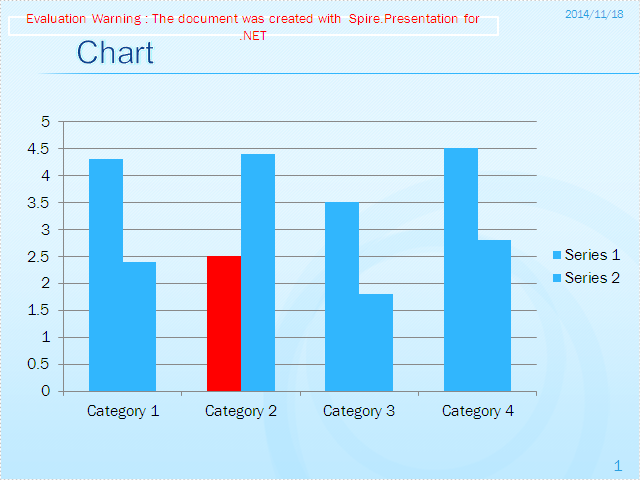
Effective screenshot:
Full codes:
using Spire.Presentation;
using Spire.Presentation.Charts;
using Spire.Presentation.Drawing;

namespace FormatData
{

    class Program
    {
        static void Main(string[] args)
        {

            Presentation ppt = new Presentation();
            ppt.LoadFromFile("sample.pptx ");
            IChart chart = ppt.Slides[0].Shapes[3] as IChart;
            chart.Categories.CategoryLabels = chart.ChartData["A2", "A5"];
            chart.Series.SeriesLabel = chart.ChartData["B1", "C1"];
            chart.Series[0].Values = chart.ChartData["B2", "B5"];

            ChartDataPoint cdp = new ChartDataPoint(chart.Series[0]);
            chart.Series[1].Values = chart.ChartData["C2", "C5"];
            cdp.Index = 1;
            cdp.Fill.FillType = FillFormatType.Solid;
            cdp.Fill.SolidColor.KnownColor = KnownColors.Red;
            chart.Series[0].DataPoints.Add(cdp);

            ppt.SaveToFile("Accessdatapoint.pptx", FileFormat.Pptx2007);
            System.Diagnostics.Process.Start("Accessdatapoint.pptx");

        }
    }
}
