
Microsoft PowerPoint automatically shows the number Format in Arabic number for data cell on chart and it will show tick marks on the value axis and category axis. In order to make the chart more clearly and tidy, we may need to set percentage number format for the data and remove the tick marks. With the help of Spire.Presentation, we can achieve these requirements easily.
Make sure Spire.Presentation for .NET (Version 2.1.7 or above) has been installed correctly and then add Spire.Presentation.dll as reference in the downloaded Bin folder though the below path: "..\Spire.Presentation\Bin\NET4.0\ Spire. Presentation.dll".
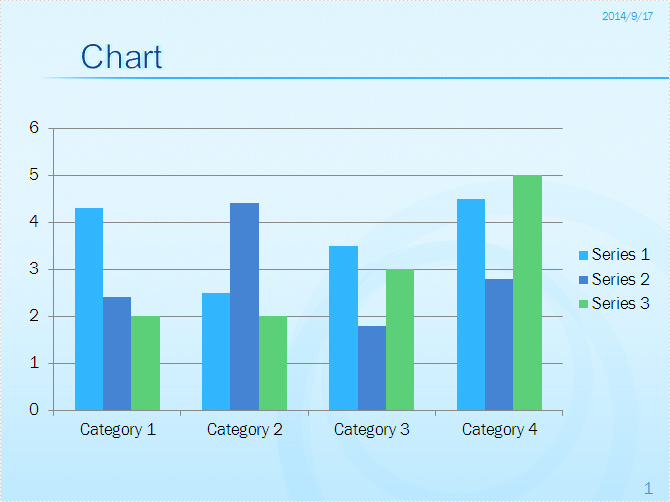
Check the custom chart on presentation slides at first:
Step 1: Create a presentation document and load the file from disk.
Presentation ppt = new Presentation();
ppt.LoadFromFile("sample.pptx");
Step 2: Get the chart that need to be adjust the number format and remove the tick marks.
IChart chart = ppt.Slides[0].Shapes[3] as IChart;
Step 3: Set percentage number format for the axis value of chart.
chart.PrimaryValueAxis.NumberFormat = "0#\\%";
Step 4: Remove the tick marks for value axis and category axis.
chart.PrimaryValueAxis.MajorTickMark = TickMarkType.TickMarkNone;
chart.PrimaryValueAxis.MinorTickMark = TickMarkType.TickMarkNone;
chart.PrimaryCategoryAxis.MajorTickMark = TickMarkType.TickMarkNone;
chart.PrimaryCategoryAxis.MinorTickMark = TickMarkType.TickMarkNone;
Step 5: Save and Launch to view the resulted PPTX file.
ppt.SaveToFile("Result.pptx", FileFormat.Pptx2007);
System.Diagnostics.Process.Start("Result.pptx");
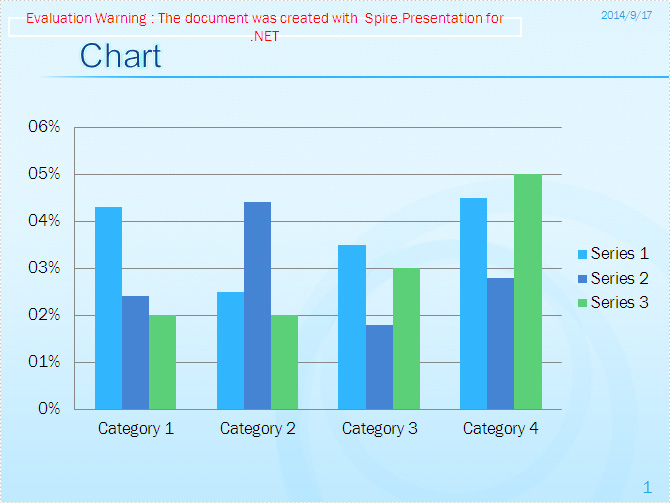
Effective screenshot:
Full codes:
namespace SetNumberFormatforChartData
{
    class Program
    {
        static void Main(string[] args)
        {
            Presentation ppt = new Presentation();
            ppt.LoadFromFile("sample.pptx");
            IChart chart = ppt.Slides[0].Shapes[3] as IChart;
            chart.PrimaryValueAxis.NumberFormat = "0#\\%";

            chart.PrimaryValueAxis.MajorTickMark = TickMarkType.TickMarkNone;
            chart.PrimaryValueAxis.MinorTickMark = TickMarkType.TickMarkNone;

            chart.PrimaryCategoryAxis.MajorTickMark = TickMarkType.TickMarkNone;
            chart.PrimaryCategoryAxis.MinorTickMark = TickMarkType.TickMarkNone;

            ppt.SaveToFile("Result.pptx", FileFormat.Pptx2007);
            System.Diagnostics.Process.Start("Result.pptx");

        }
    }
}
