
A bubble chart is generally used to display the relationship between 3 parameters. For example, you can use bubble chart to show relation between Number of product, Sales volume and Market share. Unlike other charts, a bubble chart does not use a category axis - both horizontal and vertical axes are value axes.
As a powerful component, Spire.Presentation supports to insert various kinds of charts in PowerPoint including bubble chart. In this article, I made an example to show how to create bubble chart with custom data using Spire.Presentation in C#, VB.NET.
Main Steps:
Step 1: Initialize a new instance of Presentation class.
Presentation pres = new Presentation();
Step 2: Insert chart, set chart title and set the type of chart as Bubble.
RectangleF rect1 = new RectangleF(40, 40, 550, 320);
IChart chart = pres.Slides[0].Shapes.AppendChart(ChartType.Bubble, rect1, false);
chart.ChartTitle.TextProperties.Text = "Bubble Chart";
chart.ChartTitle.TextProperties.IsCentered = true;
chart.ChartTitle.Height = 30;
chart.HasTitle = true;
Step 3: Define a group of arrays.
Double[] xdata = new Double[] { 7.7, 8.9, 1.0, 2.4 };
Double[] ydata = new Double[] { 15.2, 5.3, 6.7, 8 };
Double[] size = new Double[] { 1.1, 2.4, 3.7, 4.8 };
Step 4: Attach the data to chart. You can use the property chart.ChartData[rowIndex, columnIndex].Text to get/set the text value, use the property chart.ChartData[rowIndex, columnIndex].Value to get/set numeric value. Here I insert values in predefined arrays to the data chart.
chart.ChartData[0, 0].Text = "X-Value";
chart.ChartData[0, 1].Text = "Y-Value";
chart.ChartData[0, 2].Text = "Size";

for (Int32 i = 0; i < xdata.Length; ++i)
{
    chart.ChartData[i + 1, 0].Value = xdata[i];
    chart.ChartData[i + 1, 1].Value = ydata[i];
    chart.ChartData[i + 1, 2].Value = size[i];
}
Step 5: Set the Series label.
chart.Series.SeriesLabel = chart.ChartData["B1","B1"];
Step 6: Assign data to X axis, Y axis and Bubbles.
chart.Series[0].XValues = chart.ChartData["A2", "A5"];
chart.Series[0].YValues = chart.ChartData["B2", "B5"];
chart.Series[0].Bubbles.Add(chart.ChartData["C2"]);
chart.Series[0].Bubbles.Add(chart.ChartData["C3"]);
chart.Series[0].Bubbles.Add(chart.ChartData["C4"]);
chart.Series[0].Bubbles.Add(chart.ChartData["C5"]);
Step 7: Save and launch the file.
pres.SaveToFile(@"result.pptx", FileFormat.Pptx2010);
System.Diagnostics.Process.Start("result.pptx");
Output:
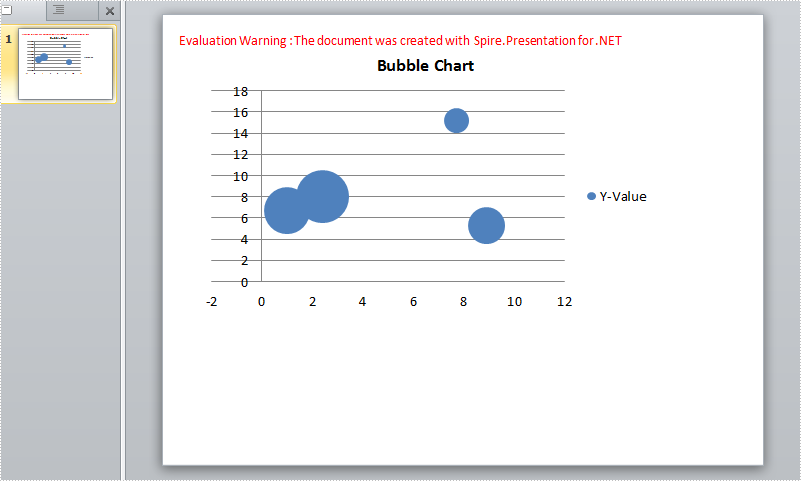
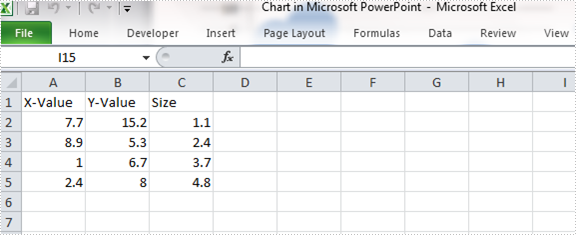
Chart data:
Full Code:
using Spire.Presentation;
using Spire.Presentation.Charts;
using System;
using System.Drawing;

     namespace CreateBubbleChart
{
    class Program
    {
        static void Main(string[] args)
        {
            Presentation pres = new Presentation();
            RectangleF rect1 = new RectangleF(40, 40, 550, 320);
            IChart chart = pres.Slides[0].Shapes.AppendChart(ChartType.Bubble, rect1, false);
            chart.ChartTitle.TextProperties.Text = "Bubble Chart";
            chart.ChartTitle.TextProperties.IsCentered = true;
            chart.ChartTitle.Height = 30;
            chart.HasTitle = true;

            Double[] xdata = new Double[] { 7.7, 8.9, 1.0, 2.4 };
            Double[] ydata = new Double[] { 15.2, 5.3, 6.7, 8 };
            Double[] size = new Double[] { 1.1, 2.4, 3.7, 4.8 };

            chart.ChartData[0, 0].Text = "X-Value";
            chart.ChartData[0, 1].Text = "Y-Value";
            chart.ChartData[0, 2].Text = "Size";

            for (Int32 i = 0; i < xdata.Length; ++i)
            {
                chart.ChartData[i + 1, 0].Value = xdata[i];
                chart.ChartData[i + 1, 1].Value = ydata[i];
                chart.ChartData[i + 1, 2].Value = size[i];
            }

            chart.Series.SeriesLabel = chart.ChartData["B1", "B1"];

            chart.Series[0].XValues = chart.ChartData["A2", "A5"];
            chart.Series[0].YValues = chart.ChartData["B2", "B5"];
            chart.Series[0].Bubbles.Add(chart.ChartData["C2"]);
            chart.Series[0].Bubbles.Add(chart.ChartData["C3"]);
            chart.Series[0].Bubbles.Add(chart.ChartData["C4"]);
            chart.Series[0].Bubbles.Add(chart.ChartData["C5"]);

            pres.SaveToFile(@"result.pptx", FileFormat.Pptx2010);
            System.Diagnostics.Process.Start("result.pptx");

        }
    }
}
Imports Spire.Presentation
Imports Spire.Presentation.Charts
Imports System.Drawing

Namespace CreateBubbleChart
	Class Program
		Private Shared Sub Main(args As String())
			Dim pres As New Presentation()
			Dim rect1 As New RectangleF(40, 40, 550, 320)
			Dim chart As IChart = pres.Slides(0).Shapes.AppendChart(ChartType.Bubble, rect1, False)
			chart.ChartTitle.TextProperties.Text = "Bubble Chart"
			chart.ChartTitle.TextProperties.IsCentered = True
			chart.ChartTitle.Height = 30
			chart.HasTitle = True

			Dim xdata As [Double]() = New [Double]() {7.7, 8.9, 1.0, 2.4}
			Dim ydata As [Double]() = New [Double]() {15.2, 5.3, 6.7, 8}
			Dim size As [Double]() = New [Double]() {1.1, 2.4, 3.7, 4.8}

			chart.ChartData(0, 0).Text = "X-Value"
			chart.ChartData(0, 1).Text = "Y-Value"
			chart.ChartData(0, 2).Text = "Size"

			For i As Int32 = 0 To xdata.Length - 1
				chart.ChartData(i + 1, 0).Value = xdata(i)
				chart.ChartData(i + 1, 1).Value = ydata(i)
				chart.ChartData(i + 1, 2).Value = size(i)
			Next

			chart.Series.SeriesLabel = chart.ChartData("B1", "B1")

			chart.Series(0).XValues = chart.ChartData("A2", "A5")
			chart.Series(0).YValues = chart.ChartData("B2", "B5")
			chart.Series(0).Bubbles.Add(chart.ChartData("C2"))
			chart.Series(0).Bubbles.Add(chart.ChartData("C3"))
			chart.Series(0).Bubbles.Add(chart.ChartData("C4"))
			chart.Series(0).Bubbles.Add(chart.ChartData("C5"))

			pres.SaveToFile("result.pptx", FileFormat.Pptx2010)
			System.Diagnostics.Process.Start("result.pptx")

		End Sub
	End Class
End Namespace
