
Spire.Presentation supports to set the default position (e.g. Outside End, Center, Inside End, Inside base etc.) of data labels through ChartDataLabel.Position property, it also supports to set custom position of data labels using "ChartDataLabel.X" and "ChartDataLabel.Y" properties. This article is going to elaborate how we can set default and custom position of data labels using Spire.Presentation.
Detail steps:
Step 1: Initialize a Presentation object and load the PowerPoint file.
Presentation ppt = new Presentation();
ppt.LoadFromFile(@"Input.pptx");
Step 2: Get the chart.
IChart chart = ppt.Slides[0].Shapes[0] as IChart;
Step 3: Add data label to the chart and set its id.
ChartDataLabel label1 = chart.Series[0].DataLabels.Add();
label1.ID = 0;
Step 4: Set the position of data label.
//Set the default position of data label. This position is relative to the data markers.
//label1.Position = ChartDataLabelPosition.OutsideEnd;

//Set custom position of data label. This position is relative to the default position.
label1.X = 0.1f;
label1.Y = -0.1f;
Step 5: Set the properties of data label.
//Set label value visible
label1.LabelValueVisible = true;
//Set legend key invisible
label1.LegendKeyVisible = false;
//Set category name invisible
label1.CategoryNameVisible = false;
//Set series name invisible
label1.SeriesNameVisible = false;
//Set Percentage invisible
label1.PercentageVisible = false;

//Set border style and fill style of data label
label1.Line.FillType = Spire.Presentation.Drawing.FillFormatType.Solid;
label1.Line.SolidFillColor.Color = Color.Blue;
label1.Fill.FillType = Spire.Presentation.Drawing.FillFormatType.Solid;
label1.Fill.SolidColor.Color = Color.Orange;
Step 6: Save the file.
ppt.SaveToFile(@"Output.pptx", FileFormat.Pptx2013);
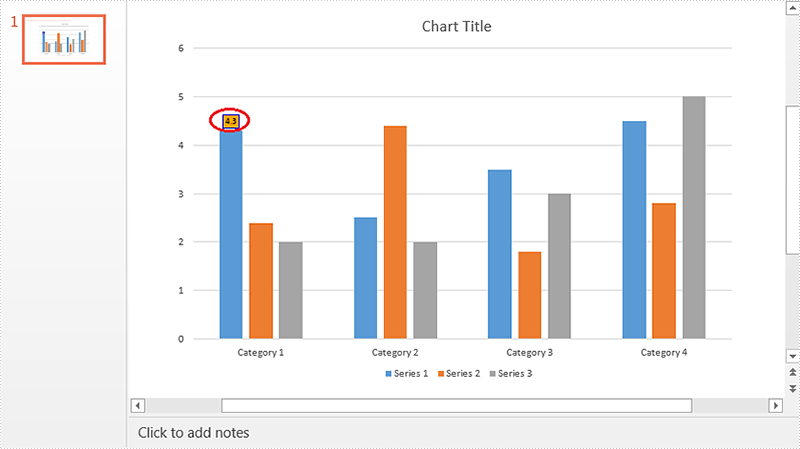
Screenshot:
Default position (Outside End):
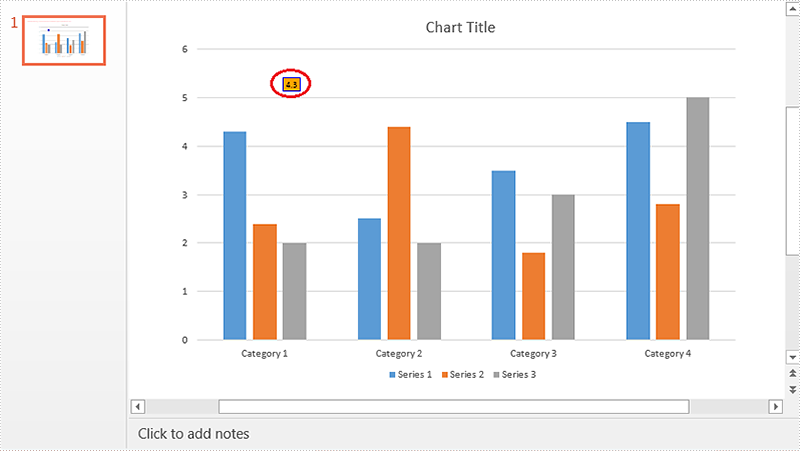
Custom position:
Full code:
using Spire.Presentation;
using Spire.Presentation.Charts;
using System.Drawing;

namespace Set_Position_of_Chart_Data_Label_in_PPT
{
    class Program
    {
        static void Main(string[] args)
        {
            //Initialize a Presentation object
            Presentation ppt = new Presentation();
            //Load the PowerPoint file
            ppt.LoadFromFile(@"Input.pptx");

            //Get the chart
            IChart chart = ppt.Slides[0].Shapes[0] as IChart;

            //Add data label to chart and set its id
            ChartDataLabel label1 = chart.Series[0].DataLabels.Add();
            label1.ID = 0;

            //Set the default position of data label. This position is relative to the data markers.
            //label1.Position = ChartDataLabelPosition.OutsideEnd;

            //Set custom position of data label. This position is relative to the default position.
            label1.X = 0.1f;
            label1.Y = -0.1f;

            //Set label value visible
            label1.LabelValueVisible = true;
            //Set legend key invisible
            label1.LegendKeyVisible = false;
            //Set category name invisible
            label1.CategoryNameVisible = false;
            //Set series name invisible
            label1.SeriesNameVisible = false;
            //Set Percentage invisible
            label1.PercentageVisible = false;

            //Set border style and fill style of data label
            label1.Line.FillType = Spire.Presentation.Drawing.FillFormatType.Solid;
            label1.Line.SolidFillColor.Color = Color.Blue;
            label1.Fill.FillType = Spire.Presentation.Drawing.FillFormatType.Solid;
            label1.Fill.SolidColor.Color = Color.Orange;

            //Save the file
            ppt.SaveToFile(@"Output.pptx", FileFormat.Pptx2013);
        }
    }
}
