
Inserting charts to your PPT document is an easy and eye catching way to display important information. Spire.Presentation includes many different types of data charts including column charts, cylinder charts, cone charts, pyramid charts, clustered charts, line charts, pie charts, bar charts, area charts, scatter charts, stock charts, surface charts, contour charts, doughnut charts, bubble charts and radar charts.
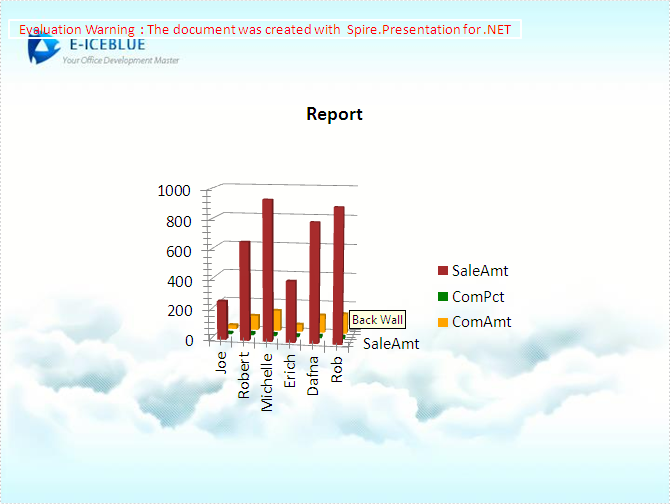
Spire.Presentation for .NET, a reliable .NET PPT component, enables you to generate, read, edit, convert even print your PPT documents without installing Microsoft PowerPoint on your machine. Using Spire.Presentation for .NET, you also can insert charts in your PPT document with C#. Please see the target PPT document with chart as below picture:
The steps of method are:
Step 1: Create the PPT document.
Presentation presentation = new Presentation();
Step 2: Insert chart, set title and style of the chart.
RectangleF rect = new RectangleF(presentation.SlideSize.Size.Width / 2 - 200, 100, 400, 400);
IChart chart = presentation.Slides[0].Shapes.AppendChart(Spire.Presentation.Charts.ChartType.Cylinder3DClustered, rect);
chart.ChartTitle.TextProperties.Text = "Report";
chart.ChartTitle.TextProperties.IsCentered = true;
chart.ChartTitle.Height = 30;
chart.HasTitle = true;
Step 3: Prepare data for the chart. Load a simple DataTable from XML file via LoadData() method.
DataTable dataTable = LoadData();
private DataTable LoadData()
{
    DataSet ds = new DataSet();
    ds.ReadXmlSchema("data-schema.xml");
    ds.ReadXml("data.xml");
    return ds.Tables[0];
}
Step 4: Attach the data to chart. We can use chart.ChartData[rowIndex, columnIndex] to get/set the value of the specified cell in the data table of chart. Using the property chart.ChartData[rowIndex, columnIndex].Text to get/set the text value. Using the property chart.ChartData[rowIndex, columnIndex].Value to get/set numeric value. In this article we define a method InitChartData to attach the Data of the chart.
private void InitChartData(IChart chart, DataTable dataTable)
{
    for (int c = 0; c < dataTable.Columns.Count; c++)
    {
        chart.ChartData[0, c].Text = dataTable.Columns[c].Caption;
    }

    for (int r = 0; r < dataTable.Rows.Count; r++)
    {
        object[] data = dataTable.Rows[r].ItemArray;
        for (int c = 0; c < data.Length; c++)
        {
            chart.ChartData[r + 1, c].Value = data[c];
        }
    }
}
Step 5: Set the Series label and Category label.
chart.Series.SeriesLabel = chart.ChartData["B1", "D1"];
chart.Categories.CategoryLabels = chart.ChartData["A2", "A7"];
Step 6: Assign data to each Series and set each Series' fill color.
chart.Series[0].Values = chart.ChartData["B2", "B7"];
chart.Series[0].Fill.FillType = FillFormatType.Solid;
chart.Series[0].Fill.SolidColor.KnownColor = KnownColors.Brown;
chart.Series[1].Values = chart.ChartData["C2", "C7"];
chart.Series[1].Fill.FillType = FillFormatType.Solid;
chart.Series[1].Fill.SolidColor.KnownColor = KnownColors.Green;
chart.Series[2].Values = chart.ChartData["D2", "D7"];
chart.Series[2].Fill.FillType = FillFormatType.Solid;
chart.Series[2].Fill.SolidColor.KnownColor = KnownColors.Orange;
Step 7: Set the 3D rotation.
chart.RotationThreeD.XDegree = 10;
chart.RotationThreeD.YDegree = 10;
Step 8: Save the document.
presentation.SaveToFile("chart.pptx", FileFormat.Pptx2010);
Download and install Spire.Presentation for .NET and use below code to experience this method to insert charts in PPT document.
The full code:
using Spire.Presentation;
using Spire.Presentation.Charts;
using Spire.Presentation.Drawing;
using System;
using System.Data;
using System.Drawing;

namespace InsertChart
{

    class Program
    {


        private void btnRun_Click(object sender, EventArgs e)
        {
            //create PPT document
            Presentation presentation = new Presentation();

            //set background Image
            string ImageFile = "bg.png";
            RectangleF rect2 = new RectangleF(0, 0, presentation.SlideSize.Size.Width, presentation.SlideSize.Size.Height);
            presentation.Slides[0].Shapes.AppendEmbedImage(ShapeType.Rectangle, ImageFile, rect2);
            presentation.Slides[0].Shapes[0].Line.FillFormat.SolidFillColor.Color = Color.FloralWhite;

            //insert chart
            RectangleF rect = new RectangleF(presentation.SlideSize.Size.Width / 2 - 200, 100, 400, 400);
            IChart chart = presentation.Slides[0].Shapes.AppendChart(Spire.Presentation.Charts.ChartType.Cylinder3DClustered, rect);

            //add chart Title
            chart.ChartTitle.TextProperties.Text = "Report";
            chart.ChartTitle.TextProperties.IsCentered = true;
            chart.ChartTitle.Height = 30;
            chart.HasTitle = true;

            //load data from XML file to datatable
            DataTable dataTable = LoadData();
            //load data from datatable to chart
            InitChartData(chart, dataTable);
            chart.Series.SeriesLabel = chart.ChartData["B1", "D1"];
            chart.Categories.CategoryLabels = chart.ChartData["A2", "A7"];
            chart.Series[0].Values = chart.ChartData["B2", "B7"];
            chart.Series[0].Fill.FillType = FillFormatType.Solid;
            chart.Series[0].Fill.SolidColor.KnownColor = KnownColors.Brown;
            chart.Series[1].Values = chart.ChartData["C2", "C7"];
            chart.Series[1].Fill.FillType = FillFormatType.Solid;
            chart.Series[1].Fill.SolidColor.KnownColor = KnownColors.Green;
            chart.Series[2].Values = chart.ChartData["D2", "D7"];
            chart.Series[2].Fill.FillType = FillFormatType.Solid;
            chart.Series[2].Fill.SolidColor.KnownColor = KnownColors.Orange;
            //set the 3D rotation
            chart.RotationThreeD.XDegree = 10;
            chart.RotationThreeD.YDegree = 10;
            //save the document
            presentation.SaveToFile("chart.pptx", FileFormat.Pptx2010);
            System.Diagnostics.Process.Start("chart.pptx");

        }

        //function to load data from XML file to DataTable
        private DataTable LoadData()
        {
            DataSet ds = new DataSet();
            ds.ReadXmlSchema("data-schema.xml");
            ds.ReadXml("data.xml");
            return ds.Tables[0];
        }

        //function to load data from DataTable to IChart
        private void InitChartData(IChart chart, DataTable dataTable)
        {
            for (int c = 0; c < dataTable.Columns.Count; c++)
            {
                chart.ChartData[0, c].Text = dataTable.Columns[c].Caption;
            }
            for (int r = 0; r < dataTable.Rows.Count; r++)
            {
                object[] data = dataTable.Rows[r].ItemArray;
                for (int c = 0; c < data.Length; c++)
                {
                    chart.ChartData[r + 1, c].Value = data[c];
                }
            }
        }

    }
}
Imports Spire.Presentation
Imports Spire.Presentation.Charts
Imports Spire.Presentation.Drawing
Imports System.Data
Imports System.Drawing

Namespace InsertChart

	Class Program


		Private Sub btnRun_Click(sender As Object, e As EventArgs)
			'create PPT document
			Dim presentation As New Presentation()

			'set background Image
			Dim ImageFile As String = "bg.png"
			Dim rect2 As New RectangleF(0, 0, presentation.SlideSize.Size.Width, presentation.SlideSize.Size.Height)
			presentation.Slides(0).Shapes.AppendEmbedImage(ShapeType.Rectangle, ImageFile, rect2)
			presentation.Slides(0).Shapes(0).Line.FillFormat.SolidFillColor.Color = Color.FloralWhite

			'insert chart
			Dim rect As New RectangleF(presentation.SlideSize.Size.Width / 2 - 200, 100, 400, 400)
			Dim chart As IChart = presentation.Slides(0).Shapes.AppendChart(Spire.Presentation.Charts.ChartType.Cylinder3DClustered, rect)

			'add chart Title
			chart.ChartTitle.TextProperties.Text = "Report"
			chart.ChartTitle.TextProperties.IsCentered = True
			chart.ChartTitle.Height = 30
			chart.HasTitle = True

			'load data from XML file to datatable
			Dim dataTable As DataTable = LoadData()
			'load data from datatable to chart
			InitChartData(chart, dataTable)
			chart.Series.SeriesLabel = chart.ChartData("B1", "D1")
			chart.Categories.CategoryLabels = chart.ChartData("A2", "A7")
			chart.Series(0).Values = chart.ChartData("B2", "B7")
			chart.Series(0).Fill.FillType = FillFormatType.Solid
			chart.Series(0).Fill.SolidColor.KnownColor = KnownColors.Brown
			chart.Series(1).Values = chart.ChartData("C2", "C7")
			chart.Series(1).Fill.FillType = FillFormatType.Solid
			chart.Series(1).Fill.SolidColor.KnownColor = KnownColors.Green
			chart.Series(2).Values = chart.ChartData("D2", "D7")
			chart.Series(2).Fill.FillType = FillFormatType.Solid
			chart.Series(2).Fill.SolidColor.KnownColor = KnownColors.Orange
			'set the 3D rotation
			chart.RotationThreeD.XDegree = 10
			chart.RotationThreeD.YDegree = 10
			'save the document
			presentation.SaveToFile("chart.pptx", FileFormat.Pptx2010)
			System.Diagnostics.Process.Start("chart.pptx")

		End Sub

		'function to load data from XML file to DataTable
		Private Function LoadData() As DataTable
			Dim ds As New DataSet()
			ds.ReadXmlSchema("data-schema.xml")
			ds.ReadXml("data.xml")
			Return ds.Tables(0)
		End Function

		'function to load data from DataTable to IChart
		Private Sub InitChartData(chart As IChart, dataTable As DataTable)
			For c As Integer = 0 To dataTable.Columns.Count - 1
				chart.ChartData(0, c).Text = dataTable.Columns(c).Caption
			Next
			For r As Integer = 0 To dataTable.Rows.Count - 1
				Dim data As Object() = dataTable.Rows(r).ItemArray
				For c As Integer = 0 To data.Length - 1
					chart.ChartData(r + 1, c).Value = data(c)
				Next
			Next
		End Sub

	End Class
End Namespace
