The real dividers in a spreadsheet are not blank cells but borders: financial reports use lines of different weights to separate the header row from the totals, while data handed to a downstream system has to go out with the frames stripped off. Doing that by hand — selecting each block and opening Format Cells — is slow and hard to repeat. Spire.XLS for JavaScript does the same work in the browser on top of WebAssembly, using a virtual file system (VFS) for input and output files, so no back-end service is needed.
This article covers four feature points:
- Add a border to a selected cell or a cell range
- Add a border to the range that holds the data
- Add left, top, right, bottom and diagonal borders to a cell
- Remove the borders of a cell or a cell range
For installation and project setup, see Integrating Spire.XLS for JavaScript in a React Project. The examples below assume Spire.XLS is installed and the WebAssembly module has been initialised.
Add a border to a selected cell or a cell range
Given a table with no lines at all, the most direct approach is to put the frame back with BorderAround and BorderInside: the first one draws the outline, the second one the grid lines inside the range. Together they frame a whole block of data in one go, and they can also single out one cell — the header cell, say — so that it stands out from a sheet full of identical lines.
The steps are:
- Take the cell range you want to frame with
Range.get, by address - Call
BorderAroundto draw the outline, with the line style taken from theLineStyleTypeenumeration - Call
BorderInsideto add the separators between the cells inside the range - Take the header cell on its own and call
BorderAroundagain on it, this time with a medium line
The line style is passed in object notation, as { borderLine }.
function App() {
  const addBorderToCells = async () => {
    // Get the Spire.XLS WASM module
    const xlsModule = window.wasmModule?.spirexls;

    // Check that the module is ready
    if (!xlsModule) {
      alert('Spire.Xls is not ready yet');
      return;
    }

    // Load the font and the input file into the VFS
    await window.spire.FetchFileToVFS('ARIAL.TTF', '/Library/Fonts/', `${process.env.PUBLIC_URL}/font/`);
    const inputFileName = 'CellBorders.xlsx';
    await window.spire.FetchFileToVFS(inputFileName, '', `${process.env.PUBLIC_URL}data/`);

    // Load the workbook and take the first worksheet
    const workbook = new xlsModule.Workbook();
    workbook.LoadFromFile({ fileName: inputFileName });
    const sheet = workbook.Worksheets.get(0);

    // Take the B2:E6 range, frame it with thin lines and add thin inner lines
    const dataRange = sheet.Range.get('B2:E6');
    dataRange.BorderAround({ borderLine: xlsModule.LineStyleType.Thin });
    dataRange.BorderInside({ borderLine: xlsModule.LineStyleType.Thin });

    // Give the B2 header cell a medium border on all four sides
    sheet.Range.get('B2').BorderAround({ borderLine: xlsModule.LineStyleType.Medium });

    // Save the result file
    const outputFileName = 'AddBorderToCells.xlsx';
    workbook.SaveToFile({ fileName: outputFileName, version: xlsModule.ExcelVersion.Version2010 });

    // Dispose of the workbook object to free resources
    workbook.Dispose();

    // Read the result file back out of the VFS and download it
    const fileArray = window.dotnetRuntime.Module.FS.readFile(outputFileName);
    const blob = new Blob([fileArray], { type: 'application/vnd.openxmlformats-officedocument.spreadsheetml.sheet' });
    const url = URL.createObjectURL(blob);
    const a = document.createElement('a');
    a.href = url;
    a.download = outputFileName;
    a.click();
    URL.revokeObjectURL(url);
  };

  return (
    <div style={{ textAlign: 'center', height: '300px' }}>
      <h1>Add or Remove Cell Borders</h1>
      <button onClick={addBorderToCells}>Add a border to a cell or range</button>
    </div>
  );
}

export default App;
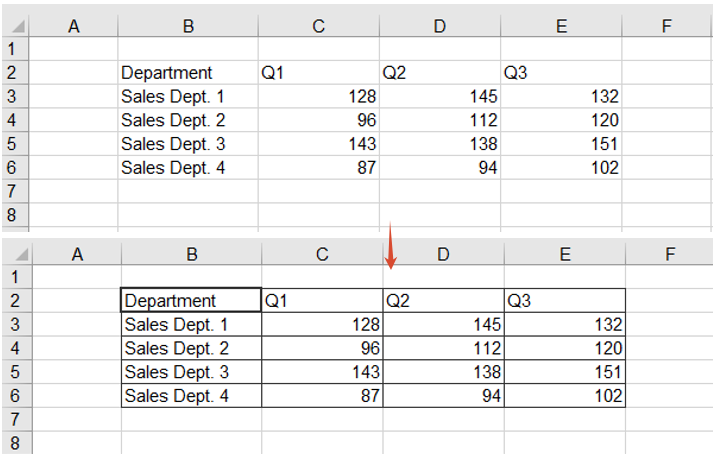
The effect of adding a border to the data range and to the header cell:
Add a border to the range that holds the data
The previous section hard-codes the address B2:E6, which has to be edited as soon as rows or columns are added to the table. The AllocatedRange property returns the allocated range of a worksheet — the rectangle that actually holds the data — so the address maintains itself, and the outline can be given a different style from the header frame to set the table apart from the text around it.
The steps are:
- Get the range that holds the data through
AllocatedRange, with no address to maintain - Call
BorderAroundwith a medium dashed line, so the outline contrasts with the solid frames used elsewhere - Call
BorderInsideto add thin lines inside the range, keeping the rows separated
function App() {
  const addBorderToDataRange = async () => {
    const xlsModule = window.wasmModule?.spirexls;
    if (!xlsModule) {
      alert('Spire.Xls is not ready yet');
      return;
    }

    await window.spire.FetchFileToVFS('ARIAL.TTF', '/Library/Fonts/', `${process.env.PUBLIC_URL}/font/`);
    const inputFileName = 'CellBorders.xlsx';
    await window.spire.FetchFileToVFS(inputFileName, '', `${process.env.PUBLIC_URL}data/`);

    const workbook = new xlsModule.Workbook();
    workbook.LoadFromFile({ fileName: inputFileName });
    const sheet = workbook.Worksheets.get(0);

    // AllocatedRange returns the range that holds the data, so no address is needed
    const dataRange = sheet.AllocatedRange;

    // Give the outline a medium dashed border and the inside thin lines
    dataRange.BorderAround({ borderLine: xlsModule.LineStyleType.MediumDashed });
    dataRange.BorderInside({ borderLine: xlsModule.LineStyleType.Thin });

    const outputFileName = 'AddBorderToDataRange.xlsx';
    workbook.SaveToFile({ fileName: outputFileName, version: xlsModule.ExcelVersion.Version2010 });
    workbook.Dispose();

    const fileArray = window.dotnetRuntime.Module.FS.readFile(outputFileName);
    const blob = new Blob([fileArray], { type: 'application/vnd.openxmlformats-officedocument.spreadsheetml.sheet' });
    const url = URL.createObjectURL(blob);
    const a = document.createElement('a');
    a.href = url;
    a.download = outputFileName;
    a.click();
    URL.revokeObjectURL(url);
  };

  return (
    <div style={{ textAlign: 'center', height: '300px' }}>
      <h1>Add or Remove Cell Borders</h1>
      <button onClick={addBorderToDataRange}>Add a border to the data range</button>
    </div>
  );
}

export default App;
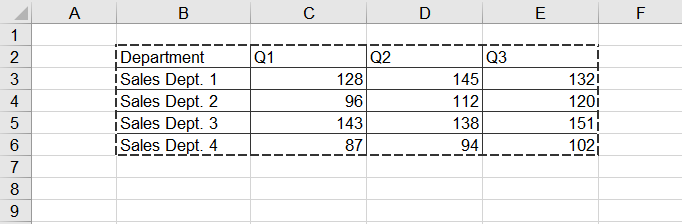
The effect of adding a dashed outline and thin inner lines to the data range:
Add left, top, right, bottom and diagonal borders to a cell
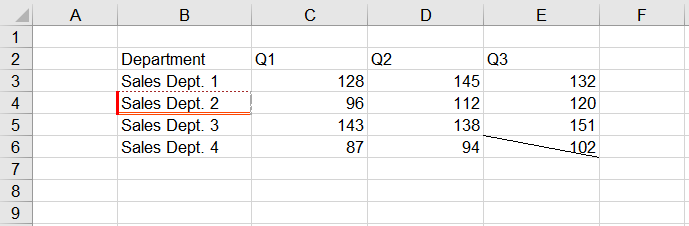
BorderAround gives all four edges the same style, which is not enough when the requirement is "a thick red line on the left and a double line along the bottom". Handling the edges one at a time solves it: Borders.get takes a single edge by its BordersLineType member, and its LineStyle and Color can then be set independently, so every edge can have its own line style and colour. The two diagonal directions are available the same way.
The steps are:
- Take the cell to style with
Range.get - Take the left, top, right and bottom edges through
Borders.get(BordersLineType.EdgeLeft)and its siblings - Set
LineStyleon each edge, using a thick line, a dotted line, a slanted dash-dot line and a double line - Set
Coloron each edge, using red, brown, dark grey and orange red - Take another cell, fetch its diagonal-down edge with
BordersLineType.DiagonalDownand set its line style
function App() {
  const addEdgeBorders = async () => {
    const xlsModule = window.wasmModule?.spirexls;
    if (!xlsModule) {
      alert('Spire.Xls is not ready yet');
      return;
    }

    await window.spire.FetchFileToVFS('ARIAL.TTF', '/Library/Fonts/', `${process.env.PUBLIC_URL}/font/`);
    const inputFileName = 'CellBorders.xlsx';
    await window.spire.FetchFileToVFS(inputFileName, '', `${process.env.PUBLIC_URL}data/`);

    const workbook = new xlsModule.Workbook();
    workbook.LoadFromFile({ fileName: inputFileName });
    const sheet = workbook.Worksheets.get(0);

    // Give each of the four edges of B4 its own line style and colour
    const cell = sheet.Range.get('B4');
    const edgeSpecs = [
      ['EdgeLeft', xlsModule.LineStyleType.Thick, xlsModule.Color.get_Red()],
      ['EdgeTop', xlsModule.LineStyleType.Dotted, xlsModule.Color.get_Brown()],
      ['EdgeRight', xlsModule.LineStyleType.SlantedDashDot, xlsModule.Color.get_DarkGray()],
      ['EdgeBottom', xlsModule.LineStyleType.Double, xlsModule.Color.get_OrangeRed()],
    ];
    for (const [edge, lineStyle, color] of edgeSpecs) {
      const border = cell.Borders.get(xlsModule.BordersLineType[edge]);
      border.LineStyle = lineStyle;
      border.Color = color;
    }

    // Add a diagonal-down border to E6
    const diagonal = sheet.Range.get('E6').Borders.get(xlsModule.BordersLineType.DiagonalDown);
    diagonal.LineStyle = xlsModule.LineStyleType.Thin;

    const outputFileName = 'AddEdgeBorders.xlsx';
    workbook.SaveToFile({ fileName: outputFileName, version: xlsModule.ExcelVersion.Version2010 });
    workbook.Dispose();

    const fileArray = window.dotnetRuntime.Module.FS.readFile(outputFileName);
    const blob = new Blob([fileArray], { type: 'application/vnd.openxmlformats-officedocument.spreadsheetml.sheet' });
    const url = URL.createObjectURL(blob);
    const a = document.createElement('a');
    a.href = url;
    a.download = outputFileName;
    a.click();
    URL.revokeObjectURL(url);
  };

  return (
    <div style={{ textAlign: 'center', height: '300px' }}>
      <h1>Add or Remove Cell Borders</h1>
      <button onClick={addEdgeBorders}>Set the four edges and a diagonal</button>
    </div>
  );
}

export default App;
The effect of styling the four edges of a cell and adding a diagonal line:
Remove the borders of a cell or a cell range
When an internal report goes out to a customer, or its data is fed to a downstream system, borders are often just noise: they make the data look like a finished report, and a parser that walks the sheet region by region can pick them up as content. Removing them is as simple as setting them — assign LineStyleType.None to the range's Borders.LineStyle and every line inside it goes at once.
The steps are:
- Take the worksheet that holds the framed report
- Take the cell range to clean up with
Range.get - Set the range's
Borders.LineStyletoLineStyleType.None, clearing every border inside it
function App() {
  const removeBorders = async () => {
    const xlsModule = window.wasmModule?.spirexls;
    if (!xlsModule) {
      alert('Spire.Xls is not ready yet');
      return;
    }

    await window.spire.FetchFileToVFS('ARIAL.TTF', '/Library/Fonts/', `${process.env.PUBLIC_URL}/font/`);
    const inputFileName = 'CellBorders.xlsx';
    await window.spire.FetchFileToVFS(inputFileName, '', `${process.env.PUBLIC_URL}data/`);

    const workbook = new xlsModule.Workbook();
    workbook.LoadFromFile({ fileName: inputFileName });

    // The second worksheet holds the same report, already framed with borders
    const sheet = workbook.Worksheets.get(1);

    // Set every border in the B2:E6 range to None
    sheet.Range.get('B2:E6').Borders.LineStyle = xlsModule.LineStyleType.None;

    const outputFileName = 'RemoveBorders.xlsx';
    workbook.SaveToFile({ fileName: outputFileName, version: xlsModule.ExcelVersion.Version2010 });
    workbook.Dispose();

    const fileArray = window.dotnetRuntime.Module.FS.readFile(outputFileName);
    const blob = new Blob([fileArray], { type: 'application/vnd.openxmlformats-officedocument.spreadsheetml.sheet' });
    const url = URL.createObjectURL(blob);
    const a = document.createElement('a');
    a.href = url;
    a.download = outputFileName;
    a.click();
    URL.revokeObjectURL(url);
  };

  return (
    <div style={{ textAlign: 'center', height: '300px' }}>
      <h1>Add or Remove Cell Borders</h1>
      <button onClick={removeBorders}>Remove cell borders</button>
    </div>
  );
}

export default App;
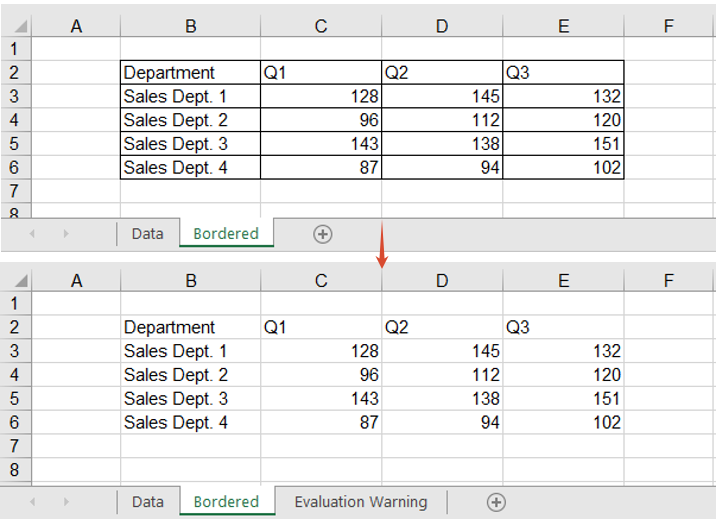
The effect of clearing every border inside the range:
FAQ
Setting a top edge on a whole range puts a line above every row
Cause: Borders.get(BordersLineType.EdgeTop) returns the top edge of every cell in the range, not the outline of the range itself. Used on B2:E6 as it stands, every row inside the range gets a top edge of its own, so four extra lines appear in the middle of the table.
Solution: narrow the range to a single row or column, and the edge that comes back sits on the outline. Take the top from the first row, the bottom from the last row, the left from the first column and the right from the last column:
// Top: the first row only
sheet.Range.get('B2:E2').Borders.get(xlsModule.BordersLineType.EdgeTop).LineStyle = xlsModule.LineStyleType.Thin;
// Bottom: the last row only
sheet.Range.get('B6:E6').Borders.get(xlsModule.BordersLineType.EdgeBottom).LineStyle = xlsModule.LineStyleType.Thin;
// Left: the first column only
sheet.Range.get('B2:B6').Borders.get(xlsModule.BordersLineType.EdgeLeft).LineStyle = xlsModule.LineStyleType.Thin;
// Right: the last column only
sheet.Range.get('E2:E6').Borders.get(xlsModule.BordersLineType.EdgeRight).LineStyle = xlsModule.LineStyleType.Thin;
BorderInside throws when it is called on a single cell
Cause: BorderInside means "the separators inside the range", and a single cell has no inside, so passing one throws This method doesn't support for single cell. No result file is written either.
Solution: use BorderAround to frame a single cell, or set its edges one at a time as in the previous section:
sheet.Range.get('B2').BorderAround({ borderLine: xlsModule.LineStyleType.Thin });
Get a Free License
Spire.XLS for JavaScript offers a 30-day full-featured free trial license with no functional limitations. Apply here to evaluate before purchasing.