A chart makes the data clear; it says nothing about whose brand it belongs to, or what the one-line conclusion is. The usual fix in a report is a logo in one corner of the chart plus a note such as "Online: 1,208K USD in total" in the empty space — putting the conclusion where the reader's eye already is instead of starting another paragraph of prose. In Excel these elements belong to the chart's own shape layer, positioned against the chart rather than against the cells, and that is where code that adds them most often goes wrong. The plot area's default white background is a separate matter again: it can be swapped for a light texture so that the chart and the rest of the report look like one piece. Spire.XLS for JavaScript does all of this in the browser on top of WebAssembly, managing input and output files through a virtual file system (VFS), with no backend service required.
This article covers three key features:
For installation and project setup, see Integrating Spire.XLS for JavaScript in a React Project. The examples below assume Spire.XLS is installed and the WebAssembly module has been initialised.
Insert a picture into a chart
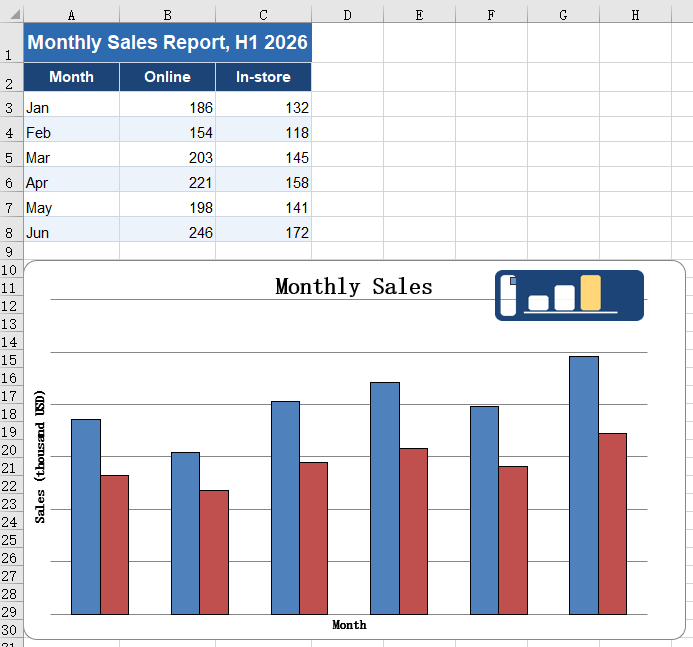
Charts in a report often need to carry a brand mark or a product shot. Once a picture is inside the chart it becomes part of it: move or resize the chart and the picture comes along, and copying the chart into another document or exporting it as an image keeps the picture too. A picture floating above the cells, by contrast, is out of alignment the moment the chart moves. The steps are:
- Load the font, the test data file and the picture into the VFS.
- Load the workbook with
workbook.LoadFromFileand take the first chart on the first worksheet. - Add the picture to the chart with
chart.Shapes.AddPicture; the value it returns is that shape. - Set the shape's
Left,Top,WidthandHeight. A shape inside a chart is measured against the chart itself: each of the four is in units of 1/4000 of the chart's width (Left,Width) or height (Top,Height). - Save the workbook with
workbook.SaveToFile.
The complete code example below shows how to insert a picture into a chart in React:
function App() {
  const addPictureInChart = async () => {
    // get the Spire.XLS WASM module
    const xlsModule = window.wasmModule?.spirexls;

    // check that the module is ready
    if (!xlsModule) {
      alert('Spire.Xls is not ready yet');
      return;
    }

    // load the font, the test data file and the picture into the VFS
    await window.spire.FetchFileToVFS('ARIAL.TTF', '/Library/Fonts/', `${process.env.PUBLIC_URL}/font/`);
    const inputFileName = 'ChartReport.xlsx';
    await window.spire.FetchFileToVFS(inputFileName, '', `${process.env.PUBLIC_URL}data/`);
    await window.spire.FetchFileToVFS('logo.png', '', `${process.env.PUBLIC_URL}static/image/`);

    // load the workbook
    const workbook = new xlsModule.Workbook();
    workbook.LoadFromFile({ fileName: inputFileName });

    // take the first worksheet and the chart on it
    const sheet = workbook.Worksheets.get(0);
    const chart = sheet.Charts.get(0);

    // insert the picture into the chart; the object returned is that picture
    const picture = chart.Shapes.AddPicture('logo.png');

    // place it in the top-right corner and scale it down. Left unset, the picture is laid out at
    // its natural pixel size and usually covers most of the chart
    picture.Left = 2850;   // 2850/4000 from the left edge of the chart
    picture.Top = 110;     // 110/4000 from the top edge of the chart
    picture.Width = 900;   // width 900/4000
    picture.Height = 532;  // height 532/4000, matching the 320x120 of the source picture

    // save the workbook
    const outputFileName = 'AddPictureInChart.xlsx';
    workbook.SaveToFile({ fileName: outputFileName });

    // dispose of the workbook to free resources
    workbook.Dispose();

    // read the result file from the VFS and start the download
    const fileArray = window.dotnetRuntime.Module.FS.readFile(outputFileName);
    const blob = new Blob([fileArray], { type: 'application/vnd.openxmlformats-officedocument.spreadsheetml.sheet' });
    const url = URL.createObjectURL(blob);
    const a = document.createElement('a');
    a.href = url;
    a.download = outputFileName;
    a.click();
    URL.revokeObjectURL(url);
  };

  return (
    <div style={{ textAlign: 'center', height: '300px' }}>
      <h1>Insert a Picture and a Text Box in a Chart</h1>
      <button id="add-picture-in-chart" onClick={addPictureInChart}>Add a picture to the chart</button>
    </div>
  );
}

export default App;
After running, inserting a picture into a chart:
Insert a text box into a chart
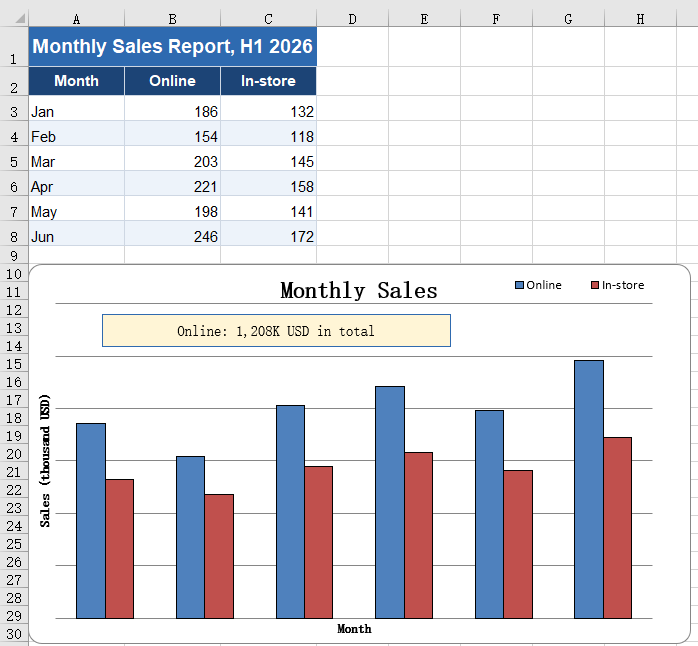
A chart shows a trend but cannot state a conclusion. A total for one series, a year-on-year remark or a callout on an outlier can all be written straight onto the chart with a text box, sparing the reader a second trip to the body text for the number. A text box is a shape inside the chart like the picture, measured on the same scale; the difference is that its size has to be sized to the length of the text. Leave it too narrow and the text wraps, and the wrapped line is clipped by the box height — it looks as though half the words went missing. The steps are:
- Load the font and the test data file into the VFS.
- Load the workbook with
workbook.LoadFromFileand take the first chart on the first worksheet. - Create the text box inside the chart with
chart.Shapes.AddTextBox. - Set
Left,Top,WidthandHeightaccording to the length of the text so that the content fits on one line. - Write the text into the
Textproperty. - Centre the text with
HAlignmentandVAlignment, taking the values fromxlsModule.CommentHAlignTypeandxlsModule.CommentVAlignType. - Set the fill, the border colour and the border width with
Fill.ForeColor,Line.ForeColorandLine.Weight, so that the box stands out on the chart. - Save the workbook with
workbook.SaveToFile.
The complete code example below shows how to insert a text box into a chart in React:
function App() {
  const addTextBoxInChart = async () => {
    // get the Spire.XLS WASM module
    const xlsModule = window.wasmModule?.spirexls;

    // check that the module is ready
    if (!xlsModule) {
      alert('Spire.Xls is not ready yet');
      return;
    }

    // load the font and the test data file into the VFS
    await window.spire.FetchFileToVFS('ARIAL.TTF', '/Library/Fonts/', `${process.env.PUBLIC_URL}/font/`);
    const inputFileName = 'ChartReport.xlsx';
    await window.spire.FetchFileToVFS(inputFileName, '', `${process.env.PUBLIC_URL}data/`);

    // load the workbook
    const workbook = new xlsModule.Workbook();
    workbook.LoadFromFile({ fileName: inputFileName });

    // take the first worksheet and the chart on it
    const sheet = workbook.Worksheets.get(0);
    const chart = sheet.Charts.get(0);

    // Add a text box to the chart
    const textBox = chart.Shapes.AddTextBox();

    // set the position and size of the text box, again in 1/4000 of the chart
    textBox.Left = 450;
    textBox.Top = 530;
    textBox.Width = 2100;
    textBox.Height = 340;

    // write the text
    textBox.Text = 'Online: 1,208K USD in total';

    // centre the text and give the box a pale yellow fill and a blue border so that it stands
    // out on the chart
    textBox.HAlignment = xlsModule.CommentHAlignType.Center;
    textBox.VAlignment = xlsModule.CommentVAlignType.Center;
    textBox.Fill.ForeColor = xlsModule.Color.FromArgb(255, 255, 245, 214);
    textBox.Line.ForeColor = xlsModule.Color.FromArgb(255, 46, 106, 176);
    textBox.Line.Weight = 1;

    // save the workbook
    const outputFileName = 'AddTextBoxInChart.xlsx';
    workbook.SaveToFile({ fileName: outputFileName });

    // dispose of the workbook to free resources
    workbook.Dispose();

    // read the result file from the VFS and start the download
    const fileArray = window.dotnetRuntime.Module.FS.readFile(outputFileName);
    const blob = new Blob([fileArray], { type: 'application/vnd.openxmlformats-officedocument.spreadsheetml.sheet' });
    const url = URL.createObjectURL(blob);
    const a = document.createElement('a');
    a.href = url;
    a.download = outputFileName;
    a.click();
    URL.revokeObjectURL(url);
  };

  return (
    <div style={{ textAlign: 'center', height: '300px' }}>
      <h1>Insert a Picture and a Text Box in a Chart</h1>
      <button id="add-textbox-in-chart" onClick={addTextBoxInChart}>Add a text box to the chart</button>
    </div>
  );
}

export default App;
After running, inserting a text box into a chart:
Fill the plot area with a picture
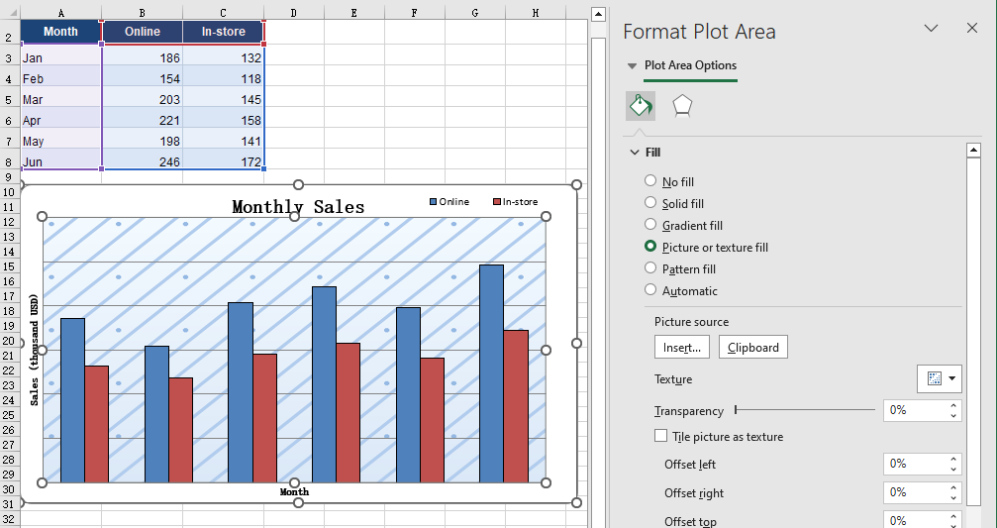
The white background of the plot area is the chart's default, and a report that has been around for a while starts to look the same everywhere. Replacing it with a light texture keeps the columns, the gridlines and the axis labels perfectly legible while giving the background some depth, and pulls the chart into the same visual language as the rest of the report. The fill and the picture shapes placed on the chart do not interfere with each other; the two can be used together. The steps are:
- Load the font, the test data file and the background picture into the VFS.
- Load the workbook with
workbook.LoadFromFileand take the first chart on the first worksheet. - Build an
xlsModule.Streamin memory from the background picture. - Hand it to
chart.PlotArea.Fill.CustomPicture; the second parameter,name, names an existing texture in the workbook, and'None'is passed when there is none. - Save the workbook with
workbook.SaveToFile.
The complete code example below shows how to fill the plot area with a picture in React:
function App() {
  const fillPlotAreaWithPicture = async () => {
    // get the Spire.XLS WASM module
    const xlsModule = window.wasmModule?.spirexls;

    // check that the module is ready
    if (!xlsModule) {
      alert('Spire.Xls is not ready yet');
      return;
    }

    // load the font, the test data file and the background picture into the VFS
    await window.spire.FetchFileToVFS('ARIAL.TTF', '/Library/Fonts/', `${process.env.PUBLIC_URL}/font/`);
    const inputFileName = 'ChartReport.xlsx';
    await window.spire.FetchFileToVFS(inputFileName, '', `${process.env.PUBLIC_URL}data/`);
    await window.spire.FetchFileToVFS('background.png', '', `${process.env.PUBLIC_URL}static/image/`);

    // load the workbook
    const workbook = new xlsModule.Workbook();
    workbook.LoadFromFile({ fileName: inputFileName });

    // take the first worksheet and the chart on it
    const sheet = workbook.Worksheets.get(0);
    const chart = sheet.Charts.get(0);

    // read the background picture into a memory stream and use it to fill the plot area
    const background = new xlsModule.Stream('background.png');
    chart.PlotArea.Fill.CustomPicture({ im: background, name: 'None' });

    // save the workbook
    const outputFileName = 'FillPlotAreaWithPicture.xlsx';
    workbook.SaveToFile({ fileName: outputFileName });

    // dispose of the workbook to free resources
    workbook.Dispose();

    // read the result file from the VFS and start the download
    const fileArray = window.dotnetRuntime.Module.FS.readFile(outputFileName);
    const blob = new Blob([fileArray], { type: 'application/vnd.openxmlformats-officedocument.spreadsheetml.sheet' });
    const url = URL.createObjectURL(blob);
    const a = document.createElement('a');
    a.href = url;
    a.download = outputFileName;
    a.click();
    URL.revokeObjectURL(url);
  };

  return (
    <div style={{ textAlign: 'center', height: '300px' }}>
      <h1>Insert a Picture and a Text Box in a Chart</h1>
      <button id="fill-plot-area" onClick={fillPlotAreaWithPicture}>Fill the plot area with a picture</button>
    </div>
  );
}

export default App;
After running, filling the plot area with a picture:
FAQ
Can I add an arrow or a callout line to a chart?
Solution: An arrow or a callout line that points at something has no API of its own, but a text box can stand in for one: stretch it into a thin strip, drop the fill and keep only the border, and place it where the callout should point.
When filling with a picture, is it the plot area or the whole chart that gets filled?
Cause: PlotArea.Fill and ChartArea.Fill are two different objects. The first covers only the region enclosed by the axes, leaving the chart title, the legend and the axis labels outside the picture. The second covers the entire chart, so the title and the legend end up on top of the picture as well.
Solution: Pick whichever one you need. After the fill, read Fill.FillType; it returns ShapeFillType.Picture on success:
// fill only the plot area: the title, the legend and the axis labels stay as they were
const background = new xlsModule.Stream('background.png');
chart.PlotArea.Fill.CustomPicture({ im: background, name: 'None' });

// fill the whole chart: the picture runs under the title and the legend
chart.ChartArea.Fill.CustomPicture({ im: new xlsModule.Stream('background.png'), name: 'None' });
Get a Free License
Spire.XLS for JavaScript offers a 30-day full-featured free trial license with no functional limitations. Apply here to evaluate before purchasing.
