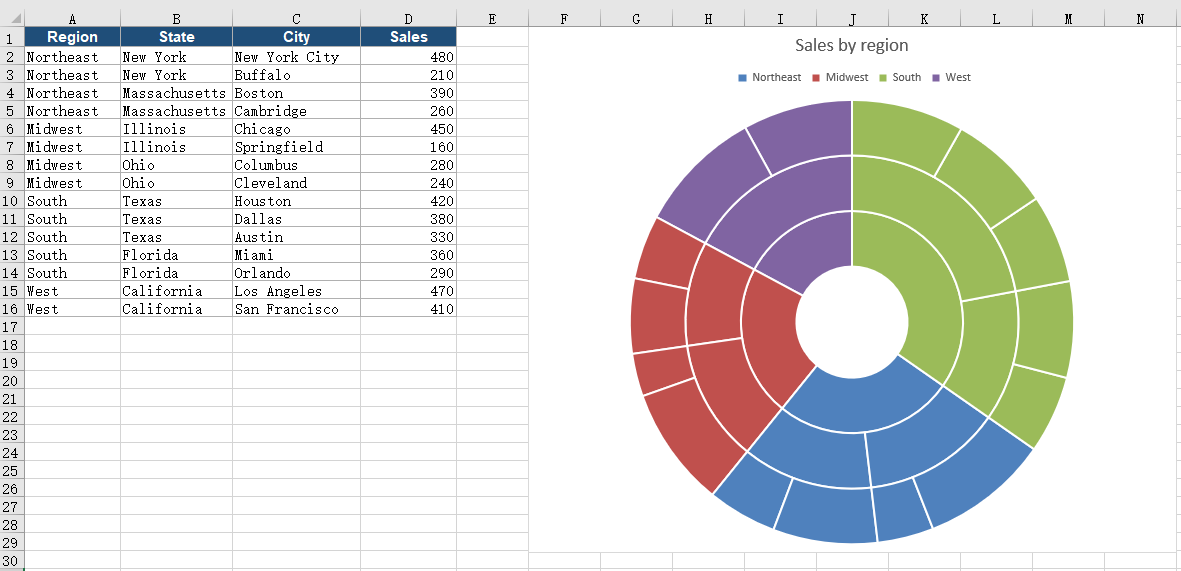
When data carries several levels of categories, a flattened table makes it hard to read the hierarchy and the share of each level at the same time. A sunburst chart places the levels in a set of concentric rings: the inner ring holds the upper categories, the outer rings hold the lower ones, and the angle of each sector reflects the share of its value within the parent category. The chart shows both what the whole is made of and how large each share is. Spire.XLS for JavaScript creates and saves sunburst charts in the browser through WebAssembly, with input and output files managed by a virtual file system (VFS) and no backend service required.
This article covers two features:
For installation and project setup, see Integrating Spire.XLS for JavaScript in a React Project. The examples below assume that Spire.XLS is installed and the WebAssembly module is initialized.
Create a Sunburst Chart
A sunburst chart reads several hierarchy columns from the inside out and uses the last column as the value. To build a usable chart, prepare several columns of hierarchy data and one value column, set the chart type to sunburst, then determine the data range, chart position, and title. Once the chart is created and saved as an Excel workbook, it can be opened, edited, or shared in spreadsheet software.
What the calls do when you create a sunburst chart:
| Call | Result |
|---|---|
window.spire.FetchFileToVFS |
Loads the font file and the input file into the virtual file system |
workbook.LoadFromFile({ fileName }) |
Loads an Excel workbook |
workbook.Worksheets.get(0) |
Gets the first worksheet in the workbook |
sheet.Charts.Add() |
Adds a chart object to the worksheet |
chart.ChartType = xlsModule.ExcelChartType.SunBurst |
Sets the chart type to sunburst |
chart.DataRange |
Sets the specified cell range as the chart data source |
chart.ChartTitle |
Sets the chart title |
chart.TopRow / chart.BottomRow / chart.LeftColumn / chart.RightColumn |
Sets the position and size of the chart on the worksheet |
workbook.SaveToFile({ fileName }) |
Writes the workbook with the sunburst chart into the virtual file system |
The steps are:
- Use
window.spire.FetchFileToVFSto load the font file and the Excel test file into the VFS. - Create a workbook with
new Workbook(), then load the test file withworkbook.LoadFromFile. - Call
workbook.Worksheets.get(0)to get the first worksheet. - Add a chart with
sheet.Charts.Add(), then setchart.ChartTypetoxlsModule.ExcelChartType.SunBurst. - Set
chart.DataRangeto the range that holds the hierarchy columns and the value column (in the example,sheet.Range.get("A1:D16")); the last column determines the angle of each sector. - Set
chart.ChartTitle, and usechart.TopRow,chart.BottomRow,chart.LeftColumn, andchart.RightColumnto place the chart in columns 6 to 15, to the right of the data area, so it does not cover the original data. - Call
workbook.SaveToFileto writeCreateSunburst.xlsx, then useworkbook.Disposeto release resources and read the workbook back from the VFS to trigger the download.
The following is the complete code example that creates a sunburst chart in React and saves it in an Excel workbook:
function App() {
  const createSunburst = async () => {
    // Get the Spire.XLS WASM module
    const xlsModule = window.wasmModule?.spirexls;

    // Check that the module is ready
    if (!xlsModule) {
      alert('Spire.Xls is not ready yet');
      return;
    }

    // Load the font and the test data file into the VFS
    await window.spire.FetchFileToVFS('ARIAL.TTF', '/Library/Fonts/', `${process.env.PUBLIC_URL}/font/`);
    const inputFileName = 'SunburstData.xlsx';
    await window.spire.FetchFileToVFS(inputFileName, '', `${process.env.PUBLIC_URL}data/`);

    // Load the workbook
    const workbook = new xlsModule.Workbook();
    workbook.LoadFromFile({ fileName: inputFileName });

    // Get the first worksheet
    const sheet = workbook.Worksheets.get(0);

    // Add a chart and set its type to sunburst
    const chart = sheet.Charts.Add();
    chart.ChartType = xlsModule.ExcelChartType.SunBurst;

    // Set the data range: the first three columns are region, state and city, the last is sales
    chart.DataRange = sheet.Range.get('A1:D16');

    // Set the position and size of the chart
    chart.TopRow = 1;
    chart.BottomRow = 30;
    chart.LeftColumn = 6;
    chart.RightColumn = 15;

    // Set the chart title
    chart.ChartTitle = 'Sales by region';

    // Save the workbook with the sunburst chart into the VFS
    const outputFileName = 'CreateSunburst.xlsx';
    workbook.SaveToFile({ fileName: outputFileName });

    // Dispose of the workbook to release its resources
    workbook.Dispose();

    // Read the result back out of the VFS and trigger the download
    const fileArray = window.dotnetRuntime.Module.FS.readFile(outputFileName);
    const blob = new Blob([fileArray], { type: 'application/vnd.openxmlformats-officedocument.spreadsheetml.sheet' });
    const url = URL.createObjectURL(blob);
    const a = document.createElement('a');
    a.href = url;
    a.download = outputFileName;
    a.click();
    URL.revokeObjectURL(url);
  };

  return (
    <div style={{ textAlign: 'center', height: '300px' }}>
      <h1>Create a Sunburst Chart in React</h1>
      <button id="create-sunburst" onClick={createSunburst}>Create Sunburst</button>
    </div>
  );
}

export default App;
The workbook after creating the sunburst chart:
Show Data Labels on the Sectors of a Sunburst Chart
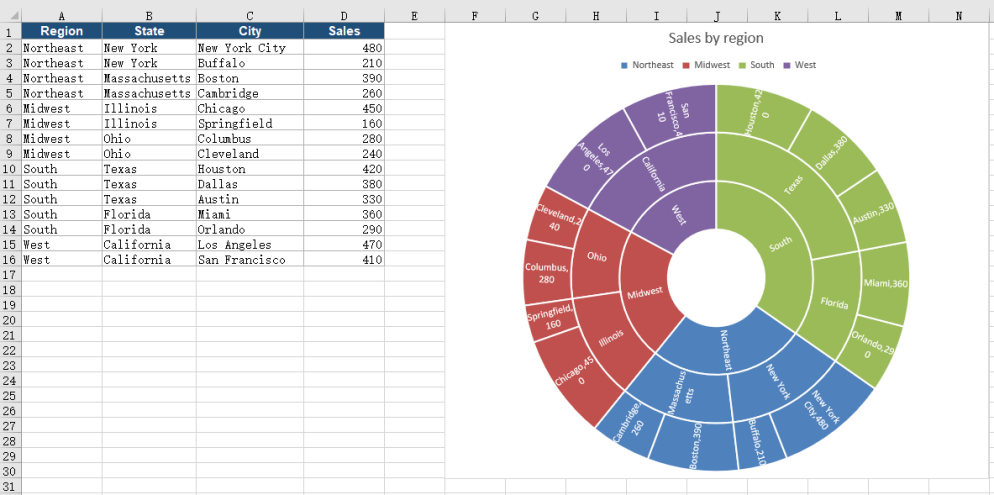
A newly created sunburst chart shows only colored sectors, with no names or values, so readers cannot tell which category each sector stands for or what its value is. Turning on category name and value labels for every sector puts the category and its value right on the sector, so each ring can be read piece by piece.
What the calls do when you show data labels on the sectors of a sunburst chart:
| Call | Result |
|---|---|
chart.Series.get(0).DataPoints |
Gets the data point collection; each data row is one sector on the outer ring |
chart.Series.get(0).DataPoints.DefaultDataPoint.DataLabels |
Gets the label object of the default data point, which applies to every sector |
labels.HasCategoryName = true |
Shows the category name on each sector |
labels.HasValue = true |
Shows the matching value next to the name |
workbook.SaveToFile({ fileName }) |
Writes the workbook with the labeled sunburst chart into the virtual file system |
The steps are:
- Use
window.spire.FetchFileToVFSto load the font file and the test file into the VFS, then load the workbook withworkbook.LoadFromFile. - Call
workbook.Worksheets.get(0)to get the worksheet, add a chart withsheet.Charts.Add()and set it toxlsModule.ExcelChartType.SunBurst, then setchart.DataRange, the title, and the position. - Get the label object through
chart.Series.get(0).DataPoints.DefaultDataPoint.DataLabels, and setHasCategoryNametotrueso each sector shows its category name. - Set
HasValueon the same label object totrueso the value of the sector appears next to the name. - Call
workbook.SaveToFileto writeSunburstLabels.xlsx, then useworkbook.Disposeto release resources and trigger the download.
The following is the complete code example that shows data labels on the sectors of a sunburst chart:
function App() {
  const styleSunburst = async () => {
    // Get the Spire.XLS WASM module
    const xlsModule = window.wasmModule?.spirexls;

    // Check that the module is ready
    if (!xlsModule) {
      alert('Spire.Xls is not ready yet');
      return;
    }

    // Load the font and the test data file into the VFS
    await window.spire.FetchFileToVFS('ARIAL.TTF', '/Library/Fonts/', `${process.env.PUBLIC_URL}/font/`);
    const inputFileName = 'SunburstData.xlsx';
    await window.spire.FetchFileToVFS(inputFileName, '', `${process.env.PUBLIC_URL}data/`);

    // Load the workbook
    const workbook = new xlsModule.Workbook();
    workbook.LoadFromFile({ fileName: inputFileName });

    // Get the first worksheet
    const sheet = workbook.Worksheets.get(0);

    // Add a sunburst chart and set its data range
    const chart = sheet.Charts.Add();
    chart.ChartType = xlsModule.ExcelChartType.SunBurst;
    chart.DataRange = sheet.Range.get('A1:D16');
    chart.TopRow = 1;
    chart.BottomRow = 31;
    chart.LeftColumn = 6;
    chart.RightColumn = 14;
    chart.ChartTitle = 'Sales by region';

    // Enable category name and value labels so every sector shows both
    const labels = chart.Series.get(0).DataPoints.DefaultDataPoint.DataLabels;
    labels.HasCategoryName = true;
    labels.HasValue = true;

    // Save the workbook with the sunburst chart into the VFS
    const outputFileName = 'SunburstLabels.xlsx';
    workbook.SaveToFile({ fileName: outputFileName });

    // Dispose of the workbook to release its resources
    workbook.Dispose();

    // Read the result back out of the VFS and trigger the download
    const fileArray = window.dotnetRuntime.Module.FS.readFile(outputFileName);
    const blob = new Blob([fileArray], { type: 'application/vnd.openxmlformats-officedocument.spreadsheetml.sheet' });
    const url = URL.createObjectURL(blob);
    const a = document.createElement('a');
    a.href = url;
    a.download = outputFileName;
    a.click();
    URL.revokeObjectURL(url);
  };

  return (
    <div style={{ textAlign: 'center', height: '300px' }}>
      <h1>Create a Sunburst Chart in React</h1>
      <button id="style-sunburst" onClick={styleSunburst}>Show Data Labels</button>
    </div>
  );
}

export default App;
The workbook after showing data labels:
FAQ
How should the data for a sunburst chart be arranged
Cause: A sunburst chart reads every column before the value column as a hierarchy level from the inside out, and uses the last column as the value. The order of the columns directly determines how the rings nest.
Solution: Put the upper category in the first column, the middle category in the second, and the lower category in the third, then put the value in the last column. Have chart.DataRange include the header row, for example sheet.Range.get("A1:D16"). Keep the hierarchy columns as text and the value column numeric.
How can the legend of a sunburst chart be hidden
Cause: The chart shows a legend by default, and a legend next to the rings takes up part of the plot area.
Solution: Set chart.HasLegend to false before saving the workbook, and the legend is removed from the chart:
chart.HasLegend = false;
Should I choose a sunburst chart or a treemap
Cause: Both map multi-level categories onto a graphic, but the presentation differs. A sunburst chart uses concentric rings for the hierarchy, with sector angles for proportions; a treemap uses nested rectangles, with rectangle areas for values.
Solution: Choose a sunburst chart when the proportions at each level matter, and set chart.ChartType to xlsModule.ExcelChartType.SunBurst. Choose a treemap when comparing values and emphasizing area differences, and set chart.ChartType to xlsModule.ExcelChartType.TreeMap.
Get a Free License
If you wish to delete the evaluation message from the resulting documents, or to get rid of function limitations, please contact sales to obtain a valid 30-day temporary license.
