When a set of values accumulates step by step, with both increases and decreases along the way, the start and the end alone do not show how much each step contributed. A waterfall chart draws every change as a floating bar that starts at the previous running total and rises or falls to the next one; adjacent bars meet end to end, so the series shows both the size of each change and the running result after every step. Spire.XLS for JavaScript creates and saves waterfall charts in the browser through WebAssembly, with input and output files managed by a virtual file system (VFS) and no backend service required.
This article covers three features:
- Create a Waterfall Chart
- Mark the Specified Data Points as Totals
- Hide the Connector Lines Between Data Points
For installation and project setup, see Integrating Spire.XLS for JavaScript in a React Project. The examples below assume that Spire.XLS is installed and the WebAssembly module is initialized.
Create a Waterfall Chart
To build a usable waterfall chart, prepare one column of categories and one column of values, set the chart type to waterfall, then determine the data range, chart position, and title. Once the chart is created and saved as an Excel workbook, it can be opened, edited, or shared in spreadsheet software.
What the calls do when you create a waterfall chart:
| Call | Result |
|---|---|
window.spire.FetchFileToVFS |
Loads the font and the input file into the virtual file system |
workbook.LoadFromFile({ fileName }) |
Loads an Excel workbook |
workbook.Worksheets.get(0) |
Gets the first worksheet of the workbook |
sheet.Charts.Add() |
Adds a chart object to the worksheet |
chart.ChartType = xlsModule.ExcelChartType.WaterFall |
Sets the chart type to waterfall |
chart.DataRange |
Sets the specified cell range as the chart data source |
chart.ChartTitle |
Sets the chart title |
chart.TopRow / chart.BottomRow / chart.LeftColumn / chart.RightColumn |
Sets the position and size of the chart on the worksheet |
workbook.SaveToFile({ fileName }) |
Writes the workbook with the waterfall chart into the virtual file system |
The steps are:
- Load the font file and the Excel test file into the VFS with
window.spire.FetchFileToVFS. - Create a workbook with
new Workbook()and load the test file withworkbook.LoadFromFile. - Call
workbook.Worksheets.get(0)to get the first worksheet. - Add a chart with
sheet.Charts.Add()and setchart.ChartTypetoxlsModule.ExcelChartType.WaterFall. - Set
chart.DataRangeto the range that holds the categories and values (in the example,sheet.Range.get('A1:B8')); the first column holds the categories and the second the values, so positive values add upward and negative values subtract downward. - Set
chart.ChartTitle, then place the chart in columns 4 to 12 to the right of the data withchart.TopRow,chart.BottomRow,chart.LeftColumn, andchart.RightColumn, so it neither covers the table nor crowds it. - Call
workbook.SaveToFileto writeCreateWaterfall.xlsx, then release the resources withworkbook.Disposeand read the workbook out of the VFS to trigger the download.
The complete example below shows how to create a waterfall chart and save it in an Excel workbook in React:
function App() {
  // Create a waterfall chart and save it in an Excel workbook
  const createWaterfall = async () => {
    // Get the Spire.XLS WASM module
    const xlsModule = window.wasmModule?.spirexls;

    // Check that the module is ready
    if (!xlsModule) {
      alert('Spire.Xls is not ready yet');
      return;
    }

    // Load the font and the test data file into the VFS
    await window.spire.FetchFileToVFS('ARIAL.TTF', '/Library/Fonts/', `${process.env.PUBLIC_URL}/font/`);
    const inputFileName = 'WaterfallData.xlsx';
    await window.spire.FetchFileToVFS(inputFileName, '', `${process.env.PUBLIC_URL}data/`);

    // Load the workbook
    const workbook = new xlsModule.Workbook();
    workbook.LoadFromFile({ fileName: inputFileName });

    // Get the first worksheet
    const sheet = workbook.Worksheets.get(0);

    // Add a chart and set its type to waterfall
    const chart = sheet.Charts.Add();
    chart.ChartType = xlsModule.ExcelChartType.WaterFall;

    // Set the data range: the first column holds the items, the second the amounts
    chart.DataRange = sheet.Range.get('A1:B8');

    // Set the position and size of the chart
    chart.TopRow = 1;
    chart.BottomRow = 19;
    chart.LeftColumn = 4;
    chart.RightColumn = 13;

    // Set the chart title
    chart.ChartTitle = 'Monthly Cash Flow';

    // Save the workbook with the waterfall chart into the VFS
    const outputFileName = 'CreateWaterfall.xlsx';
    workbook.SaveToFile({ fileName: outputFileName });

    // Dispose of the workbook to release its resources
    workbook.Dispose();

    // Read the result back out of the VFS and trigger the download
    const fileArray = window.dotnetRuntime.Module.FS.readFile(outputFileName);
    const blob = new Blob([fileArray], { type: 'application/vnd.openxmlformats-officedocument.spreadsheetml.sheet' });
    const url = URL.createObjectURL(blob);
    const a = document.createElement('a');
    a.href = url;
    a.download = outputFileName;
    a.click();
    URL.revokeObjectURL(url);
  };

  return (
    <div style={{ textAlign: 'center', height: '300px' }}>
      <h1>Create a Waterfall Chart in React</h1>
      <button id="create-waterfall" onClick={createWaterfall}>Create Waterfall</button>
    </div>
  );
}

export default App;
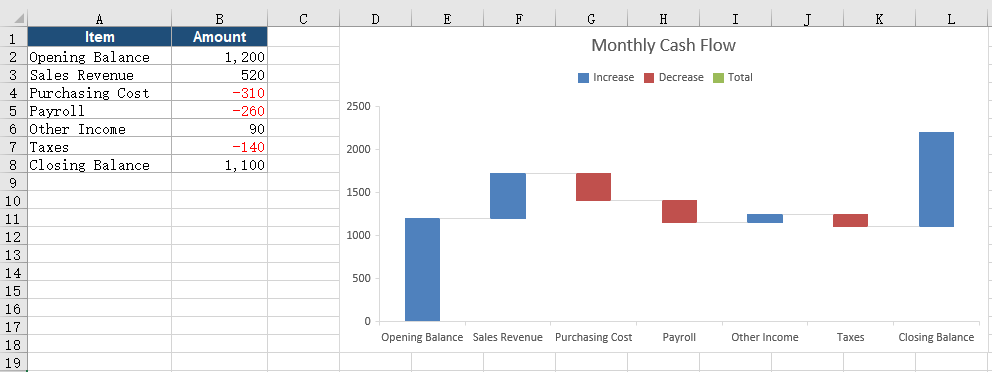
The workbook after creating the waterfall chart:
Mark the Specified Data Points as Totals
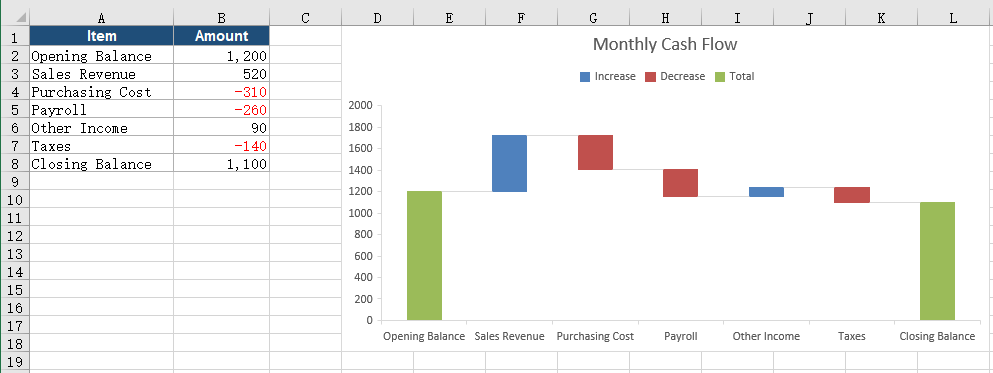
By default a waterfall chart treats every row as a change, and each bar floats on from the previous running total. The summary values at the start and the end of the sequence are not changes, so both should rise from zero and stand apart from the additions and deductions in between. Once the matching data points are marked as totals, the two bars appear as full columns, and the reader can pick out the start and the end at a glance.
What the calls do when you mark data points as totals:
| Call | Result |
|---|---|
chart.Series.get(0) |
Gets the first data series of the chart |
chart.Series.get(0).DataPoints |
Gets the data point collection, one point per data row |
DataPoints.get(i).SetAsTotal = true |
Marks the data point at index i as a total so the bar starts from zero |
workbook.SaveToFile({ fileName }) |
Writes the workbook with the total marks into the virtual file system |
The steps are:
- Load the font file and the test file into the VFS with
window.spire.FetchFileToVFS, then load the workbook withworkbook.LoadFromFileand get the first worksheet. - Add a chart with
sheet.Charts.Add(), setchart.ChartTypetoxlsModule.ExcelChartType.WaterFall, and setchart.DataRange, the title, and the position. - Get the data point collection through
chart.Series.get(0).DataPoints; the indexes start at 0 and follow the data rows in order. - Set both
DataPoints.get(0).SetAsTotalandDataPoints.get(6).SetAsTotaltotrue, so the data points in the first and last rows become total columns. - Call
workbook.SaveToFileto writeMarkTotals.xlsx, then release the resources withworkbook.Disposeand trigger the download.
The complete example below shows how to mark the opening and closing data points as totals:
function App() {
  // Mark the opening and closing data points as totals
  const markTotals = async () => {
    // Get the Spire.XLS WASM module
    const xlsModule = window.wasmModule?.spirexls;

    // Check that the module is ready
    if (!xlsModule) {
      alert('Spire.Xls is not ready yet');
      return;
    }

    // Load the font and the test data file into the VFS
    await window.spire.FetchFileToVFS('ARIAL.TTF', '/Library/Fonts/', `${process.env.PUBLIC_URL}/font/`);
    const inputFileName = 'WaterfallData.xlsx';
    await window.spire.FetchFileToVFS(inputFileName, '', `${process.env.PUBLIC_URL}data/`);

    // Load the workbook
    const workbook = new xlsModule.Workbook();
    workbook.LoadFromFile({ fileName: inputFileName });

    // Get the first worksheet
    const sheet = workbook.Worksheets.get(0);

    // Add a waterfall chart and set its data range
    const chart = sheet.Charts.Add();
    chart.ChartType = xlsModule.ExcelChartType.WaterFall;
    chart.DataRange = sheet.Range.get('A1:B8');
    chart.TopRow = 1;
    chart.BottomRow = 19;
    chart.LeftColumn = 4;
    chart.RightColumn = 13;
    chart.ChartTitle = 'Monthly Cash Flow';

    // Mark the first and last data points as totals so both bars start from zero
    const points = chart.Series.get(0).DataPoints;
    points.get(0).SetAsTotal = true;
    points.get(6).SetAsTotal = true;

    // Save the workbook with the total data points into the VFS
    const outputFileName = 'MarkTotals.xlsx';
    workbook.SaveToFile({ fileName: outputFileName });

    // Dispose of the workbook to release its resources
    workbook.Dispose();

    // Read the result back out of the VFS and trigger the download
    const fileArray = window.dotnetRuntime.Module.FS.readFile(outputFileName);
    const blob = new Blob([fileArray], { type: 'application/vnd.openxmlformats-officedocument.spreadsheetml.sheet' });
    const url = URL.createObjectURL(blob);
    const a = document.createElement('a');
    a.href = url;
    a.download = outputFileName;
    a.click();
    URL.revokeObjectURL(url);
  };

  return (
    <div style={{ textAlign: 'center', height: '300px' }}>
      <h1>Create a Waterfall Chart in React</h1>
      <button id="mark-totals" onClick={markTotals}>Mark Totals</button>
    </div>
  );
}

export default App;
The workbook after marking the data points as totals:
Hide the Connector Lines Between Data Points
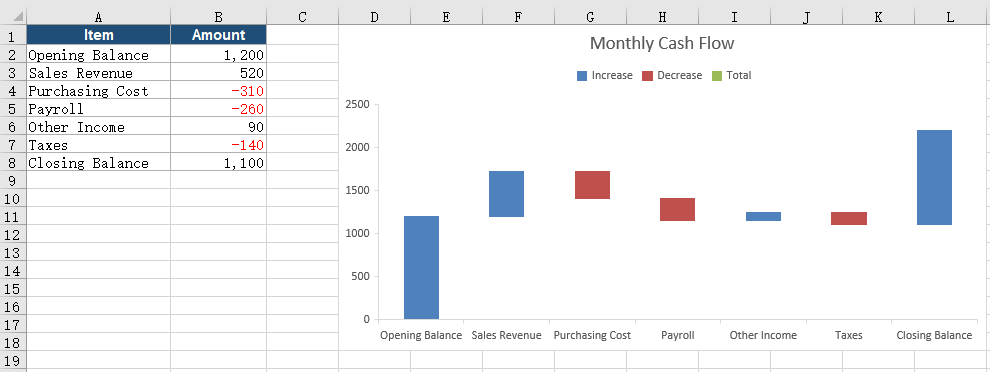
A waterfall chart draws connector lines between adjacent bars by default, joining where one bar ends to where the next bar starts. When the bars are narrow, the labels are many, or the result has to render in a viewer with limited display support, those lines crowd against the labels and gridlines and make the chart look busy. With the connector lines hidden, the height relationship between the bars is still easy to read, and the layout is cleaner.
What the calls do when you hide the connector lines:
| Call | Result |
|---|---|
chart.Series.get(0).Format |
Gets the format object of the data series |
chart.Series.get(0).Format.ShowConnectorLines = false |
Turns off the connector lines between adjacent data points |
workbook.SaveToFile({ fileName }) |
Writes the workbook without the connector lines into the virtual file system |
The steps are:
- Load the font file and the test file into the VFS with
window.spire.FetchFileToVFS, then load the workbook withworkbook.LoadFromFileand get the first worksheet. - Add a chart with
sheet.Charts.Add(), setchart.ChartTypetoxlsModule.ExcelChartType.WaterFall, and setchart.DataRange, the title, and the position. - Get the format object of the data series through
chart.Series.get(0).Formatand set itsShowConnectorLinestofalse, which removes the connector lines between adjacent data points. - Call
workbook.SaveToFileto writeHideConnectorLines.xlsx, then release the resources withworkbook.Disposeand trigger the download.
The complete example below shows how to hide the connector lines between data points in a waterfall chart:
function App() {
  // Hide the connector lines between the data points
  const hideConnectorLines = async () => {
    // Get the Spire.XLS WASM module
    const xlsModule = window.wasmModule?.spirexls;

    // Check that the module is ready
    if (!xlsModule) {
      alert('Spire.Xls is not ready yet');
      return;
    }

    // Load the font and the test data file into the VFS
    await window.spire.FetchFileToVFS('ARIAL.TTF', '/Library/Fonts/', `${process.env.PUBLIC_URL}/font/`);
    const inputFileName = 'WaterfallData.xlsx';
    await window.spire.FetchFileToVFS(inputFileName, '', `${process.env.PUBLIC_URL}data/`);

    // Load the workbook
    const workbook = new xlsModule.Workbook();
    workbook.LoadFromFile({ fileName: inputFileName });

    // Get the first worksheet
    const sheet = workbook.Worksheets.get(0);

    // Add a waterfall chart and set its data range
    const chart = sheet.Charts.Add();
    chart.ChartType = xlsModule.ExcelChartType.WaterFall;
    chart.DataRange = sheet.Range.get('A1:B8');
    chart.TopRow = 1;
    chart.BottomRow = 19;
    chart.LeftColumn = 4;
    chart.RightColumn = 13;
    chart.ChartTitle = 'Monthly Cash Flow';

    // Turn off the connector lines between adjacent data points
    chart.Series.get(0).Format.ShowConnectorLines = false;

    // Save the workbook without the connector lines into the VFS
    const outputFileName = 'HideConnectorLines.xlsx';
    workbook.SaveToFile({ fileName: outputFileName });

    // Dispose of the workbook to release its resources
    workbook.Dispose();

    // Read the result back out of the VFS and trigger the download
    const fileArray = window.dotnetRuntime.Module.FS.readFile(outputFileName);
    const blob = new Blob([fileArray], { type: 'application/vnd.openxmlformats-officedocument.spreadsheetml.sheet' });
    const url = URL.createObjectURL(blob);
    const a = document.createElement('a');
    a.href = url;
    a.download = outputFileName;
    a.click();
    URL.revokeObjectURL(url);
  };

  return (
    <div style={{ textAlign: 'center', height: '300px' }}>
      <h1>Create a Waterfall Chart in React</h1>
      <button id="hide-connector-lines" onClick={hideConnectorLines}>Hide Connector Lines</button>
    </div>
  );
}

export default App;
The workbook with the connector lines hidden:
FAQ
How do I show values on a waterfall chart
Cause: The bar height of a waterfall chart shows the size of each change, while the exact amount still has to be read back from the data table.
Solution: Get the label object of the default data point and set HasValue to true; if needed, also set Position to xlsModule.DataLabelPositionType.Center so the labels sit in the centre of the bars:
const labels = chart.Series.get(0).DataPoints.DefaultDataPoint.DataLabels;
labels.HasValue = true;
labels.Position = xlsModule.DataLabelPositionType.Center;
How can the minimum and maximum of the value axis be adjusted
Cause: The value axis of a waterfall chart scales automatically to the data, which can flatten the differences between bars or leave excess space at both ends.
Solution: Set chart.PrimaryValueAxis.MinValue and MaxValue before saving the workbook to fix the axis to a clear range. The example limits the range from 1000 to 2000:
chart.PrimaryValueAxis.MinValue = 1000;
chart.PrimaryValueAxis.MaxValue = 2000;
Make sure the range covers the cumulative values of all bars; a range that is too narrow cuts off the parts beyond it.
Should I choose a waterfall chart or a stacked column chart
Cause: Both can show a total made of several parts, but they emphasize different things. A stacked column chart stacks the parts in one column and highlights how the total is composed; a waterfall chart splits the parts into separate bars that meet end to end and highlights the effect of each change on the running result.
Solution: Choose a stacked column chart when the composition and the share of each part matter; choose a waterfall chart when you need to trace how a balance moves from the start through several changes to the end, and set chart.ChartType to xlsModule.ExcelChartType.WaterFall.
Get a Free License
If you wish to delete the evaluation message from the resulting documents, or to get rid of function limitations, please contact sales to obtain a valid 30-day temporary license.
