Como Criar Arquivos Excel em JavaScript (XLSX/XLS)
Índice
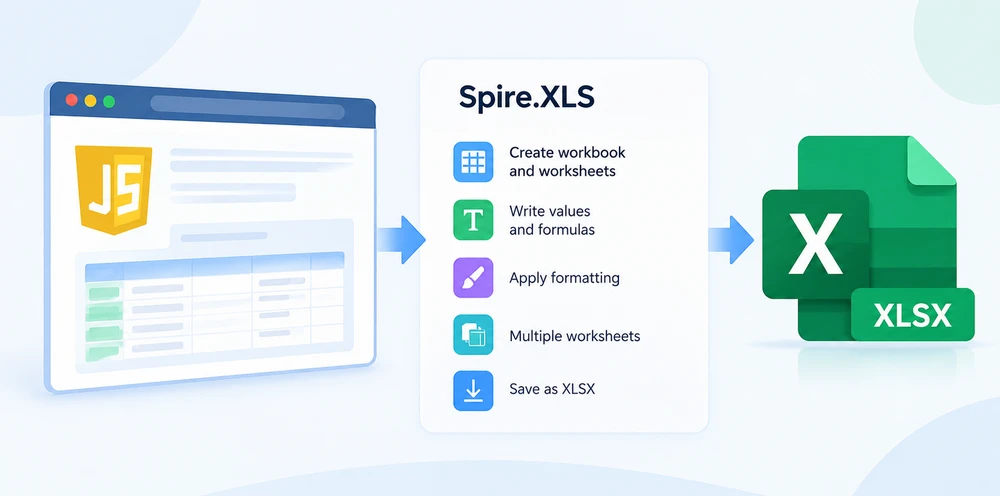
JavaScript pode gerar pastas de trabalho do Excel diretamente no navegador. Com o Spire.XLS para JavaScript, você pode criar uma pasta de trabalho, adicionar planilhas, escrever valores e fórmulas, aplicar formatação e salvar o resultado como um arquivo XLSX ou XLS — tudo no lado do cliente, sem necessidade de instalação do Microsoft Excel.
Este tutorial começa com uma pasta de trabalho XLSX básica e depois adiciona valores de célula tipados, fórmulas, formatação, várias planilhas, suporte a download no navegador, conversão de CSV e saída XLS para compatibilidade com sistemas legados.
Instalar e Inicializar o Spire.XLS para JavaScript
O Spire.XLS para JavaScript vem dentro do pacote spire.office, junto com Spire.PDF, Spire.Doc e Spire.Presentation:
npm i spire.office
Iniciar o runtime exige duas importações. A primeira inicia o host WebAssembly .NET compartilhado; a segunda registra a API de planilhas:
// 1. Boot the shared runtime once per page.
const common = await import('/node_modules/spire.office/spire.common.js');
await common.initializeWasm();

// 2. Load the spreadsheet engine — this is what creates window.spirexls.
await import('/node_modules/spire.office/spire.xls.js');
Os arquivos Spire.*.Wasm.zip e a pasta _framework precisam estar acessíveis a partir da raiz do site. O runtime os resolve em relação à URL do documento, e não em relação ao módulo que fez a importação, então em um projeto Vite ou Create React App eles precisam ficar em public/. O prefixo process.env.PUBLIC_URL mostrado em configurações baseadas em React é uma convenção do Create React App, não um padrão do navegador — ajuste o caminho base para corresponder à sua ferramenta de build se você não estiver usando CRA. Se os arquivos estiverem ausentes, o navegador registra WebAssembly.compile(): expected magic word — o servidor de desenvolvimento respondeu à solicitação do arquivo com index.html.
Depois, tudo depende de um único global:
const xls = window.spirexls;
Na configuração atual do pacote usada por este tutorial, a API de planilhas é exposta por meio de window.spirexls. Use esse global após o runtime ter sido inicializado. Versões mais antigas a expunham como window.wasmModule.spirexls; se você estiver trabalhando com uma versão diferente do pacote, verifique qual global está disponível.
Agora você está pronto para gerar arquivos Excel.
Criar um Arquivo Excel Básico em JavaScript
Vamos criar um relatório de vendas. Criaremos uma pasta de trabalho, adicionaremos uma planilha, escreveremos dados de produtos nas células e salvaremos o resultado como um arquivo XLSX que é baixado automaticamente.
async function createExcelFile() {
    const xls = window.spirexls;
    if (!xls) {
        console.error('Spire.XLS is not initialized.');
        return;
    }

    // A fresh Workbook() already contains three blank worksheets, so clear them
    // and add the single sheet this report needs.
    const workbook = new xls.Workbook();
    workbook.Worksheets.Clear();
    const sheet = workbook.Worksheets.Add("Sales Report");

    // Sample data: product sales
    const data = [
        ["Product", "Quantity", "Price"],
        ["Laptop", 10, 999.99],
        ["Mouse", 50, 24.99],
        ["Keyboard", 30, 59.99],
        ["Monitor", 15, 329.99]
    ];

    // Write data to cells
    for (let row = 0; row < data.length; row++) {
        for (let col = 0; col < data[row].length; col++) {
            const cell = sheet.Range.get({ row: row + 1, column: col + 1 });
            if (typeof data[row][col] === "string") {
                cell.Text = data[row][col];
            } else {
                cell.NumberValue = data[row][col];
            }
        }
    }

    // Save to the virtual file system, read the bytes, download, then dispose
    const fileName = "SalesReport.xlsx";
    workbook.SaveToFile({
        fileName: fileName,
        version: xls.ExcelVersion.Version2016
    });

    const fileData = window.dotnetRuntime.Module.FS.readFile(fileName);
    const blob = new Blob([fileData], {
        type: "application/vnd.openxmlformats-officedocument.spreadsheetml.sheet"
    });
    const url = URL.createObjectURL(blob);
    const a = document.createElement("a");
    a.href = url;
    a.download = fileName;
    a.click();
    URL.revokeObjectURL(url);

    workbook.Dispose();
}
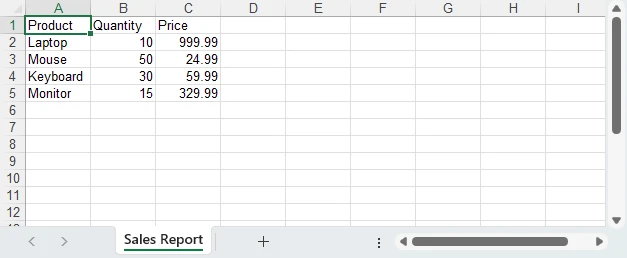
Chame createExcelFile() e você obterá um SalesReport.xlsx com quatro linhas de produtos mais um cabeçalho. O fluxo de trabalho é simples: criar pasta de trabalho → escrever dados → salvar → baixar.
As seções a seguir ampliam este exemplo. Cada trecho de código pressupõe que seja adicionado dentro de createExcelFile() depois que a pasta de trabalho e a planilha tiverem sido criadas.
Escrever Diferentes Tipos de Dados em Células do Excel
O Excel distingue entre texto, números, datas e booleanos. Errar isso leva a arquivos nos quais a classificação quebra, as fórmulas retornam erros e os números são exibidos como texto.
const sheet = workbook.Worksheets.get(0);

// Text — for labels, names, descriptions
sheet.Range.get("A1").Text = "Product Name";

// Number — for anything you'll calculate, sort, or filter
sheet.Range.get("B1").NumberValue = 999.99;

// Date — a real DateTimeValue plus a display format
const dateCell = sheet.Range.get("C1");
dateCell.DateTimeValue = new Date(Date.UTC(2025, 2, 15));
dateCell.NumberFormat = "yyyy-mm-dd";

// Boolean — use BooleanValue, not text
sheet.Range.get("D1").BooleanValue = true;
O erro mais comum? Escrever cell.Text = "999.99" em vez de cell.NumberValue = 999.99. O valor parece idêntico ao abrir o arquivo, mas o Excel o trata como texto — você não pode somá-lo, calcular a média ou classificá-lo numericamente. Sempre use NumberValue para números, DateTimeValue para datas e BooleanValue para booleanos.
Datas exigem uma precaução extra. DateTimeValue preserva o instante UTC representado pelo Date do JavaScript. Criar uma data com meia-noite local pode, portanto, deslocar o dia exibido em alguns fusos horários; use Date.UTC() quando quiser que uma data de calendário específica seja preservada.
Adicionar Fórmulas à Planilha do Excel
As fórmulas fazem do seu arquivo gerado uma planilha de verdade, e não apenas um despejo de dados. Vamos adicionar uma coluna Total que calcula Quantity × Price para cada linha, além de um total geral na parte inferior:
// Add "Total" header
sheet.Range.get({ row: 1, column: 4 }).Text = "Total";

// Per-row formula: Total = Quantity × Price
for (let i = 2; i <= 5; i++) {
    sheet.Range.get({ row: i, column: 4 }).Formula = `=B${i}*C${i}`;
}

// Grand total row
sheet.Range.get({ row: 6, column: 1 }).Text = "Total";
sheet.Range.get({ row: 6, column: 2 }).Formula = "=SUM(B2:B5)";
sheet.Range.get({ row: 6, column: 4 }).Formula = "=SUM(D2:D5)";

// Evaluate the formulas once, so their results are written into the file.
workbook.CalculateAllValue();
Chame workbook.CalculateAllValue() antes de salvar quando precisar que a pasta de trabalho gerada contenha resultados de fórmulas calculados. Isso é útil para visualizadores ou aplicativos que dependem de valores em cache em vez de recalcular fórmulas ao abrir.
Para um guia abrangente sobre funções do Excel e operações com fórmulas, consulte Inserir ou Ler Funções e Fórmulas em Planilhas do Excel com JavaScript no React.
Formatar o Arquivo Excel Gerado
Uma planilha com dados brutos funciona, mas uma planilha formatada comunica. Vamos transformar nosso relatório de vendas em algo que você realmente enviaria a uma parte interessada:
// Bold, colored header row
const header = sheet.Range.get("A1:D1");
header.Style.Font.IsBold = true;
header.Style.Font.Size = 12;
header.Style.Color = xls.Color.get_LightSkyBlue();

// Currency format for Price and Total columns
for (let i = 2; i <= 5; i++) {
    sheet.Range.get({ row: i, column: 3 }).NumberFormat = "$#,##0.00";
    sheet.Range.get({ row: i, column: 4 }).NumberFormat = "$#,##0.00";
}

// Set column widths explicitly
[26, 10, 12, 12].forEach((width, i) => {
    sheet.Columns.get(i).ColumnWidth = width;
});

// Clean borders
const usedRange = sheet.Range.get("A1:D6");
usedRange.Borders.LineStyle = xls.LineStyleType.Thin;
usedRange.Borders.Color = xls.Color.get_LightSteelBlue();
Dois detalhes vale a pena conhecer aqui. sheet.Columns.get(i) e sheet.Rows.get(i) são baseados em 0 e usam get, diferentemente do get_Item que outras coleções expõem. E na configuração de navegador testada, AutoFitColumn exige uma fonte que não está disponível no sandbox do WebAssembly, então definir ColumnWidth explicitamente é mais confiável.
O resultado: um cabeçalho azul em negrito, preços formatados como moeda, colunas com tamanho adequado e bordas limpas.
Para orientações detalhadas sobre dimensões de linhas e colunas, consulte Definir Altura da Linha e Largura da Coluna no Excel com JavaScript no React.
Criar Várias Planilhas em uma Pasta de Trabalho do Excel
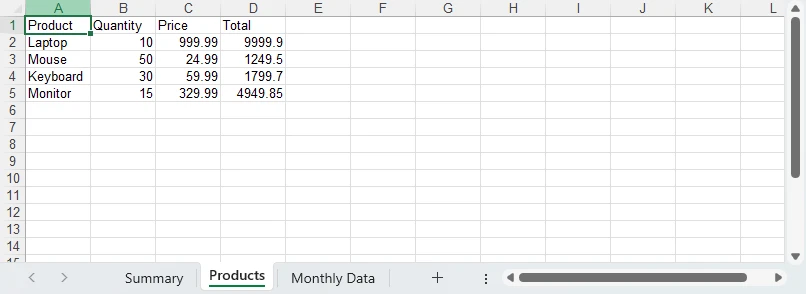
Relatórios reais raramente cabem em uma única planilha. Um relatório de vendas pode ter um resumo na primeira aba, detalhes de produtos na segunda e detalhamentos mensais na terceira.
workbook.Worksheets.Clear();
const summarySheet = workbook.Worksheets.Add("Summary");
const productsSheet = workbook.Worksheets.Add("Products");
const monthlySheet = workbook.Worksheets.Add("Monthly Data");

// Products sheet — write actual data so cross-sheet formulas work
productsSheet.Range.get("A1").Text = "Product";
productsSheet.Range.get("B1").Text = "Quantity";
productsSheet.Range.get("C1").Text = "Price";
productsSheet.Range.get("D1").Text = "Total";

const products = [
    ["Laptop", 10, 999.99],
    ["Mouse", 50, 24.99],
    ["Keyboard", 30, 59.99],
    ["Monitor", 15, 329.99]
];

for (let i = 0; i < products.length; i++) {
    const row = i + 2;
    productsSheet.Range.get({ row: row, column: 1 }).Text = products[i][0];
    productsSheet.Range.get({ row: row, column: 2 }).NumberValue = products[i][1];
    productsSheet.Range.get({ row: row, column: 3 }).NumberValue = products[i][2];
    productsSheet.Range.get({ row: row, column: 4 }).Formula = `=B${row}*C${row}`;
}

// Summary sheet with cross-sheet reference
summarySheet.Range.get("A1").Text = "Sales Summary";
summarySheet.Range.get("A1").Style.Font.IsBold = true;
summarySheet.Range.get("A2").Text = "Total Products";
summarySheet.Range.get("B2").NumberValue = 4;
summarySheet.Range.get("A3").Text = "Total Revenue";
summarySheet.Range.get("B3").Formula = "=SUM(Products!D2:D5)";
Cada Worksheets.Add(name) retorna a planilha que acabou de criar, na ordem em que as chamadas são feitas, então a ordem das abas corresponde à ordem do código. Observe a fórmula entre planilhas: =SUM(Products!D2:D5) na planilha Summary faz referência à coluna Total na planilha Products. O Excel lida com isso automaticamente quando o arquivo é aberto — nenhum código extra é necessário.
Para mais informações sobre gerenciamento de planilhas — adicionar, remover e reordenar planilhas — consulte Adicionar, Remover e Mover Planilhas do Excel com JavaScript no React.
Salvar e Baixar o Arquivo XLSX no Navegador
Depois que sua pasta de trabalho estiver pronta, o Spire.XLS a salva em um sistema de arquivos virtual do WebAssembly. Em seguida, você lê os dados do arquivo, converte-os em um Blob e dispara o download:
workbook.SaveToFile({
    fileName: "Report.xlsx",
    version: xls.ExcelVersion.Version2016
});

const fileData = window.dotnetRuntime.Module.FS.readFile("Report.xlsx");
const blob = new Blob([fileData], {
    type: "application/vnd.openxmlformats-officedocument.spreadsheetml.sheet"
});
const url = URL.createObjectURL(blob);
const a = document.createElement("a");
a.href = url;
a.download = "Report.xlsx";
a.click();
URL.revokeObjectURL(url);

workbook.Dispose();
Sempre chame workbook.Dispose() após o download para liberar memória — especialmente em aplicativos nos quais os usuários geram vários arquivos em uma sessão. A pasta de trabalho em si permanece no heap do WebAssembly até você fazer isso, e esse heap não é recuperado pelo coletor de lixo do navegador.
Procurando integração com React ou exportação de tabela HTML? Confira nosso guia para baixar e exportar arquivos Excel em JavaScript e React.
Juntando Tudo: Um Relatório de Vendas Formatado
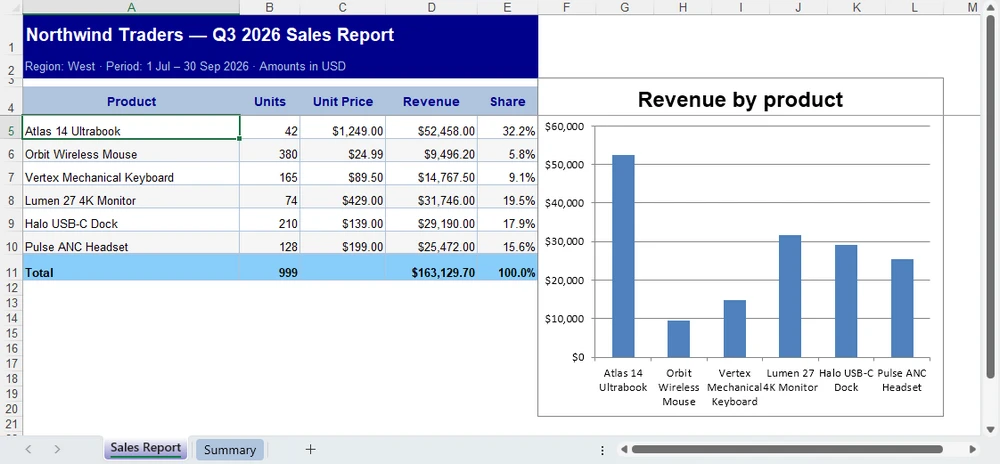
Os trechos acima constroem uma pasta de trabalho um aspecto de cada vez. Aqui eles estão em uma única função: uma planilha estilizada com faixas zebradas e formatos de moeda, colunas de receita e participação orientadas por fórmulas, um gráfico de colunas e uma segunda planilha que consolida os números.
/**
 * Build a formatted sales report workbook in the browser and download it as
 * SalesReport.xlsx.
 *
 * The layout is driven by `products` below — swap it for form input, an API
 * response or component state and nothing else needs to change.
 */
async function createExcelReport() {
  // spire.office 11.7.0 exposes Spire.XLS as `window.spirexls`. Older builds
  // hung it off `window.wasmModule.spirexls`; that global no longer exists.
  const xls = window.spirexls;
  if (!xls) throw new Error('Spire.XLS is not ready yet');

  // [product, units sold, unit price] — revenue and share are derived by formula
  const products = [
    ['Atlas 14 Ultrabook', 42, 1249.0],
    ['Orbit Wireless Mouse', 380, 24.99],
    ['Vertex Mechanical Keyboard', 165, 89.5],
    ['Lumen 27 4K Monitor', 74, 429.0],
    ['Halo USB-C Dock', 210, 139.0],
    ['Pulse ANC Headset', 128, 199.0],
  ];
  const FIRST = 5; // first data row
  const TOTAL = FIRST + products.length; // total row

  const wb = new xls.Workbook();
  wb.Worksheets.Clear();
  const sheet = wb.Worksheets.Add('Sales Report');

  const at = (a) => sheet.Range.get(a);
  const cell = (row, col) => sheet.Range.get({ row: row, column: col });
  const paint = (a, colour) => {
    at(a).Style.Color = colour;
  };

  // ── Sizing ── explicit widths (AutoFitColumn is unreliable in the WASM sandbox)
  [34, 9, 13, 14, 9].forEach((w, i) => {
    sheet.Columns.get(i).ColumnWidth = w;
  });
  sheet.Rows.get(0).RowHeight = 34; // title
  sheet.Rows.get(1).RowHeight = 20; // subtitle
  sheet.Rows.get(2).RowHeight = 8; // spacer
  sheet.Rows.get(3).RowHeight = 24; // header

  // ── Title band ── merge first, then style the whole merged area
  at('A1:E1').Merge();
  cell(1, 1).Text = 'Sales Report — Q3 2026';
  paint('A1:E1', xls.Color.get_DarkBlue());
  at('A1:E1').Style.Font.Color = xls.Color.get_White();
  at('A1:E1').Style.Font.IsBold = true;
  at('A1:E1').Style.Font.Size = 15;
  at('A1:E1').Style.VerticalAlignment = xls.VerticalAlignType.Center;

  at('A2:E2').Merge();
  cell(2, 1).Text = 'Region: West · Period: 1 Jul – 30 Sep 2026 · Amounts in USD';
  paint('A2:E2', xls.Color.get_DarkBlue());
  at('A2:E2').Style.Font.Color = xls.Color.get_LightSteelBlue();
  at('A2:E2').Style.Font.Size = 9.5;
  at('A2:E2').Style.VerticalAlignment = xls.VerticalAlignType.Center;

  // ── Header row ───────────────────────────────────────────────────────────
  ['Product', 'Units', 'Unit Price', 'Revenue', 'Share'].forEach((label, i) => {
    cell(4, i + 1).Text = label;
  });
  paint('A4:E4', xls.Color.get_LightSteelBlue());
  at('A4:E4').Style.Font.Color = xls.Color.get_DarkBlue();
  at('A4:E4').Style.Font.IsBold = true;
  at('A4:E4').Style.Font.Size = 10.5;
  at('A4:E4').Style.HorizontalAlignment = xls.HorizontalAlignType.Center;
  at('A4:E4').Style.VerticalAlignment = xls.VerticalAlignType.Center;

  // ── Data rows ── numbers go in as NumberValue, never as text
  products.forEach(([name, units, price], i) => {
    const r = FIRST + i;
    cell(r, 1).Text = name;
    cell(r, 2).NumberValue = units;
    cell(r, 3).NumberValue = price;
    cell(r, 4).Formula = `=B${r}*C${r}`;
    cell(r, 5).Formula = `=D${r}/$D${TOTAL}`; // share of the grand total
    sheet.Rows.get(r - 1).RowHeight = 20;
    if (i % 2) paint(`A${r}:E${r}`, xls.Color.get_WhiteSmoke()); // zebra banding
  });

  // ── Total row ────────────────────────────────────────────────────────────
  cell(TOTAL, 1).Text = 'Total';
  [2, 4, 5].forEach((col) => {
    const letter = String.fromCharCode(64 + col);
    cell(TOTAL, col).Formula = `=SUM(${letter}${FIRST}:${letter}${TOTAL - 1})`;
  });
  paint(`A${TOTAL}:E${TOTAL}`, xls.Color.get_LightSkyBlue());
  at(`A${TOTAL}:E${TOTAL}`).Style.Font.IsBold = true;
  sheet.Rows.get(TOTAL - 1).RowHeight = 22;

  // ── Number formats and borders ───────────────────────────────────────────
  at(`B${FIRST}:B${TOTAL}`).NumberFormat = '#,##0';
  at(`C${FIRST}:D${TOTAL}`).NumberFormat = '$#,##0.00';
  at(`E${FIRST}:E${TOTAL}`).NumberFormat = '0.0%';

  const table = at(`A4:E${TOTAL}`);
  table.Borders.LineStyle = xls.LineStyleType.Thin;
  table.Borders.Color = xls.Color.get_LightSteelBlue();
  at(`A${TOTAL}:E${TOTAL}`).Borders.get_Item(xls.BordersLineType.EdgeTop).LineStyle =
    xls.LineStyleType.Medium;

  // ── Chart ── build the series by hand (DataRange would mix units)
  const chart = sheet.Charts.Add();
  chart.ChartType = xls.ExcelChartType.ColumnClustered;
  chart.LeftColumn = 6;
  chart.TopRow = 3;
  chart.RightColumn = 13;
  chart.BottomRow = 21;
  const serie = chart.Series.Add();
  serie.CategoryLabels = at(`A${FIRST}:A${TOTAL - 1}`);
  serie.Values = at(`D${FIRST}:D${TOTAL - 1}`);
  serie.Name = 'Revenue';
  chart.ChartTitleArea.Text = 'Revenue by product';
  chart.HasLegend = false;
  chart.PrimaryValueAxis.NumberFormat = '$#,##0';

  // ── Sheet chrome ──
  sheet.FreezePanes(FIRST, 1);
  sheet.GridLinesVisible = false;
  sheet.TabColor = xls.Color.get_DarkBlue();

  // ── Second worksheet: cross-sheet roll-up ──
  const summary = wb.Worksheets.Add('Summary');
  summary.Columns.get(0).ColumnWidth = 26;
  summary.Columns.get(1).ColumnWidth = 18;
  summary.Rows.get(0).RowHeight = 30;
  summary.Rows.get(1).RowHeight = 18;
  summary.Rows.get(3).RowHeight = 22;

  const band = (a, text, size) => {
    summary.Range.get(a).Merge();
    summary.Range.get(a.split(':')[0]).Text = text;
    summary.Range.get(a).Style.Color = xls.Color.get_DarkBlue();
    summary.Range.get(a).Style.Font.Color = xls.Color.get_White();
    summary.Range.get(a).Style.Font.IsBold = true;
    summary.Range.get(a).Style.Font.Size = size;
    summary.Range.get(a).Style.VerticalAlignment = xls.VerticalAlignType.Center;
  };
  band('A1:B1', 'Executive Summary', 14);
  band('A2:B2', 'Sales Report · Q3 2026', 9.5);

  ['Metric', 'Value'].forEach((label, i) => {
    summary.Range.get({ row: 4, column: i + 1 }).Text = label;
  });
  summary.Range.get('A4:B4').Style.Color = xls.Color.get_LightSteelBlue();
  summary.Range.get('A4:B4').Style.Font.Color = xls.Color.get_DarkBlue();
  summary.Range.get('A4:B4').Style.Font.IsBold = true;

  [
    ['Total revenue', "='Sales Report'!D" + TOTAL, '$#,##0.00'],
    ['Units shipped', "='Sales Report'!B" + TOTAL, '#,##0'],
    ['Average unit price', `='Sales Report'!D${TOTAL}/'Sales Report'!B${TOTAL}`, '$#,##0.00'],
  ].forEach(([label, formula, format], i) => {
    summary.Range.get({ row: 5 + i, column: 1 }).Text = label;
    const value = summary.Range.get({ row: 5 + i, column: 2 });
    value.Formula = formula;
    value.NumberFormat = format;
    value.Style.HorizontalAlignment = xls.HorizontalAlignType.Right;
    if (i % 2) summary.Range.get(`A${5 + i}:B${5 + i}`).Style.Color = xls.Color.get_WhiteSmoke();
  });

  // Date — use Date.UTC to avoid timezone shift
  summary.Range.get('A8').Text = 'Report date';
  const reportDate = summary.Range.get('B8');
  reportDate.DateTimeValue = new Date(Date.UTC(2026, 8, 28));
  reportDate.NumberFormat = 'yyyy-mm-dd';
  reportDate.Style.HorizontalAlignment = xls.HorizontalAlignType.Right;

  const kpis = summary.Range.get('A4:B8');
  kpis.Borders.LineStyle = xls.LineStyleType.Thin;
  kpis.Borders.Color = xls.Color.get_LightSteelBlue();
  summary.GridLinesVisible = false;
  summary.TabColor = xls.Color.get_LightSteelBlue();

  // ── Save, then release ──
  wb.CalculateAllValue();
  const fileName = 'SalesReport.xlsx';
  wb.SaveToFile({ fileName: fileName, version: xls.ExcelVersion.Version2016 });

  const fileData = window.dotnetRuntime.Module.FS.readFile(fileName);
  const blob = new Blob([fileData], {
    type: 'application/vnd.openxmlformats-officedocument.spreadsheetml.sheet',
  });
  const url = URL.createObjectURL(blob);
  Object.assign(document.createElement('a'), { href: url, download: fileName }).click();
  URL.revokeObjectURL(url);

  wb.Dispose(); // free the WASM heap — one workbook per generation cycle
}
O layout segue os dados. Substitua o array products por uma resposta da sua própria API e todo o resto — totais, percentuais de participação, o intervalo do gráfico, a consolidação do resumo — continua funcionando, porque tudo é expresso como fórmulas ou intervalos derivados, e não como valores codificados fixamente.
Para mais tipos de gráfico e opções de configuração, consulte Criar Gráficos do Excel com JavaScript no React.
Criar um Arquivo Excel a Partir de Dados CSV
Você pode carregar dados tabulares de um arquivo CSV em uma planilha e salvar o resultado como XLSX. A pasta de trabalho resultante pode então ser formatada ou ampliada com fórmulas e planilhas adicionais:
// The library reads from its own virtual file system, so the CSV has to be
// there before you can load it — written from a string here, from the bytes of
// a File object in a real application.
const csv = "Product,Quantity,Price\nLaptop,10,999.99\nMouse,50,24.99\nKeyboard,30,59.99";
window.dotnetRuntime.Module.FS.writeFile("data.csv", new TextEncoder().encode(csv));

workbook.LoadFromFile("data.csv", ",");
workbook.SaveToFile({
    fileName: "ConvertedFromCSV.xlsx",
    version: xls.ExcelVersion.Version2016
});
A planilha importada recebe o nome do arquivo (data), então Worksheets.get(0) a seleciona.
O separador é um segundo argumento obrigatório. LoadFromFile("data.csv") sozinho é rejeitado com This is not a structured storage file, porque a sobrecarga de argumento único espera um formato estruturado como .xlsx ou .xls e não detecta CSV.
Há um segundo problema: o importador de CSV grava todos os campos como texto. Uma coluna de quantidade chega como "10" em vez de 10, o que significa que não pode ser somada ou classificada numericamente — exatamente o problema descrito anteriormente neste tutorial. Converta as colunas necessárias antes de salvar:
const csvSheet = workbook.Worksheets.get(0);

// The importer leaves every field as text — coerce each numeric column.
// Columns 2 and 3 hold Quantity and Price; both arrive as "10" and "999.99".
for (let row = 2; row <= 4; row++) {
    [2, 3].forEach((column) => {
        const cell = csvSheet.Range.get({ row: row, column: column });
        if (cell.Text !== "") {
            cell.NumberValue = Number(cell.Text);
        }
    });
}
Para um guia completo sobre conversão entre os formatos CSV e Excel, consulte nosso tutorial de conversão de CSV para Excel.
Criar um Arquivo XLS em Vez de XLSX
Se seu aplicativo precisar gerar o formato legado .xls em vez de .xlsx, altere o parâmetro version:
workbook.SaveToFile({
    fileName: "Report.xls",
    version: xls.ExcelVersion.Version97to2003
});
O membro de enum é Version97to2003 — não existe Version97. Mantenha gráficos em XLSX; o gravador XLS testado falha quando métricas de fonte de gráfico são necessárias.
XLSX (Excel 2007+) é o formato recomendado para novos aplicativos. XLS (Excel 97–2003) só é necessário quando a compatibilidade com versões anteriores é exigida.
Problemas Comuns
window.wasmModule é indefinido. Exemplos mais antigos liam a API de planilhas de window.wasmModule.spirexls. Versões atuais a instalam diretamente em window.spirexls e deixam wasmModule indefinido, então o primeiro acesso já lança erro. Verifique window.spirexls em vez disso.
Módulo WASM não inicializado. Se window.spirexls estiver indefinido, o runtime ainda não terminou de carregar. Mostre um indicador de carregamento e espere a inicialização terminar antes de tentar qualquer operação do Excel.
Auto-fit lança um erro de fonte. AutoFitColumn e AutoFitRow precisam de uma fonte do sistema para medir o texto, e o sandbox do WebAssembly não tem nenhuma. Eles falham com Cannot found font(Arial) installed on the system. Calcule ou codifique fixamente as larguras das colunas com sheet.Columns.get(i).ColumnWidth.
Números armazenados como texto. Usar cell.Text = "100" em vez de cell.NumberValue = 100 quebra a classificação e os cálculos. Este é o problema mais comum que os desenvolvedores encontram ao escrever arquivos Excel em JavaScript, e a importação de CSV o aciona automaticamente — sempre use NumberValue para dados numéricos.
Uma planilha "Evaluation Warning" aparece. Ao usar a versão de avaliação sem uma licença válida, o Spire.XLS adiciona uma planilha de avaliação à pasta de trabalho salva. Essa planilha é recriada ao salvar, então removê-la programaticamente não é uma solução confiável. Aplique uma chave de licença para evitá-la.
Vazamentos de memória em aplicativos de longa duração. Chame workbook.Dispose() após cada ciclo de geração. Em aplicativos de página única, pastas de trabalho não descartadas acumulam memória e degradam o desempenho com o tempo.
Perguntas Frequentes
O JavaScript pode criar arquivos Excel sem o Microsoft Excel?
Sim. O Spire.XLS para JavaScript é executado inteiramente no navegador via WebAssembly. Nenhuma instalação do Microsoft Excel ou do Office no lado do servidor é necessária para gerar arquivos XLSX.
O JavaScript pode criar arquivos XLSX diretamente no navegador?
Sim. Todas as operações de planilha acontecem no lado do cliente. O arquivo é salvo em um sistema de arquivos virtual e depois baixado como um Blob — nenhum servidor de backend é necessário.
Qual é a diferença entre XLS e XLSX?
XLSX (Excel 2007 e posteriores) é o formato moderno baseado em XML, recomendado para novos aplicativos. XLS (Excel 97–2003) é o formato binário legado, útil para compatibilidade com sistemas mais antigos.
Conclusão
Criar arquivos Excel em JavaScript não exige um servidor de backend ou o Microsoft Excel. Com o Spire.XLS para JavaScript, você pode construir pastas de trabalho do zero, escrever dados tipados, adicionar fórmulas, aplicar formatação e organizar dados em várias planilhas — tudo no navegador.
Comece com o exemplo básico acima e depois adicione fórmulas e formatação conforme suas necessidades crescerem. Para integração específica com React e exportação de tabela HTML, consulte nosso tutorial dedicado de exportação.
Veja Também
JavaScript로 Excel 파일 만들기 (XLSX/XLS)
JavaScript는 브라우저에서 직접 Excel 통합 문서를 생성할 수 있습니다. JavaScript용 Spire.XLS를 사용하면 통합 문서를 만들고, 워크시트를 추가하고, 값과 수식을 작성하고, 서식을 적용하고, 결과를 XLSX 또는 XLS 파일로 저장할 수 있습니다. 이 모든 작업이 클라이언트 측에서 이루어지며 Microsoft Excel을 설치할 필요가 없습니다.
이 튜토리얼은 기본 XLSX 통합 문서로 시작한 다음 형식이 지정된 셀 값, 수식, 서식, 여러 워크시트, 브라우저 다운로드 지원, CSV 변환, 레거시 호환성을 위한 XLS 출력을 추가합니다.
JavaScript용 Spire.XLS 설치 및 초기화
JavaScript용 Spire.XLS는 Spire.PDF, Spire.Doc, Spire.Presentation과 함께 spire.office 패키지 내에 제공됩니다:
npm i spire.office
런타임을 부팅하려면 두 번의 import가 필요합니다. 첫 번째는 공유 .NET WebAssembly 호스트를 시작하고, 두 번째는 스프레드시트 API를 등록합니다:
// 1. Boot the shared runtime once per page.
const common = await import('/node_modules/spire.office/spire.common.js');
await common.initializeWasm();

// 2. Load the spreadsheet engine — this is what creates window.spirexls.
await import('/node_modules/spire.office/spire.xls.js');
Spire.*.Wasm.zip 아카이브와 _framework 폴더는 사이트 루트에서 접근 가능해야 합니다. 런타임은 import를 수행한 모듈이 아니라 문서 URL을 기준으로 이들을 확인하므로, Vite 또는 Create React App 프로젝트에서는 public/에 있어야 합니다. React 기반 설정에서 표시되는 process.env.PUBLIC_URL 접두사는 Create React App 규칙이지 브라우저 표준이 아닙니다. CRA를 사용하지 않는 경우 빌드 도구에 맞게 기본 경로를 조정하세요. 아카이브가 없으면 브라우저는 WebAssembly.compile(): expected magic word를 기록합니다. 개발 서버가 아카이브 요청에 index.html로 응답한 것입니다.
그러면 모든 것이 하나의 전역 객체에 의존합니다:
const xls = window.spirexls;
이 튜토리얼에서 사용하는 현재 패키지 설정에서는 스프레드시트 API가 window.spirexls를 통해 노출됩니다. 런타임이 초기화된 후 해당 전역 객체를 사용하세요. 이전 릴리스에서는 이를 window.wasmModule.spirexls로 노출했습니다. 다른 패키지 버전을 사용하는 경우 어떤 전역 객체를 사용할 수 있는지 확인하세요.
이제 Excel 파일을 생성할 준비가 되었습니다.
JavaScript로 기본 Excel 파일 만들기
판매 보고서를 만들어 보겠습니다. 통합 문서를 만들고, 워크시트를 추가하고, 제품 데이터를 셀에 쓰고, 결과를 자동으로 다운로드되는 XLSX 파일로 저장합니다.
async function createExcelFile() {
    const xls = window.spirexls;
    if (!xls) {
        console.error('Spire.XLS is not initialized.');
        return;
    }

    // A fresh Workbook() already contains three blank worksheets, so clear them
    // and add the single sheet this report needs.
    const workbook = new xls.Workbook();
    workbook.Worksheets.Clear();
    const sheet = workbook.Worksheets.Add("Sales Report");

    // Sample data: product sales
    const data = [
        ["Product", "Quantity", "Price"],
        ["Laptop", 10, 999.99],
        ["Mouse", 50, 24.99],
        ["Keyboard", 30, 59.99],
        ["Monitor", 15, 329.99]
    ];

    // Write data to cells
    for (let row = 0; row < data.length; row++) {
        for (let col = 0; col < data[row].length; col++) {
            const cell = sheet.Range.get({ row: row + 1, column: col + 1 });
            if (typeof data[row][col] === "string") {
                cell.Text = data[row][col];
            } else {
                cell.NumberValue = data[row][col];
            }
        }
    }

    // Save to the virtual file system, read the bytes, download, then dispose
    const fileName = "SalesReport.xlsx";
    workbook.SaveToFile({
        fileName: fileName,
        version: xls.ExcelVersion.Version2016
    });

    const fileData = window.dotnetRuntime.Module.FS.readFile(fileName);
    const blob = new Blob([fileData], {
        type: "application/vnd.openxmlformats-officedocument.spreadsheetml.sheet"
    });
    const url = URL.createObjectURL(blob);
    const a = document.createElement("a");
    a.href = url;
    a.download = fileName;
    a.click();
    URL.revokeObjectURL(url);

    workbook.Dispose();
}
createExcelFile()를 호출하면 4개의 제품 행과 헤더가 있는 SalesReport.xlsx가 생성됩니다. 워크플로는 간단합니다: 워크북 생성 → 데이터 쓰기 → 저장 → 다운로드.
다음 섹션에서는 이 예제를 확장합니다. 각 코드 조각은 통합 문서와 워크시트가 생성된 후 createExcelFile() 내부에 추가된다고 가정합니다.
Excel 셀에 다양한 데이터 유형 쓰기
Excel은 텍스트, 숫자, 날짜, 부울을 구분합니다. 이를 잘못 처리하면 정렬이 깨지고, 수식이 오류를 반환하며, 숫자가 텍스트로 표시되는 파일이 만들어집니다.
const sheet = workbook.Worksheets.get(0);

// Text — for labels, names, descriptions
sheet.Range.get("A1").Text = "Product Name";

// Number — for anything you'll calculate, sort, or filter
sheet.Range.get("B1").NumberValue = 999.99;

// Date — a real DateTimeValue plus a display format
const dateCell = sheet.Range.get("C1");
dateCell.DateTimeValue = new Date(Date.UTC(2025, 2, 15));
dateCell.NumberFormat = "yyyy-mm-dd";

// Boolean — use BooleanValue, not text
sheet.Range.get("D1").BooleanValue = true;
가장 흔한 실수는 무엇일까요? cell.NumberValue = 999.99 대신 cell.Text = "999.99"를 쓰는 것입니다. 파일을 열면 값이 동일해 보이지만 Excel은 이를 텍스트로 처리하므로 합계, 평균, 숫자 정렬을 할 수 없습니다. 숫자에는 항상 NumberValue를, 날짜에는 DateTimeValue를, 부울에는 BooleanValue를 사용하세요.
날짜에는 추가 주의가 필요합니다. DateTimeValue는 JavaScript Date가 나타내는 UTC 시점을 유지합니다. 따라서 현지 자정으로 날짜를 만들면 일부 시간대에서 표시되는 날짜가 이동할 수 있습니다. 특정 달력 날짜를 유지하려면 Date.UTC()를 사용하세요.
Excel 워크시트에 수식 추가
수식을 사용하면 생성된 파일이 단순한 데이터 덤프가 아니라 실제 스프레드시트가 됩니다. 각 행의 Quantity × Price를 계산하는 Total 열과 맨 아래에 총합계를 추가해 보겠습니다:
// Add "Total" header
sheet.Range.get({ row: 1, column: 4 }).Text = "Total";

// Per-row formula: Total = Quantity × Price
for (let i = 2; i <= 5; i++) {
    sheet.Range.get({ row: i, column: 4 }).Formula = `=B${i}*C${i}`;
}

// Grand total row
sheet.Range.get({ row: 6, column: 1 }).Text = "Total";
sheet.Range.get({ row: 6, column: 2 }).Formula = "=SUM(B2:B5)";
sheet.Range.get({ row: 6, column: 4 }).Formula = "=SUM(D2:D5)";

// Evaluate the formulas once, so their results are written into the file.
workbook.CalculateAllValue();
생성된 통합 문서에 계산된 수식 결과가 포함되어야 하는 경우 저장하기 전에 workbook.CalculateAllValue()를 호출하세요. 이는 열 때 수식을 다시 계산하는 대신 캐시된 값에 의존하는 뷰어나 애플리케이션에 유용합니다.
Excel 함수 및 수식 작업에 대한 종합 가이드는 React에서 JavaScript로 Excel 워크시트의 함수 및 수식 삽입 또는 읽기를 참조하세요.
생성된 Excel 파일 서식 지정
원시 데이터가 있는 스프레드시트도 작동하지만, 서식이 지정된 스프레드시트는 의사소통을 합니다. 판매 보고서를 이해관계자에게 실제로 보낼 수 있는 형태로 바꿔 보겠습니다:
// Bold, colored header row
const header = sheet.Range.get("A1:D1");
header.Style.Font.IsBold = true;
header.Style.Font.Size = 12;
header.Style.Color = xls.Color.get_LightSkyBlue();

// Currency format for Price and Total columns
for (let i = 2; i <= 5; i++) {
    sheet.Range.get({ row: i, column: 3 }).NumberFormat = "$#,##0.00";
    sheet.Range.get({ row: i, column: 4 }).NumberFormat = "$#,##0.00";
}

// Set column widths explicitly
[26, 10, 12, 12].forEach((width, i) => {
    sheet.Columns.get(i).ColumnWidth = width;
});

// Clean borders
const usedRange = sheet.Range.get("A1:D6");
usedRange.Borders.LineStyle = xls.LineStyleType.Thin;
usedRange.Borders.Color = xls.Color.get_LightSteelBlue();
여기서 알아 둘 만한 두 가지 세부 사항이 있습니다. sheet.Columns.get(i)와 sheet.Rows.get(i)는 0부터 시작하며 다른 컬렉션이 노출하는 get_Item과 달리 get을 사용합니다. 그리고 테스트한 브라우저 설정에서는 AutoFitColumn에 WebAssembly 샌드박스에서 사용할 수 없는 글꼴이 필요하므로 ColumnWidth를 명시적으로 설정하는 것이 더 안정적입니다.
결과: 굵은 파란색 헤더, 통화 형식의 가격, 적절한 크기의 열, 깔끔한 테두리입니다.
행과 열 크기에 대한 자세한 지침은 React에서 JavaScript로 Excel의 행 높이 및 열 너비 설정을 참조하세요.
Excel 통합 문서에서 여러 워크시트 만들기
실제 보고서는 하나의 시트에 담기 어렵습니다. 판매 보고서에는 첫 번째 탭에 요약, 두 번째 탭에 제품 세부 정보, 세 번째 탭에 월별 분석이 있을 수 있습니다.
workbook.Worksheets.Clear();
const summarySheet = workbook.Worksheets.Add("Summary");
const productsSheet = workbook.Worksheets.Add("Products");
const monthlySheet = workbook.Worksheets.Add("Monthly Data");

// Products sheet — write actual data so cross-sheet formulas work
productsSheet.Range.get("A1").Text = "Product";
productsSheet.Range.get("B1").Text = "Quantity";
productsSheet.Range.get("C1").Text = "Price";
productsSheet.Range.get("D1").Text = "Total";

const products = [
    ["Laptop", 10, 999.99],
    ["Mouse", 50, 24.99],
    ["Keyboard", 30, 59.99],
    ["Monitor", 15, 329.99]
];

for (let i = 0; i < products.length; i++) {
    const row = i + 2;
    productsSheet.Range.get({ row: row, column: 1 }).Text = products[i][0];
    productsSheet.Range.get({ row: row, column: 2 }).NumberValue = products[i][1];
    productsSheet.Range.get({ row: row, column: 3 }).NumberValue = products[i][2];
    productsSheet.Range.get({ row: row, column: 4 }).Formula = `=B${row}*C${row}`;
}

// Summary sheet with cross-sheet reference
summarySheet.Range.get("A1").Text = "Sales Summary";
summarySheet.Range.get("A1").Style.Font.IsBold = true;
summarySheet.Range.get("A2").Text = "Total Products";
summarySheet.Range.get("B2").NumberValue = 4;
summarySheet.Range.get("A3").Text = "Total Revenue";
summarySheet.Range.get("B3").Formula = "=SUM(Products!D2:D5)";
각 Worksheets.Add(name)는 호출된 순서대로 방금 생성한 시트를 반환하므로 탭 순서가 코드 순서와 일치합니다. 시트 간 수식에 주목하세요. Summary 시트의 =SUM(Products!D2:D5)는 Products 시트의 Total 열을 참조합니다. Excel은 파일을 열 때 이를 자동으로 처리하므로 추가 코드가 필요하지 않습니다.
워크시트 관리(시트 추가, 제거, 순서 변경)에 대한 자세한 내용은 React에서 JavaScript로 Excel 워크시트 추가, 제거 및 이동을 참조하세요.
브라우저에서 XLSX 파일 저장 및 다운로드
통합 문서가 준비되면 Spire.XLS는 이를 WebAssembly 가상 파일 시스템에 저장합니다. 그런 다음 파일 데이터를 읽고 Blob으로 변환한 뒤 다운로드를 트리거합니다:
workbook.SaveToFile({
    fileName: "Report.xlsx",
    version: xls.ExcelVersion.Version2016
});

const fileData = window.dotnetRuntime.Module.FS.readFile("Report.xlsx");
const blob = new Blob([fileData], {
    type: "application/vnd.openxmlformats-officedocument.spreadsheetml.sheet"
});
const url = URL.createObjectURL(blob);
const a = document.createElement("a");
a.href = url;
a.download = "Report.xlsx";
a.click();
URL.revokeObjectURL(url);

workbook.Dispose();
다운로드 후에는 항상 workbook.Dispose()를 호출하여 메모리를 해제하세요. 특히 사용자가 한 세션에서 여러 파일을 생성하는 앱에서는 더욱 중요합니다. 그렇게 할 때까지 통합 문서 자체는 WebAssembly 힙에 남아 있으며, 해당 힙은 브라우저의 가비지 컬렉터가 회수하지 않습니다.
React 통합 또는 HTML 표 내보내기를 찾고 계신가요? JavaScript 및 React에서 Excel 파일 다운로드 및 내보내기 가이드를 확인하세요.
종합하기: 서식이 지정된 판매 보고서
위의 코드 조각은 한 번에 하나의 관심사씩 통합 문서를 구성합니다. 여기에서는 이를 하나의 함수로 모았습니다. 줄무늬 음영과 통화 형식이 있는 스타일 지정된 워크시트, 수식 기반 매출 및 점유율 열, 세로 막대형 차트, 숫자를 집계하는 두 번째 워크시트가 포함됩니다.
/**
 * Build a formatted sales report workbook in the browser and download it as
 * SalesReport.xlsx.
 *
 * The layout is driven by `products` below — swap it for form input, an API
 * response or component state and nothing else needs to change.
 */
async function createExcelReport() {
  // spire.office 11.7.0 exposes Spire.XLS as `window.spirexls`. Older builds
  // hung it off `window.wasmModule.spirexls`; that global no longer exists.
  const xls = window.spirexls;
  if (!xls) throw new Error('Spire.XLS is not ready yet');

  // [product, units sold, unit price] — revenue and share are derived by formula
  const products = [
    ['Atlas 14 Ultrabook', 42, 1249.0],
    ['Orbit Wireless Mouse', 380, 24.99],
    ['Vertex Mechanical Keyboard', 165, 89.5],
    ['Lumen 27 4K Monitor', 74, 429.0],
    ['Halo USB-C Dock', 210, 139.0],
    ['Pulse ANC Headset', 128, 199.0],
  ];
  const FIRST = 5; // first data row
  const TOTAL = FIRST + products.length; // total row

  const wb = new xls.Workbook();
  wb.Worksheets.Clear();
  const sheet = wb.Worksheets.Add('Sales Report');

  const at = (a) => sheet.Range.get(a);
  const cell = (row, col) => sheet.Range.get({ row: row, column: col });
  const paint = (a, colour) => {
    at(a).Style.Color = colour;
  };

  // ── Sizing ── explicit widths (AutoFitColumn is unreliable in the WASM sandbox)
  [34, 9, 13, 14, 9].forEach((w, i) => {
    sheet.Columns.get(i).ColumnWidth = w;
  });
  sheet.Rows.get(0).RowHeight = 34; // title
  sheet.Rows.get(1).RowHeight = 20; // subtitle
  sheet.Rows.get(2).RowHeight = 8; // spacer
  sheet.Rows.get(3).RowHeight = 24; // header

  // ── Title band ── merge first, then style the whole merged area
  at('A1:E1').Merge();
  cell(1, 1).Text = 'Sales Report — Q3 2026';
  paint('A1:E1', xls.Color.get_DarkBlue());
  at('A1:E1').Style.Font.Color = xls.Color.get_White();
  at('A1:E1').Style.Font.IsBold = true;
  at('A1:E1').Style.Font.Size = 15;
  at('A1:E1').Style.VerticalAlignment = xls.VerticalAlignType.Center;

  at('A2:E2').Merge();
  cell(2, 1).Text = 'Region: West · Period: 1 Jul – 30 Sep 2026 · Amounts in USD';
  paint('A2:E2', xls.Color.get_DarkBlue());
  at('A2:E2').Style.Font.Color = xls.Color.get_LightSteelBlue();
  at('A2:E2').Style.Font.Size = 9.5;
  at('A2:E2').Style.VerticalAlignment = xls.VerticalAlignType.Center;

  // ── Header row ───────────────────────────────────────────────────────────
  ['Product', 'Units', 'Unit Price', 'Revenue', 'Share'].forEach((label, i) => {
    cell(4, i + 1).Text = label;
  });
  paint('A4:E4', xls.Color.get_LightSteelBlue());
  at('A4:E4').Style.Font.Color = xls.Color.get_DarkBlue();
  at('A4:E4').Style.Font.IsBold = true;
  at('A4:E4').Style.Font.Size = 10.5;
  at('A4:E4').Style.HorizontalAlignment = xls.HorizontalAlignType.Center;
  at('A4:E4').Style.VerticalAlignment = xls.VerticalAlignType.Center;

  // ── Data rows ── numbers go in as NumberValue, never as text
  products.forEach(([name, units, price], i) => {
    const r = FIRST + i;
    cell(r, 1).Text = name;
    cell(r, 2).NumberValue = units;
    cell(r, 3).NumberValue = price;
    cell(r, 4).Formula = `=B${r}*C${r}`;
    cell(r, 5).Formula = `=D${r}/$D${TOTAL}`; // share of the grand total
    sheet.Rows.get(r - 1).RowHeight = 20;
    if (i % 2) paint(`A${r}:E${r}`, xls.Color.get_WhiteSmoke()); // zebra banding
  });

  // ── Total row ────────────────────────────────────────────────────────────
  cell(TOTAL, 1).Text = 'Total';
  [2, 4, 5].forEach((col) => {
    const letter = String.fromCharCode(64 + col);
    cell(TOTAL, col).Formula = `=SUM(${letter}${FIRST}:${letter}${TOTAL - 1})`;
  });
  paint(`A${TOTAL}:E${TOTAL}`, xls.Color.get_LightSkyBlue());
  at(`A${TOTAL}:E${TOTAL}`).Style.Font.IsBold = true;
  sheet.Rows.get(TOTAL - 1).RowHeight = 22;

  // ── Number formats and borders ───────────────────────────────────────────
  at(`B${FIRST}:B${TOTAL}`).NumberFormat = '#,##0';
  at(`C${FIRST}:D${TOTAL}`).NumberFormat = '$#,##0.00';
  at(`E${FIRST}:E${TOTAL}`).NumberFormat = '0.0%';

  const table = at(`A4:E${TOTAL}`);
  table.Borders.LineStyle = xls.LineStyleType.Thin;
  table.Borders.Color = xls.Color.get_LightSteelBlue();
  at(`A${TOTAL}:E${TOTAL}`).Borders.get_Item(xls.BordersLineType.EdgeTop).LineStyle =
    xls.LineStyleType.Medium;

  // ── Chart ── build the series by hand (DataRange would mix units)
  const chart = sheet.Charts.Add();
  chart.ChartType = xls.ExcelChartType.ColumnClustered;
  chart.LeftColumn = 6;
  chart.TopRow = 3;
  chart.RightColumn = 13;
  chart.BottomRow = 21;
  const serie = chart.Series.Add();
  serie.CategoryLabels = at(`A${FIRST}:A${TOTAL - 1}`);
  serie.Values = at(`D${FIRST}:D${TOTAL - 1}`);
  serie.Name = 'Revenue';
  chart.ChartTitleArea.Text = 'Revenue by product';
  chart.HasLegend = false;
  chart.PrimaryValueAxis.NumberFormat = '$#,##0';

  // ── Sheet chrome ──
  sheet.FreezePanes(FIRST, 1);
  sheet.GridLinesVisible = false;
  sheet.TabColor = xls.Color.get_DarkBlue();

  // ── Second worksheet: cross-sheet roll-up ──
  const summary = wb.Worksheets.Add('Summary');
  summary.Columns.get(0).ColumnWidth = 26;
  summary.Columns.get(1).ColumnWidth = 18;
  summary.Rows.get(0).RowHeight = 30;
  summary.Rows.get(1).RowHeight = 18;
  summary.Rows.get(3).RowHeight = 22;

  const band = (a, text, size) => {
    summary.Range.get(a).Merge();
    summary.Range.get(a.split(':')[0]).Text = text;
    summary.Range.get(a).Style.Color = xls.Color.get_DarkBlue();
    summary.Range.get(a).Style.Font.Color = xls.Color.get_White();
    summary.Range.get(a).Style.Font.IsBold = true;
    summary.Range.get(a).Style.Font.Size = size;
    summary.Range.get(a).Style.VerticalAlignment = xls.VerticalAlignType.Center;
  };
  band('A1:B1', 'Executive Summary', 14);
  band('A2:B2', 'Sales Report · Q3 2026', 9.5);

  ['Metric', 'Value'].forEach((label, i) => {
    summary.Range.get({ row: 4, column: i + 1 }).Text = label;
  });
  summary.Range.get('A4:B4').Style.Color = xls.Color.get_LightSteelBlue();
  summary.Range.get('A4:B4').Style.Font.Color = xls.Color.get_DarkBlue();
  summary.Range.get('A4:B4').Style.Font.IsBold = true;

  [
    ['Total revenue', "='Sales Report'!D" + TOTAL, '$#,##0.00'],
    ['Units shipped', "='Sales Report'!B" + TOTAL, '#,##0'],
    ['Average unit price', `='Sales Report'!D${TOTAL}/'Sales Report'!B${TOTAL}`, '$#,##0.00'],
  ].forEach(([label, formula, format], i) => {
    summary.Range.get({ row: 5 + i, column: 1 }).Text = label;
    const value = summary.Range.get({ row: 5 + i, column: 2 });
    value.Formula = formula;
    value.NumberFormat = format;
    value.Style.HorizontalAlignment = xls.HorizontalAlignType.Right;
    if (i % 2) summary.Range.get(`A${5 + i}:B${5 + i}`).Style.Color = xls.Color.get_WhiteSmoke();
  });

  // Date — use Date.UTC to avoid timezone shift
  summary.Range.get('A8').Text = 'Report date';
  const reportDate = summary.Range.get('B8');
  reportDate.DateTimeValue = new Date(Date.UTC(2026, 8, 28));
  reportDate.NumberFormat = 'yyyy-mm-dd';
  reportDate.Style.HorizontalAlignment = xls.HorizontalAlignType.Right;

  const kpis = summary.Range.get('A4:B8');
  kpis.Borders.LineStyle = xls.LineStyleType.Thin;
  kpis.Borders.Color = xls.Color.get_LightSteelBlue();
  summary.GridLinesVisible = false;
  summary.TabColor = xls.Color.get_LightSteelBlue();

  // ── Save, then release ──
  wb.CalculateAllValue();
  const fileName = 'SalesReport.xlsx';
  wb.SaveToFile({ fileName: fileName, version: xls.ExcelVersion.Version2016 });

  const fileData = window.dotnetRuntime.Module.FS.readFile(fileName);
  const blob = new Blob([fileData], {
    type: 'application/vnd.openxmlformats-officedocument.spreadsheetml.sheet',
  });
  const url = URL.createObjectURL(blob);
  Object.assign(document.createElement('a'), { href: url, download: fileName }).click();
  URL.revokeObjectURL(url);

  wb.Dispose(); // free the WASM heap — one workbook per generation cycle
}
레이아웃은 데이터를 따릅니다. products 배열을 자체 API의 응답으로 바꾸면 나머지 모든 것(합계, 점유율 백분율, 차트 범위, 요약 집계)이 계속 작동합니다. 모두 하드 코딩된 값이 아니라 수식이나 파생 범위로 표현되기 때문입니다.
더 많은 차트 유형과 구성 옵션은 React에서 JavaScript로 Excel 차트 만들기를 참조하세요.
CSV 데이터로 Excel 파일 만들기
CSV 파일의 표 형식 데이터를 워크시트에 로드하고 결과를 XLSX로 저장할 수 있습니다. 그런 다음 결과 통합 문서에 서식을 지정하거나 수식과 추가 워크시트로 확장할 수 있습니다:
// The library reads from its own virtual file system, so the CSV has to be
// there before you can load it — written from a string here, from the bytes of
// a File object in a real application.
const csv = "Product,Quantity,Price\nLaptop,10,999.99\nMouse,50,24.99\nKeyboard,30,59.99";
window.dotnetRuntime.Module.FS.writeFile("data.csv", new TextEncoder().encode(csv));

workbook.LoadFromFile("data.csv", ",");
workbook.SaveToFile({
    fileName: "ConvertedFromCSV.xlsx",
    version: xls.ExcelVersion.Version2016
});
가져온 시트는 파일 이름(data)을 따서 지정되므로 Worksheets.get(0)으로 선택할 수 있습니다.
구분 기호는 필수 두 번째 인수입니다. LoadFromFile("data.csv")만 사용하면 This is not a structured storage file과 함께 거부됩니다. 단일 인수 오버로드는 .xlsx 또는 .xls와 같은 구조화된 형식을 기대하며 CSV를 감지하지 않기 때문입니다.
두 번째 주의 사항이 있습니다. CSV 가져오기는 모든 필드를 텍스트로 씁니다. 수량 열은 10이 아니라 "10"으로 들어오므로 숫자로 합계하거나 정렬할 수 없습니다. 이는 이 튜토리얼 앞부분에서 설명한 바로 그 문제입니다. 저장하기 전에 필요한 열을 변환하세요:
const csvSheet = workbook.Worksheets.get(0);

// The importer leaves every field as text — coerce each numeric column.
// Columns 2 and 3 hold Quantity and Price; both arrive as "10" and "999.99".
for (let row = 2; row <= 4; row++) {
    [2, 3].forEach((column) => {
        const cell = csvSheet.Range.get({ row: row, column: column });
        if (cell.Text !== "") {
            cell.NumberValue = Number(cell.Text);
        }
    });
}
CSV와 Excel 형식 간 변환에 대한 전체 가이드는 CSV를 Excel로 변환하는 튜토리얼을 참조하세요.
XLSX 대신 XLS 파일 만들기
애플리케이션에서 .xlsx 대신 레거시 .xls 형식을 생성해야 하는 경우 버전 매개 변수를 변경하세요:
workbook.SaveToFile({
    fileName: "Report.xls",
    version: xls.ExcelVersion.Version97to2003
});
열거형 멤버는 Version97to2003입니다. Version97은 없습니다. 차트는 XLSX에 유지하세요. 테스트한 XLS 작성기는 차트 글꼴 메트릭이 필요할 때 실패합니다.
XLSX(Excel 2007 이상)는 새 애플리케이션에 권장되는 형식입니다. XLS(Excel 97–2003)는 이전 버전과의 호환성이 필요할 때만 필요합니다.
일반적인 문제
window.wasmModule이(가) 정의되지 않았습니다. 이전 샘플에서는 window.wasmModule.spirexls에서 스프레드시트 API를 읽었습니다. 현재 릴리스에서는 이를 window.spirexls에 직접 설치하고 wasmModule은 정의되지 않은 상태로 두므로 첫 번째 접근에서 바로 예외가 발생합니다. 대신 window.spirexls를 확인하세요.
WASM 모듈이 초기화되지 않았습니다. window.spirexls가 정의되지 않은 경우 런타임이 아직 로드를 완료하지 않은 것입니다. 로딩 표시기를 표시하고 초기화가 완료될 때까지 기다린 후 Excel 작업을 시도하세요.
자동 맞춤에서 글꼴 오류가 발생합니다. AutoFitColumn과 AutoFitRow는 텍스트를 측정하기 위해 시스템 글꼴이 필요하지만 WebAssembly 샌드박스에는 글꼴이 없습니다. 이들은 Cannot found font(Arial) installed on the system. 오류와 함께 실패합니다. sheet.Columns.get(i).ColumnWidth로 열 너비를 계산하거나 하드 코딩하세요.
숫자가 텍스트로 저장됩니다. cell.NumberValue = 100 대신 cell.Text = "100"을 사용하면 정렬과 계산이 깨집니다. 이는 개발자가 JavaScript에서 Excel 파일을 작성할 때 가장 흔히 겪는 문제이며 CSV 가져오기에서 자동으로 발생합니다. 숫자 데이터에는 항상 NumberValue를 사용하세요.
"평가판 경고" 시트가 나타납니다. 유효한 라이선스 없이 평가판 빌드를 사용하면 Spire.XLS가 저장된 통합 문서에 평가판 시트를 추가합니다. 이 시트는 저장할 때 다시 생성되므로 프로그래밍 방식으로 제거하는 것은 안정적인 해결 방법이 아닙니다. 라이선스 키를 적용하여 방지하세요.
장기 실행 앱에서 메모리 누수. 모든 생성 주기 후에 workbook.Dispose()를 호출하세요. 단일 페이지 애플리케이션에서는 해제되지 않은 통합 문서가 메모리를 축적하고 시간이 지남에 따라 성능을 저하시킵니다.
자주 묻는 질문
JavaScript로 Microsoft Excel 없이 Excel 파일을 만들 수 있나요?
예. JavaScript용 Spire.XLS는 WebAssembly를 통해 전적으로 브라우저에서 실행됩니다. XLSX 파일을 생성하는 데 Microsoft Excel이나 서버 측 Office 설치가 필요하지 않습니다.
JavaScript로 브라우저에서 직접 XLSX 파일을 만들 수 있나요?
예. 모든 스프레드시트 작업은 클라이언트 측에서 이루어집니다. 파일은 가상 파일 시스템에 저장된 다음 Blob으로 다운로드됩니다. 백엔드 서버가 필요하지 않습니다.
XLS와 XLSX의 차이점은 무엇인가요?
XLSX(Excel 2007 이상)는 최신 XML 기반 형식이며 새 애플리케이션에 권장됩니다. XLS(Excel 97–2003)는 레거시 이진 형식으로, 이전 시스템 호환성에 유용합니다.
결론
JavaScript로 Excel 파일을 만드는 데 백엔드 서버나 Microsoft Excel이 필요하지 않습니다. JavaScript용 Spire.XLS를 사용하면 브라우저에서 처음부터 통합 문서를 만들고, 형식이 지정된 데이터를 쓰고, 수식을 추가하고, 서식을 적용하고, 여러 시트에 걸쳐 데이터를 구성할 수 있습니다.
위의 기본 예제로 시작한 다음 필요에 따라 수식과 서식을 추가하세요. React 관련 통합 및 HTML 표 내보내기는 전용 내보내기 튜토리얼을 참조하세요.
참고 항목
Come creare file Excel in JavaScript (XLSX/XLS)
Indice
JavaScript può generare cartelle di lavoro Excel direttamente nel browser. Con Spire.XLS for JavaScript, puoi creare una cartella di lavoro, aggiungere fogli di lavoro, scrivere valori e formule, applicare la formattazione e salvare il risultato come file XLSX o XLS—tutto lato client, senza richiedere l'installazione di Microsoft Excel.
Questo tutorial inizia con una cartella di lavoro XLSX di base e poi aggiunge valori di cella tipizzati, formule, formattazione, più fogli di lavoro, supporto al download dal browser, conversione CSV e output XLS per la compatibilità con i sistemi legacy.
Installare e inizializzare Spire.XLS for JavaScript
Spire.XLS for JavaScript è distribuito all'interno del pacchetto spire.office, insieme a Spire.PDF, Spire.Doc e Spire.Presentation:
npm i spire.office
L'avvio del runtime richiede due import. Il primo avvia l'host condiviso .NET WebAssembly; il secondo registra l'API del foglio di calcolo:
// 1. Boot the shared runtime once per page.
const common = await import('/node_modules/spire.office/spire.common.js');
await common.initializeWasm();

// 2. Load the spreadsheet engine — this is what creates window.spirexls.
await import('/node_modules/spire.office/spire.xls.js');
Gli archivi Spire.*.Wasm.zip e la cartella _framework devono essere raggiungibili dalla radice del sito. Il runtime li risolve rispetto all'URL del documento anziché rispetto al modulo che ha eseguito l'import, quindi in un progetto Vite o Create React App devono trovarsi in public/. Il prefisso process.env.PUBLIC_URL mostrato nelle configurazioni basate su React è una convenzione di Create React App, non uno standard del browser — adatta il percorso di base per farlo corrispondere al tuo strumento di build se non usi CRA. Se gli archivi mancano, il browser registra WebAssembly.compile(): expected magic word — il server di sviluppo ha risposto alla richiesta dell'archivio con index.html.
Poi tutto dipende da un unico global:
const xls = window.spirexls;
Nella configurazione attuale del pacchetto utilizzata in questo tutorial, l'API del foglio di calcolo è esposta tramite window.spirexls. Usa quel global dopo che il runtime è stato inizializzato. Le versioni precedenti la esponevano come window.wasmModule.spirexls; se stai lavorando con una versione diversa del pacchetto, verifica quale global è disponibile.
Ora sei pronto a generare file Excel.
Creare un file Excel di base in JavaScript
Costruiamo un report delle vendite. Creeremo una cartella di lavoro, aggiungeremo un foglio di lavoro, scriveremo i dati dei prodotti nelle celle e salveremo il risultato come file XLSX che viene scaricato automaticamente.
async function createExcelFile() {
    const xls = window.spirexls;
    if (!xls) {
        console.error('Spire.XLS is not initialized.');
        return;
    }

    // A fresh Workbook() already contains three blank worksheets, so clear them
    // and add the single sheet this report needs.
    const workbook = new xls.Workbook();
    workbook.Worksheets.Clear();
    const sheet = workbook.Worksheets.Add("Sales Report");

    // Sample data: product sales
    const data = [
        ["Product", "Quantity", "Price"],
        ["Laptop", 10, 999.99],
        ["Mouse", 50, 24.99],
        ["Keyboard", 30, 59.99],
        ["Monitor", 15, 329.99]
    ];

    // Write data to cells
    for (let row = 0; row < data.length; row++) {
        for (let col = 0; col < data[row].length; col++) {
            const cell = sheet.Range.get({ row: row + 1, column: col + 1 });
            if (typeof data[row][col] === "string") {
                cell.Text = data[row][col];
            } else {
                cell.NumberValue = data[row][col];
            }
        }
    }

    // Save to the virtual file system, read the bytes, download, then dispose
    const fileName = "SalesReport.xlsx";
    workbook.SaveToFile({
        fileName: fileName,
        version: xls.ExcelVersion.Version2016
    });

    const fileData = window.dotnetRuntime.Module.FS.readFile(fileName);
    const blob = new Blob([fileData], {
        type: "application/vnd.openxmlformats-officedocument.spreadsheetml.sheet"
    });
    const url = URL.createObjectURL(blob);
    const a = document.createElement("a");
    a.href = url;
    a.download = fileName;
    a.click();
    URL.revokeObjectURL(url);

    workbook.Dispose();
}
Chiama createExcelFile() e otterrai un SalesReport.xlsx con quattro righe di prodotto più un'intestazione. Il flusso di lavoro è semplice: creare la cartella di lavoro → scrivere i dati → salvare → scaricare.
Le sezioni seguenti estendono questo esempio. Ogni frammento di codice presuppone di essere aggiunto all'interno di createExcelFile() dopo che la cartella di lavoro e il foglio di lavoro sono stati creati.
Scrivere tipi di dati diversi nelle celle di Excel
Excel distingue tra testo, numeri, date e valori booleani. Sbagliare questo aspetto produce file in cui l'ordinamento si rompe, le formule restituiscono errori e i numeri vengono visualizzati come testo.
const sheet = workbook.Worksheets.get(0);

// Text — for labels, names, descriptions
sheet.Range.get("A1").Text = "Product Name";

// Number — for anything you'll calculate, sort, or filter
sheet.Range.get("B1").NumberValue = 999.99;

// Date — a real DateTimeValue plus a display format
const dateCell = sheet.Range.get("C1");
dateCell.DateTimeValue = new Date(Date.UTC(2025, 2, 15));
dateCell.NumberFormat = "yyyy-mm-dd";

// Boolean — use BooleanValue, not text
sheet.Range.get("D1").BooleanValue = true;
L'errore più comune? Scrivere cell.Text = "999.99" invece di cell.NumberValue = 999.99. Il valore sembra identico quando apri il file, ma Excel lo tratta come testo—non puoi sommarlo, calcolarne la media o ordinarlo numericamente. Usa sempre NumberValue per i numeri, DateTimeValue per le date e BooleanValue per i valori booleani.
Le date richiedono una precauzione aggiuntiva. DateTimeValue conserva l'istante UTC rappresentato dall'oggetto Date di JavaScript. Creare una data con la mezzanotte locale può quindi spostare il giorno visualizzato in alcuni fusi orari; usa Date.UTC() quando vuoi che una data di calendario specifica venga conservata.
Aggiungere formule al foglio di lavoro Excel
Le formule trasformano il file generato in un vero foglio di calcolo, non solo in un mucchio di dati. Aggiungiamo una colonna Total che calcola Quantity × Price per ogni riga, più un totale generale in fondo:
// Add "Total" header
sheet.Range.get({ row: 1, column: 4 }).Text = "Total";

// Per-row formula: Total = Quantity × Price
for (let i = 2; i <= 5; i++) {
    sheet.Range.get({ row: i, column: 4 }).Formula = `=B${i}*C${i}`;
}

// Grand total row
sheet.Range.get({ row: 6, column: 1 }).Text = "Total";
sheet.Range.get({ row: 6, column: 2 }).Formula = "=SUM(B2:B5)";
sheet.Range.get({ row: 6, column: 4 }).Formula = "=SUM(D2:D5)";

// Evaluate the formulas once, so their results are written into the file.
workbook.CalculateAllValue();
Chiama workbook.CalculateAllValue() prima di salvare quando hai bisogno che la cartella di lavoro generata contenga i risultati calcolati delle formule. Questo è utile per visualizzatori o applicazioni che si affidano ai valori memorizzati nella cache invece di ricalcolare le formule all'apertura.
Per una guida completa sulle funzioni di Excel e sulle operazioni con le formule, consulta Inserire o leggere funzioni e formule nei fogli di lavoro Excel con JavaScript in React.
Formattare il file Excel generato
Un foglio di calcolo con dati grezzi funziona, ma un foglio formattato comunica. Trasformiamo il nostro report delle vendite in qualcosa che invieresti davvero a uno stakeholder:
// Bold, colored header row
const header = sheet.Range.get("A1:D1");
header.Style.Font.IsBold = true;
header.Style.Font.Size = 12;
header.Style.Color = xls.Color.get_LightSkyBlue();

// Currency format for Price and Total columns
for (let i = 2; i <= 5; i++) {
    sheet.Range.get({ row: i, column: 3 }).NumberFormat = "$#,##0.00";
    sheet.Range.get({ row: i, column: 4 }).NumberFormat = "$#,##0.00";
}

// Set column widths explicitly
[26, 10, 12, 12].forEach((width, i) => {
    sheet.Columns.get(i).ColumnWidth = width;
});

// Clean borders
const usedRange = sheet.Range.get("A1:D6");
usedRange.Borders.LineStyle = xls.LineStyleType.Thin;
usedRange.Borders.Color = xls.Color.get_LightSteelBlue();
Due dettagli meritano attenzione qui. sheet.Columns.get(i) e sheet.Rows.get(i) sono basati su 0 e usano get, a differenza del get_Item esposto da altre collezioni. E nella configurazione del browser testata, AutoFitColumn richiede un font che non è disponibile nella sandbox WebAssembly, quindi impostare ColumnWidth esplicitamente è più affidabile.
Il risultato: un'intestazione blu in grassetto, prezzi formattati come valuta, colonne di dimensioni corrette e bordi puliti.
Per una guida dettagliata sulle dimensioni di righe e colonne, consulta Impostare l'altezza delle righe e la larghezza delle colonne in Excel con JavaScript in React.
Creare più fogli di lavoro in una cartella di lavoro Excel
I report reali raramente stanno su un solo foglio. Un report delle vendite può avere un riepilogo nella prima scheda, i dettagli dei prodotti nella seconda e i dettagli mensili nella terza.
workbook.Worksheets.Clear();
const summarySheet = workbook.Worksheets.Add("Summary");
const productsSheet = workbook.Worksheets.Add("Products");
const monthlySheet = workbook.Worksheets.Add("Monthly Data");

// Products sheet — write actual data so cross-sheet formulas work
productsSheet.Range.get("A1").Text = "Product";
productsSheet.Range.get("B1").Text = "Quantity";
productsSheet.Range.get("C1").Text = "Price";
productsSheet.Range.get("D1").Text = "Total";

const products = [
    ["Laptop", 10, 999.99],
    ["Mouse", 50, 24.99],
    ["Keyboard", 30, 59.99],
    ["Monitor", 15, 329.99]
];

for (let i = 0; i < products.length; i++) {
    const row = i + 2;
    productsSheet.Range.get({ row: row, column: 1 }).Text = products[i][0];
    productsSheet.Range.get({ row: row, column: 2 }).NumberValue = products[i][1];
    productsSheet.Range.get({ row: row, column: 3 }).NumberValue = products[i][2];
    productsSheet.Range.get({ row: row, column: 4 }).Formula = `=B${row}*C${row}`;
}

// Summary sheet with cross-sheet reference
summarySheet.Range.get("A1").Text = "Sales Summary";
summarySheet.Range.get("A1").Style.Font.IsBold = true;
summarySheet.Range.get("A2").Text = "Total Products";
summarySheet.Range.get("B2").NumberValue = 4;
summarySheet.Range.get("A3").Text = "Total Revenue";
summarySheet.Range.get("B3").Formula = "=SUM(Products!D2:D5)";
Ogni Worksheets.Add(name) restituisce il foglio appena creato, nell'ordine in cui vengono effettuate le chiamate, quindi l'ordine delle schede corrisponde all'ordine del codice. Nota la formula tra fogli: =SUM(Products!D2:D5) nel foglio Summary fa riferimento alla colonna Total del foglio Products. Excel gestisce questo automaticamente all'apertura del file—non serve codice aggiuntivo.
Per ulteriori informazioni sulla gestione dei fogli di lavoro — aggiunta, rimozione e riordino dei fogli — consulta Aggiungere, rimuovere e spostare fogli di lavoro Excel con JavaScript in React.
Salvare e scaricare il file XLSX nel browser
Una volta che la cartella di lavoro è pronta, Spire.XLS la salva in un file system virtuale WebAssembly. Poi leggi i dati del file, li converti in un Blob e avvii il download:
workbook.SaveToFile({
    fileName: "Report.xlsx",
    version: xls.ExcelVersion.Version2016
});

const fileData = window.dotnetRuntime.Module.FS.readFile("Report.xlsx");
const blob = new Blob([fileData], {
    type: "application/vnd.openxmlformats-officedocument.spreadsheetml.sheet"
});
const url = URL.createObjectURL(blob);
const a = document.createElement("a");
a.href = url;
a.download = "Report.xlsx";
a.click();
URL.revokeObjectURL(url);

workbook.Dispose();
Chiama sempre workbook.Dispose() dopo il download per liberare memoria—soprattutto nelle app in cui gli utenti generano più file in una sessione. La cartella di lavoro stessa risiede nell'heap WebAssembly finché non lo fai, e quell'heap non viene recuperato dal garbage collector del browser.
Cerchi l'integrazione con React o l'esportazione di tabelle HTML? Dai un'occhiata alla nostra guida al download e all'esportazione di file Excel in JavaScript e React.
Mettere tutto insieme: un report delle vendite formattato
I frammenti precedenti costruiscono una cartella di lavoro un aspetto alla volta. Eccoli in un'unica funzione: un foglio di lavoro formattato con righe alternate (zebra) e formati di valuta, colonne Ricavi e Quota guidate da formule, un grafico a colonne e un secondo foglio di lavoro che riepiloga i numeri.
/**
 * Build a formatted sales report workbook in the browser and download it as
 * SalesReport.xlsx.
 *
 * The layout is driven by `products` below — swap it for form input, an API
 * response or component state and nothing else needs to change.
 */
async function createExcelReport() {
  // spire.office 11.7.0 exposes Spire.XLS as `window.spirexls`. Older builds
  // hung it off `window.wasmModule.spirexls`; that global no longer exists.
  const xls = window.spirexls;
  if (!xls) throw new Error('Spire.XLS is not ready yet');

  // [product, units sold, unit price] — revenue and share are derived by formula
  const products = [
    ['Atlas 14 Ultrabook', 42, 1249.0],
    ['Orbit Wireless Mouse', 380, 24.99],
    ['Vertex Mechanical Keyboard', 165, 89.5],
    ['Lumen 27 4K Monitor', 74, 429.0],
    ['Halo USB-C Dock', 210, 139.0],
    ['Pulse ANC Headset', 128, 199.0],
  ];
  const FIRST = 5; // first data row
  const TOTAL = FIRST + products.length; // total row

  const wb = new xls.Workbook();
  wb.Worksheets.Clear();
  const sheet = wb.Worksheets.Add('Sales Report');

  const at = (a) => sheet.Range.get(a);
  const cell = (row, col) => sheet.Range.get({ row: row, column: col });
  const paint = (a, colour) => {
    at(a).Style.Color = colour;
  };

  // ── Sizing ── explicit widths (AutoFitColumn is unreliable in the WASM sandbox)
  [34, 9, 13, 14, 9].forEach((w, i) => {
    sheet.Columns.get(i).ColumnWidth = w;
  });
  sheet.Rows.get(0).RowHeight = 34; // title
  sheet.Rows.get(1).RowHeight = 20; // subtitle
  sheet.Rows.get(2).RowHeight = 8; // spacer
  sheet.Rows.get(3).RowHeight = 24; // header

  // ── Title band ── merge first, then style the whole merged area
  at('A1:E1').Merge();
  cell(1, 1).Text = 'Sales Report — Q3 2026';
  paint('A1:E1', xls.Color.get_DarkBlue());
  at('A1:E1').Style.Font.Color = xls.Color.get_White();
  at('A1:E1').Style.Font.IsBold = true;
  at('A1:E1').Style.Font.Size = 15;
  at('A1:E1').Style.VerticalAlignment = xls.VerticalAlignType.Center;

  at('A2:E2').Merge();
  cell(2, 1).Text = 'Region: West · Period: 1 Jul – 30 Sep 2026 · Amounts in USD';
  paint('A2:E2', xls.Color.get_DarkBlue());
  at('A2:E2').Style.Font.Color = xls.Color.get_LightSteelBlue();
  at('A2:E2').Style.Font.Size = 9.5;
  at('A2:E2').Style.VerticalAlignment = xls.VerticalAlignType.Center;

  // ── Header row ───────────────────────────────────────────────────────────
  ['Product', 'Units', 'Unit Price', 'Revenue', 'Share'].forEach((label, i) => {
    cell(4, i + 1).Text = label;
  });
  paint('A4:E4', xls.Color.get_LightSteelBlue());
  at('A4:E4').Style.Font.Color = xls.Color.get_DarkBlue();
  at('A4:E4').Style.Font.IsBold = true;
  at('A4:E4').Style.Font.Size = 10.5;
  at('A4:E4').Style.HorizontalAlignment = xls.HorizontalAlignType.Center;
  at('A4:E4').Style.VerticalAlignment = xls.VerticalAlignType.Center;

  // ── Data rows ── numbers go in as NumberValue, never as text
  products.forEach(([name, units, price], i) => {
    const r = FIRST + i;
    cell(r, 1).Text = name;
    cell(r, 2).NumberValue = units;
    cell(r, 3).NumberValue = price;
    cell(r, 4).Formula = `=B${r}*C${r}`;
    cell(r, 5).Formula = `=D${r}/$D${TOTAL}`; // share of the grand total
    sheet.Rows.get(r - 1).RowHeight = 20;
    if (i % 2) paint(`A${r}:E${r}`, xls.Color.get_WhiteSmoke()); // zebra banding
  });

  // ── Total row ────────────────────────────────────────────────────────────
  cell(TOTAL, 1).Text = 'Total';
  [2, 4, 5].forEach((col) => {
    const letter = String.fromCharCode(64 + col);
    cell(TOTAL, col).Formula = `=SUM(${letter}${FIRST}:${letter}${TOTAL - 1})`;
  });
  paint(`A${TOTAL}:E${TOTAL}`, xls.Color.get_LightSkyBlue());
  at(`A${TOTAL}:E${TOTAL}`).Style.Font.IsBold = true;
  sheet.Rows.get(TOTAL - 1).RowHeight = 22;

  // ── Number formats and borders ───────────────────────────────────────────
  at(`B${FIRST}:B${TOTAL}`).NumberFormat = '#,##0';
  at(`C${FIRST}:D${TOTAL}`).NumberFormat = '$#,##0.00';
  at(`E${FIRST}:E${TOTAL}`).NumberFormat = '0.0%';

  const table = at(`A4:E${TOTAL}`);
  table.Borders.LineStyle = xls.LineStyleType.Thin;
  table.Borders.Color = xls.Color.get_LightSteelBlue();
  at(`A${TOTAL}:E${TOTAL}`).Borders.get_Item(xls.BordersLineType.EdgeTop).LineStyle =
    xls.LineStyleType.Medium;

  // ── Chart ── build the series by hand (DataRange would mix units)
  const chart = sheet.Charts.Add();
  chart.ChartType = xls.ExcelChartType.ColumnClustered;
  chart.LeftColumn = 6;
  chart.TopRow = 3;
  chart.RightColumn = 13;
  chart.BottomRow = 21;
  const serie = chart.Series.Add();
  serie.CategoryLabels = at(`A${FIRST}:A${TOTAL - 1}`);
  serie.Values = at(`D${FIRST}:D${TOTAL - 1}`);
  serie.Name = 'Revenue';
  chart.ChartTitleArea.Text = 'Revenue by product';
  chart.HasLegend = false;
  chart.PrimaryValueAxis.NumberFormat = '$#,##0';

  // ── Sheet chrome ──
  sheet.FreezePanes(FIRST, 1);
  sheet.GridLinesVisible = false;
  sheet.TabColor = xls.Color.get_DarkBlue();

  // ── Second worksheet: cross-sheet roll-up ──
  const summary = wb.Worksheets.Add('Summary');
  summary.Columns.get(0).ColumnWidth = 26;
  summary.Columns.get(1).ColumnWidth = 18;
  summary.Rows.get(0).RowHeight = 30;
  summary.Rows.get(1).RowHeight = 18;
  summary.Rows.get(3).RowHeight = 22;

  const band = (a, text, size) => {
    summary.Range.get(a).Merge();
    summary.Range.get(a.split(':')[0]).Text = text;
    summary.Range.get(a).Style.Color = xls.Color.get_DarkBlue();
    summary.Range.get(a).Style.Font.Color = xls.Color.get_White();
    summary.Range.get(a).Style.Font.IsBold = true;
    summary.Range.get(a).Style.Font.Size = size;
    summary.Range.get(a).Style.VerticalAlignment = xls.VerticalAlignType.Center;
  };
  band('A1:B1', 'Executive Summary', 14);
  band('A2:B2', 'Sales Report · Q3 2026', 9.5);

  ['Metric', 'Value'].forEach((label, i) => {
    summary.Range.get({ row: 4, column: i + 1 }).Text = label;
  });
  summary.Range.get('A4:B4').Style.Color = xls.Color.get_LightSteelBlue();
  summary.Range.get('A4:B4').Style.Font.Color = xls.Color.get_DarkBlue();
  summary.Range.get('A4:B4').Style.Font.IsBold = true;

  [
    ['Total revenue', "='Sales Report'!D" + TOTAL, '$#,##0.00'],
    ['Units shipped', "='Sales Report'!B" + TOTAL, '#,##0'],
    ['Average unit price', `='Sales Report'!D${TOTAL}/'Sales Report'!B${TOTAL}`, '$#,##0.00'],
  ].forEach(([label, formula, format], i) => {
    summary.Range.get({ row: 5 + i, column: 1 }).Text = label;
    const value = summary.Range.get({ row: 5 + i, column: 2 });
    value.Formula = formula;
    value.NumberFormat = format;
    value.Style.HorizontalAlignment = xls.HorizontalAlignType.Right;
    if (i % 2) summary.Range.get(`A${5 + i}:B${5 + i}`).Style.Color = xls.Color.get_WhiteSmoke();
  });

  // Date — use Date.UTC to avoid timezone shift
  summary.Range.get('A8').Text = 'Report date';
  const reportDate = summary.Range.get('B8');
  reportDate.DateTimeValue = new Date(Date.UTC(2026, 8, 28));
  reportDate.NumberFormat = 'yyyy-mm-dd';
  reportDate.Style.HorizontalAlignment = xls.HorizontalAlignType.Right;

  const kpis = summary.Range.get('A4:B8');
  kpis.Borders.LineStyle = xls.LineStyleType.Thin;
  kpis.Borders.Color = xls.Color.get_LightSteelBlue();
  summary.GridLinesVisible = false;
  summary.TabColor = xls.Color.get_LightSteelBlue();

  // ── Save, then release ──
  wb.CalculateAllValue();
  const fileName = 'SalesReport.xlsx';
  wb.SaveToFile({ fileName: fileName, version: xls.ExcelVersion.Version2016 });

  const fileData = window.dotnetRuntime.Module.FS.readFile(fileName);
  const blob = new Blob([fileData], {
    type: 'application/vnd.openxmlformats-officedocument.spreadsheetml.sheet',
  });
  const url = URL.createObjectURL(blob);
  Object.assign(document.createElement('a'), { href: url, download: fileName }).click();
  URL.revokeObjectURL(url);

  wb.Dispose(); // free the WASM heap — one workbook per generation cycle
}
Il layout segue i dati. Sostituisci l'array products con una risposta della tua API e tutto il resto — totali, percentuali di quota, intervallo del grafico, riepilogo — continua a funzionare, perché è tutto espresso come formule o intervalli derivati anziché come valori hard-coded.
Per altri tipi di grafici e opzioni di configurazione, consulta Creare grafici Excel con JavaScript in React.
Creare un file Excel da dati CSV
Puoi caricare dati tabulari da un file CSV in un foglio di lavoro e salvare il risultato come XLSX. La cartella di lavoro risultante può poi essere formattata o estesa con formule e fogli di lavoro aggiuntivi:
// The library reads from its own virtual file system, so the CSV has to be
// there before you can load it — written from a string here, from the bytes of
// a File object in a real application.
const csv = "Product,Quantity,Price\nLaptop,10,999.99\nMouse,50,24.99\nKeyboard,30,59.99";
window.dotnetRuntime.Module.FS.writeFile("data.csv", new TextEncoder().encode(csv));

workbook.LoadFromFile("data.csv", ",");
workbook.SaveToFile({
    fileName: "ConvertedFromCSV.xlsx",
    version: xls.ExcelVersion.Version2016
});
Il foglio importato prende il nome dal file (data), quindi Worksheets.get(0) lo seleziona.
Il separatore è un secondo argomento obbligatorio. LoadFromFile("data.csv") da solo viene rifiutato con This is not a structured storage file, perché l'overload con un solo argomento si aspetta un formato strutturato come .xlsx o .xls e non riconosce il CSV.
C'è una seconda insidia: l'importatore CSV scrive ogni campo come testo. Una colonna di quantità arriva come "10" anziché 10, il che significa che non può essere sommata o ordinata numericamente — esattamente il problema descritto in precedenza in questo tutorial. Converti le colonne di cui hai bisogno prima di salvare:
const csvSheet = workbook.Worksheets.get(0);

// The importer leaves every field as text — coerce each numeric column.
// Columns 2 and 3 hold Quantity and Price; both arrive as "10" and "999.99".
for (let row = 2; row <= 4; row++) {
    [2, 3].forEach((column) => {
        const cell = csvSheet.Range.get({ row: row, column: column });
        if (cell.Text !== "") {
            cell.NumberValue = Number(cell.Text);
        }
    });
}
Per una guida completa sulla conversione tra formati CSV ed Excel, consulta il nostro tutorial sulla conversione da CSV a Excel.
Creare un file XLS invece di XLSX
Se la tua applicazione deve generare il formato legacy .xls invece di .xlsx, modifica il parametro version:
workbook.SaveToFile({
    fileName: "Report.xls",
    version: xls.ExcelVersion.Version97to2003
});
Il membro dell'enum è Version97to2003 — non esiste Version97. Mantieni i grafici in XLSX; il writer XLS testato fallisce quando sono richieste le metriche dei font dei grafici.
XLSX (Excel 2007+) è il formato consigliato per le nuove applicazioni. XLS (Excel 97–2003) è necessario solo quando è richiesta la compatibilità con le versioni precedenti.
Problemi comuni
window.wasmModule non è definito. I vecchi esempi leggono l'API del foglio di calcolo da window.wasmModule.spirexls. Le versioni attuali la installano direttamente su window.spirexls e lasciano wasmModule non definito, quindi il primo accesso genera un'eccezione. Controlla invece window.spirexls.
Modulo WASM non inizializzato. Se window.spirexls non è definito, il runtime non ha terminato il caricamento. Mostra un indicatore di caricamento e attendi il completamento dell'inizializzazione prima di tentare qualsiasi operazione su Excel.
L'adattamento automatico genera un errore sui font. AutoFitColumn e AutoFitRow richiedono un font di sistema per misurare il testo, e la sandbox WebAssembly non ne ha nessuno. Falliscono con Cannot found font(Arial) installed on the system. Calcola o codifica manualmente la larghezza delle colonne con sheet.Columns.get(i).ColumnWidth.
Numeri memorizzati come testo. Usare cell.Text = "100" invece di cell.NumberValue = 100 rompe l'ordinamento e i calcoli. Questo è il problema più comune che gli sviluppatori incontrano quando scrivono file Excel in JavaScript, e l'importazione CSV lo attiva automaticamente—usa sempre NumberValue per i dati numerici.
Compare un foglio "Evaluation Warning". Quando si utilizza la build di valutazione senza una licenza valida, Spire.XLS aggiunge un foglio di valutazione alla cartella di lavoro salvata. Questo foglio viene ricreato al salvataggio, quindi rimuoverlo a livello di codice non è una soluzione affidabile. Applica una chiave di licenza per evitarlo.
Perdite di memoria nelle app a esecuzione prolungata. Chiama workbook.Dispose() dopo ogni ciclo di generazione. Nelle applicazioni a pagina singola, le cartelle di lavoro non eliminate accumulano memoria e degradano le prestazioni nel tempo.
Domande frequenti
JavaScript può creare file Excel senza Microsoft Excel?
Sì. Spire.XLS for JavaScript viene eseguito interamente nel browser tramite WebAssembly. Non è necessaria alcuna installazione di Microsoft Excel o di Office lato server per generare file XLSX.
JavaScript può creare file XLSX direttamente nel browser?
Sì. Tutte le operazioni sul foglio di calcolo avvengono lato client. Il file viene salvato in un file system virtuale, quindi scaricato come Blob—non serve alcun server backend.
Qual è la differenza tra XLS e XLSX?
XLSX (Excel 2007 e versioni successive) è il formato moderno basato su XML, consigliato per le nuove applicazioni. XLS (Excel 97–2003) è il formato binario legacy, utile per la compatibilità con sistemi più vecchi.
Conclusione
Creare file Excel in JavaScript non richiede un server backend né Microsoft Excel. Con Spire.XLS for JavaScript, puoi creare cartelle di lavoro da zero, scrivere dati tipizzati, aggiungere formule, applicare la formattazione e organizzare i dati su più fogli—tutto nel browser.
Inizia con l'esempio di base sopra, poi aggiungi gradualmente formule e formattazione man mano che le tue esigenze crescono. Per l'integrazione specifica con React e l'esportazione di tabelle HTML, consulta il nostro tutorial dedicato all'esportazione.
Vedi anche
Comment créer des fichiers Excel en JavaScript (XLSX/XLS)
Table des matières
JavaScript peut générer des classeurs Excel directement dans le navigateur. Avec Spire.XLS pour JavaScript, vous pouvez créer un classeur, ajouter des feuilles de calcul, écrire des valeurs et des formules, appliquer une mise en forme et enregistrer le résultat au format XLSX ou XLS — entièrement côté client, sans nécessiter l'installation de Microsoft Excel.
Ce tutoriel commence par un classeur XLSX de base, puis ajoute des valeurs de cellules typées, des formules, une mise en forme, plusieurs feuilles de calcul, la prise en charge du téléchargement dans le navigateur, la conversion CSV et l'export XLS pour la compatibilité avec les formats hérités.
Installer et initialiser Spire.XLS pour JavaScript
Spire.XLS pour JavaScript est fourni dans le package spire.office, avec Spire.PDF, Spire.Doc et Spire.Presentation :
npm i spire.office
Le démarrage du runtime nécessite deux imports. Le premier lance l'hôte .NET WebAssembly partagé ; le second enregistre l'API de feuille de calcul :
// 1. Boot the shared runtime once per page.
const common = await import('/node_modules/spire.office/spire.common.js');
await common.initializeWasm();

// 2. Load the spreadsheet engine — this is what creates window.spirexls.
await import('/node_modules/spire.office/spire.xls.js');
Les archives Spire.*.Wasm.zip et le dossier _framework doivent être accessibles depuis la racine du site. Le runtime les résout par rapport à l'URL du document plutôt qu'au module qui a effectué l'import ; dans un projet Vite ou Create React App, ils doivent donc se trouver dans public/. Le préfixe process.env.PUBLIC_URL présenté dans les configurations basées sur React est une convention de Create React App, et non un standard du navigateur — ajustez le chemin de base en fonction de votre outil de build si vous n'utilisez pas CRA. Si les archives sont manquantes, le navigateur consigne WebAssembly.compile(): expected magic word — le serveur de développement a répondu à la requête d'archive avec index.html.
Tout repose ensuite sur un seul global :
const xls = window.spirexls;
Dans la configuration de package actuelle utilisée par ce tutoriel, l'API de feuille de calcul est exposée via window.spirexls. Utilisez ce global après l'initialisation du runtime. Les versions plus anciennes l'exposaient sous window.wasmModule.spirexls ; si vous travaillez avec une version de package différente, vérifiez quel global est disponible.
Vous êtes maintenant prêt à générer des fichiers Excel.
Créer un fichier Excel de base en JavaScript
Construisons un rapport de ventes. Nous allons créer un classeur, ajouter une feuille de calcul, écrire les données produits dans les cellules et enregistrer le résultat sous la forme d'un fichier XLSX qui se télécharge automatiquement.
async function createExcelFile() {
    const xls = window.spirexls;
    if (!xls) {
        console.error('Spire.XLS is not initialized.');
        return;
    }

    // A fresh Workbook() already contains three blank worksheets, so clear them
    // and add the single sheet this report needs.
    const workbook = new xls.Workbook();
    workbook.Worksheets.Clear();
    const sheet = workbook.Worksheets.Add("Sales Report");

    // Sample data: product sales
    const data = [
        ["Product", "Quantity", "Price"],
        ["Laptop", 10, 999.99],
        ["Mouse", 50, 24.99],
        ["Keyboard", 30, 59.99],
        ["Monitor", 15, 329.99]
    ];

    // Write data to cells
    for (let row = 0; row < data.length; row++) {
        for (let col = 0; col < data[row].length; col++) {
            const cell = sheet.Range.get({ row: row + 1, column: col + 1 });
            if (typeof data[row][col] === "string") {
                cell.Text = data[row][col];
            } else {
                cell.NumberValue = data[row][col];
            }
        }
    }

    // Save to the virtual file system, read the bytes, download, then dispose
    const fileName = "SalesReport.xlsx";
    workbook.SaveToFile({
        fileName: fileName,
        version: xls.ExcelVersion.Version2016
    });

    const fileData = window.dotnetRuntime.Module.FS.readFile(fileName);
    const blob = new Blob([fileData], {
        type: "application/vnd.openxmlformats-officedocument.spreadsheetml.sheet"
    });
    const url = URL.createObjectURL(blob);
    const a = document.createElement("a");
    a.href = url;
    a.download = fileName;
    a.click();
    URL.revokeObjectURL(url);

    workbook.Dispose();
}
Appelez createExcelFile() et vous obtiendrez un SalesReport.xlsx contenant quatre lignes de produits plus un en-tête. Le flux de travail est simple : créer le classeur → écrire les données → enregistrer → télécharger.
Les sections suivantes étendent cet exemple. Chaque extrait de code suppose qu'il est ajouté à l'intérieur de createExcelFile() après la création du classeur et de la feuille de calcul.
Écrire différents types de données dans les cellules Excel
Excel distingue le texte, les nombres, les dates et les booléens. Se tromper à ce sujet produit des fichiers où le tri ne fonctionne plus, où les formules renvoient des erreurs et où les nombres s'affichent sous forme de texte.
const sheet = workbook.Worksheets.get(0);

// Text — for labels, names, descriptions
sheet.Range.get("A1").Text = "Product Name";

// Number — for anything you'll calculate, sort, or filter
sheet.Range.get("B1").NumberValue = 999.99;

// Date — a real DateTimeValue plus a display format
const dateCell = sheet.Range.get("C1");
dateCell.DateTimeValue = new Date(Date.UTC(2025, 2, 15));
dateCell.NumberFormat = "yyyy-mm-dd";

// Boolean — use BooleanValue, not text
sheet.Range.get("D1").BooleanValue = true;
L'erreur la plus courante ? Écrire cell.Text = "999.99" au lieu de cell.NumberValue = 999.99. La valeur semble identique à l'ouverture du fichier, mais Excel la traite comme du texte — vous ne pouvez ni l'additionner, ni en faire la moyenne, ni la trier numériquement. Utilisez toujours NumberValue pour les nombres, DateTimeValue pour les dates et BooleanValue pour les booléens.
Les dates nécessitent une précaution supplémentaire. DateTimeValue conserve l'instant UTC représenté par l'objet Date JavaScript. Créer une date avec minuit en heure locale peut donc décaler le jour affiché dans certains fuseaux horaires ; utilisez Date.UTC() lorsque vous souhaitez préserver une date calendaire précise.
Ajouter des formules à la feuille de calcul Excel
Les formules font de votre fichier généré une véritable feuille de calcul, et non un simple export de données. Ajoutons une colonne Total qui calcule Quantity × Price pour chaque ligne, ainsi qu'un total général en bas :
// Add "Total" header
sheet.Range.get({ row: 1, column: 4 }).Text = "Total";

// Per-row formula: Total = Quantity × Price
for (let i = 2; i <= 5; i++) {
    sheet.Range.get({ row: i, column: 4 }).Formula = `=B${i}*C${i}`;
}

// Grand total row
sheet.Range.get({ row: 6, column: 1 }).Text = "Total";
sheet.Range.get({ row: 6, column: 2 }).Formula = "=SUM(B2:B5)";
sheet.Range.get({ row: 6, column: 4 }).Formula = "=SUM(D2:D5)";

// Evaluate the formulas once, so their results are written into the file.
workbook.CalculateAllValue();
Appelez workbook.CalculateAllValue() avant d'enregistrer lorsque vous avez besoin que le classeur généré contienne les résultats calculés des formules. Cela est utile pour les visionneuses ou les applications qui s'appuient sur des valeurs mises en cache au lieu de recalculer les formules à l'ouverture.
Pour un guide complet des fonctions Excel et des opérations sur les formules, consultez Insérer ou lire des fonctions et des formules dans les feuilles de calcul Excel avec JavaScript dans React.
Mettre en forme le fichier Excel généré
Une feuille de calcul contenant des données brutes fonctionne, mais une feuille de calcul mise en forme communique. Transformons notre rapport de ventes en un document que vous enverriez réellement à une partie prenante :
// Bold, colored header row
const header = sheet.Range.get("A1:D1");
header.Style.Font.IsBold = true;
header.Style.Font.Size = 12;
header.Style.Color = xls.Color.get_LightSkyBlue();

// Currency format for Price and Total columns
for (let i = 2; i <= 5; i++) {
    sheet.Range.get({ row: i, column: 3 }).NumberFormat = "$#,##0.00";
    sheet.Range.get({ row: i, column: 4 }).NumberFormat = "$#,##0.00";
}

// Set column widths explicitly
[26, 10, 12, 12].forEach((width, i) => {
    sheet.Columns.get(i).ColumnWidth = width;
});

// Clean borders
const usedRange = sheet.Range.get("A1:D6");
usedRange.Borders.LineStyle = xls.LineStyleType.Thin;
usedRange.Borders.Color = xls.Color.get_LightSteelBlue();
Deux détails méritent d'être connus ici. sheet.Columns.get(i) et sheet.Rows.get(i) sont basés sur 0 et utilisent get, contrairement au get_Item exposé par d'autres collections. Et dans la configuration de navigateur testée, AutoFitColumn nécessite une police qui n'est pas disponible dans le bac à sable WebAssembly, donc définir ColumnWidth explicitement est plus fiable.
Le résultat : un en-tête bleu en gras, des prix au format monétaire, des colonnes correctement dimensionnées et des bordures nettes.
Pour des conseils détaillés sur les dimensions des lignes et des colonnes, consultez Définir la hauteur de ligne et la largeur de colonne dans Excel avec JavaScript dans React.
Créer plusieurs feuilles de calcul dans un classeur Excel
Les vrais rapports tiennent rarement sur une seule feuille. Un rapport de ventes peut comporter un récapitulatif sur le premier onglet, le détail des produits sur le second et des répartitions mensuelles sur le troisième.
workbook.Worksheets.Clear();
const summarySheet = workbook.Worksheets.Add("Summary");
const productsSheet = workbook.Worksheets.Add("Products");
const monthlySheet = workbook.Worksheets.Add("Monthly Data");

// Products sheet — write actual data so cross-sheet formulas work
productsSheet.Range.get("A1").Text = "Product";
productsSheet.Range.get("B1").Text = "Quantity";
productsSheet.Range.get("C1").Text = "Price";
productsSheet.Range.get("D1").Text = "Total";

const products = [
    ["Laptop", 10, 999.99],
    ["Mouse", 50, 24.99],
    ["Keyboard", 30, 59.99],
    ["Monitor", 15, 329.99]
];

for (let i = 0; i < products.length; i++) {
    const row = i + 2;
    productsSheet.Range.get({ row: row, column: 1 }).Text = products[i][0];
    productsSheet.Range.get({ row: row, column: 2 }).NumberValue = products[i][1];
    productsSheet.Range.get({ row: row, column: 3 }).NumberValue = products[i][2];
    productsSheet.Range.get({ row: row, column: 4 }).Formula = `=B${row}*C${row}`;
}

// Summary sheet with cross-sheet reference
summarySheet.Range.get("A1").Text = "Sales Summary";
summarySheet.Range.get("A1").Style.Font.IsBold = true;
summarySheet.Range.get("A2").Text = "Total Products";
summarySheet.Range.get("B2").NumberValue = 4;
summarySheet.Range.get("A3").Text = "Total Revenue";
summarySheet.Range.get("B3").Formula = "=SUM(Products!D2:D5)";
Chaque Worksheets.Add(name) renvoie la feuille qu'il vient de créer, dans l'ordre des appels, de sorte que l'ordre des onglets correspond à l'ordre du code. Remarquez la formule inter-feuilles : =SUM(Products!D2:D5) dans la feuille Summary fait référence à la colonne Total de la feuille Products. Excel gère cela automatiquement à l'ouverture du fichier — aucun code supplémentaire n'est nécessaire.
Pour en savoir plus sur la gestion des feuilles de calcul — ajout, suppression et réorganisation des feuilles — consultez Ajouter, supprimer et déplacer des feuilles de calcul Excel avec JavaScript dans React.
Enregistrer et télécharger le fichier XLSX dans le navigateur
Une fois votre classeur prêt, Spire.XLS l'enregistre dans un système de fichiers virtuel WebAssembly. Vous lisez ensuite les données du fichier, les convertissez en Blob et déclenchez un téléchargement :
workbook.SaveToFile({
    fileName: "Report.xlsx",
    version: xls.ExcelVersion.Version2016
});

const fileData = window.dotnetRuntime.Module.FS.readFile("Report.xlsx");
const blob = new Blob([fileData], {
    type: "application/vnd.openxmlformats-officedocument.spreadsheetml.sheet"
});
const url = URL.createObjectURL(blob);
const a = document.createElement("a");
a.href = url;
a.download = "Report.xlsx";
a.click();
URL.revokeObjectURL(url);

workbook.Dispose();
Appelez toujours workbook.Dispose() après le téléchargement pour libérer la mémoire — en particulier dans les applications où les utilisateurs génèrent plusieurs fichiers au cours d'une même session. Le classeur lui-même réside dans le tas WebAssembly jusqu'à ce que vous le fassiez, et ce tas n'est pas récupéré par le ramasse-miettes du navigateur.
Vous cherchez une intégration React ou un export de tableau HTML ? Consultez notre guide pour télécharger et exporter des fichiers Excel en JavaScript et React.
Mise en pratique : un rapport de ventes mis en forme
Les extraits ci-dessus construisent un classeur un aspect à la fois. Les voici réunis dans une seule fonction : une feuille de calcul stylisée avec un fond alterné et des formats monétaires, des colonnes de chiffre d'affaires et de part calculées par formule, un graphique à colonnes et une deuxième feuille de calcul qui consolide les chiffres.
/**
 * Build a formatted sales report workbook in the browser and download it as
 * SalesReport.xlsx.
 *
 * The layout is driven by `products` below — swap it for form input, an API
 * response or component state and nothing else needs to change.
 */
async function createExcelReport() {
  // spire.office 11.7.0 exposes Spire.XLS as `window.spirexls`. Older builds
  // hung it off `window.wasmModule.spirexls`; that global no longer exists.
  const xls = window.spirexls;
  if (!xls) throw new Error('Spire.XLS is not ready yet');

  // [product, units sold, unit price] — revenue and share are derived by formula
  const products = [
    ['Atlas 14 Ultrabook', 42, 1249.0],
    ['Orbit Wireless Mouse', 380, 24.99],
    ['Vertex Mechanical Keyboard', 165, 89.5],
    ['Lumen 27 4K Monitor', 74, 429.0],
    ['Halo USB-C Dock', 210, 139.0],
    ['Pulse ANC Headset', 128, 199.0],
  ];
  const FIRST = 5; // first data row
  const TOTAL = FIRST + products.length; // total row

  const wb = new xls.Workbook();
  wb.Worksheets.Clear();
  const sheet = wb.Worksheets.Add('Sales Report');

  const at = (a) => sheet.Range.get(a);
  const cell = (row, col) => sheet.Range.get({ row: row, column: col });
  const paint = (a, colour) => {
    at(a).Style.Color = colour;
  };

  // ── Sizing ── explicit widths (AutoFitColumn is unreliable in the WASM sandbox)
  [34, 9, 13, 14, 9].forEach((w, i) => {
    sheet.Columns.get(i).ColumnWidth = w;
  });
  sheet.Rows.get(0).RowHeight = 34; // title
  sheet.Rows.get(1).RowHeight = 20; // subtitle
  sheet.Rows.get(2).RowHeight = 8; // spacer
  sheet.Rows.get(3).RowHeight = 24; // header

  // ── Title band ── merge first, then style the whole merged area
  at('A1:E1').Merge();
  cell(1, 1).Text = 'Sales Report — Q3 2026';
  paint('A1:E1', xls.Color.get_DarkBlue());
  at('A1:E1').Style.Font.Color = xls.Color.get_White();
  at('A1:E1').Style.Font.IsBold = true;
  at('A1:E1').Style.Font.Size = 15;
  at('A1:E1').Style.VerticalAlignment = xls.VerticalAlignType.Center;

  at('A2:E2').Merge();
  cell(2, 1).Text = 'Region: West · Period: 1 Jul – 30 Sep 2026 · Amounts in USD';
  paint('A2:E2', xls.Color.get_DarkBlue());
  at('A2:E2').Style.Font.Color = xls.Color.get_LightSteelBlue();
  at('A2:E2').Style.Font.Size = 9.5;
  at('A2:E2').Style.VerticalAlignment = xls.VerticalAlignType.Center;

  // ── Header row ───────────────────────────────────────────────────────────
  ['Product', 'Units', 'Unit Price', 'Revenue', 'Share'].forEach((label, i) => {
    cell(4, i + 1).Text = label;
  });
  paint('A4:E4', xls.Color.get_LightSteelBlue());
  at('A4:E4').Style.Font.Color = xls.Color.get_DarkBlue();
  at('A4:E4').Style.Font.IsBold = true;
  at('A4:E4').Style.Font.Size = 10.5;
  at('A4:E4').Style.HorizontalAlignment = xls.HorizontalAlignType.Center;
  at('A4:E4').Style.VerticalAlignment = xls.VerticalAlignType.Center;

  // ── Data rows ── numbers go in as NumberValue, never as text
  products.forEach(([name, units, price], i) => {
    const r = FIRST + i;
    cell(r, 1).Text = name;
    cell(r, 2).NumberValue = units;
    cell(r, 3).NumberValue = price;
    cell(r, 4).Formula = `=B${r}*C${r}`;
    cell(r, 5).Formula = `=D${r}/$D${TOTAL}`; // share of the grand total
    sheet.Rows.get(r - 1).RowHeight = 20;
    if (i % 2) paint(`A${r}:E${r}`, xls.Color.get_WhiteSmoke()); // zebra banding
  });

  // ── Total row ────────────────────────────────────────────────────────────
  cell(TOTAL, 1).Text = 'Total';
  [2, 4, 5].forEach((col) => {
    const letter = String.fromCharCode(64 + col);
    cell(TOTAL, col).Formula = `=SUM(${letter}${FIRST}:${letter}${TOTAL - 1})`;
  });
  paint(`A${TOTAL}:E${TOTAL}`, xls.Color.get_LightSkyBlue());
  at(`A${TOTAL}:E${TOTAL}`).Style.Font.IsBold = true;
  sheet.Rows.get(TOTAL - 1).RowHeight = 22;

  // ── Number formats and borders ───────────────────────────────────────────
  at(`B${FIRST}:B${TOTAL}`).NumberFormat = '#,##0';
  at(`C${FIRST}:D${TOTAL}`).NumberFormat = '$#,##0.00';
  at(`E${FIRST}:E${TOTAL}`).NumberFormat = '0.0%';

  const table = at(`A4:E${TOTAL}`);
  table.Borders.LineStyle = xls.LineStyleType.Thin;
  table.Borders.Color = xls.Color.get_LightSteelBlue();
  at(`A${TOTAL}:E${TOTAL}`).Borders.get_Item(xls.BordersLineType.EdgeTop).LineStyle =
    xls.LineStyleType.Medium;

  // ── Chart ── build the series by hand (DataRange would mix units)
  const chart = sheet.Charts.Add();
  chart.ChartType = xls.ExcelChartType.ColumnClustered;
  chart.LeftColumn = 6;
  chart.TopRow = 3;
  chart.RightColumn = 13;
  chart.BottomRow = 21;
  const serie = chart.Series.Add();
  serie.CategoryLabels = at(`A${FIRST}:A${TOTAL - 1}`);
  serie.Values = at(`D${FIRST}:D${TOTAL - 1}`);
  serie.Name = 'Revenue';
  chart.ChartTitleArea.Text = 'Revenue by product';
  chart.HasLegend = false;
  chart.PrimaryValueAxis.NumberFormat = '$#,##0';

  // ── Sheet chrome ──
  sheet.FreezePanes(FIRST, 1);
  sheet.GridLinesVisible = false;
  sheet.TabColor = xls.Color.get_DarkBlue();

  // ── Second worksheet: cross-sheet roll-up ──
  const summary = wb.Worksheets.Add('Summary');
  summary.Columns.get(0).ColumnWidth = 26;
  summary.Columns.get(1).ColumnWidth = 18;
  summary.Rows.get(0).RowHeight = 30;
  summary.Rows.get(1).RowHeight = 18;
  summary.Rows.get(3).RowHeight = 22;

  const band = (a, text, size) => {
    summary.Range.get(a).Merge();
    summary.Range.get(a.split(':')[0]).Text = text;
    summary.Range.get(a).Style.Color = xls.Color.get_DarkBlue();
    summary.Range.get(a).Style.Font.Color = xls.Color.get_White();
    summary.Range.get(a).Style.Font.IsBold = true;
    summary.Range.get(a).Style.Font.Size = size;
    summary.Range.get(a).Style.VerticalAlignment = xls.VerticalAlignType.Center;
  };
  band('A1:B1', 'Executive Summary', 14);
  band('A2:B2', 'Sales Report · Q3 2026', 9.5);

  ['Metric', 'Value'].forEach((label, i) => {
    summary.Range.get({ row: 4, column: i + 1 }).Text = label;
  });
  summary.Range.get('A4:B4').Style.Color = xls.Color.get_LightSteelBlue();
  summary.Range.get('A4:B4').Style.Font.Color = xls.Color.get_DarkBlue();
  summary.Range.get('A4:B4').Style.Font.IsBold = true;

  [
    ['Total revenue', "='Sales Report'!D" + TOTAL, '$#,##0.00'],
    ['Units shipped', "='Sales Report'!B" + TOTAL, '#,##0'],
    ['Average unit price', `='Sales Report'!D${TOTAL}/'Sales Report'!B${TOTAL}`, '$#,##0.00'],
  ].forEach(([label, formula, format], i) => {
    summary.Range.get({ row: 5 + i, column: 1 }).Text = label;
    const value = summary.Range.get({ row: 5 + i, column: 2 });
    value.Formula = formula;
    value.NumberFormat = format;
    value.Style.HorizontalAlignment = xls.HorizontalAlignType.Right;
    if (i % 2) summary.Range.get(`A${5 + i}:B${5 + i}`).Style.Color = xls.Color.get_WhiteSmoke();
  });

  // Date — use Date.UTC to avoid timezone shift
  summary.Range.get('A8').Text = 'Report date';
  const reportDate = summary.Range.get('B8');
  reportDate.DateTimeValue = new Date(Date.UTC(2026, 8, 28));
  reportDate.NumberFormat = 'yyyy-mm-dd';
  reportDate.Style.HorizontalAlignment = xls.HorizontalAlignType.Right;

  const kpis = summary.Range.get('A4:B8');
  kpis.Borders.LineStyle = xls.LineStyleType.Thin;
  kpis.Borders.Color = xls.Color.get_LightSteelBlue();
  summary.GridLinesVisible = false;
  summary.TabColor = xls.Color.get_LightSteelBlue();

  // ── Save, then release ──
  wb.CalculateAllValue();
  const fileName = 'SalesReport.xlsx';
  wb.SaveToFile({ fileName: fileName, version: xls.ExcelVersion.Version2016 });

  const fileData = window.dotnetRuntime.Module.FS.readFile(fileName);
  const blob = new Blob([fileData], {
    type: 'application/vnd.openxmlformats-officedocument.spreadsheetml.sheet',
  });
  const url = URL.createObjectURL(blob);
  Object.assign(document.createElement('a'), { href: url, download: fileName }).click();
  URL.revokeObjectURL(url);

  wb.Dispose(); // free the WASM heap — one workbook per generation cycle
}
La mise en page suit les données. Remplacez le tableau products par une réponse de votre propre API et tout le reste — totaux, pourcentages de part, plage du graphique, consolidation du récapitulatif — continue de fonctionner, car tout est exprimé sous forme de formules ou de plages dérivées plutôt que de valeurs codées en dur.
Pour plus de types de graphiques et d'options de configuration, consultez Créer des graphiques Excel avec JavaScript dans React.
Créer un fichier Excel à partir de données CSV
Vous pouvez charger des données tabulaires à partir d'un fichier CSV dans une feuille de calcul et enregistrer le résultat au format XLSX. Le classeur obtenu peut ensuite être mis en forme ou enrichi avec des formules et des feuilles de calcul supplémentaires :
// The library reads from its own virtual file system, so the CSV has to be
// there before you can load it — written from a string here, from the bytes of
// a File object in a real application.
const csv = "Product,Quantity,Price\nLaptop,10,999.99\nMouse,50,24.99\nKeyboard,30,59.99";
window.dotnetRuntime.Module.FS.writeFile("data.csv", new TextEncoder().encode(csv));

workbook.LoadFromFile("data.csv", ",");
workbook.SaveToFile({
    fileName: "ConvertedFromCSV.xlsx",
    version: xls.ExcelVersion.Version2016
});
La feuille importée porte le nom du fichier (data), donc Worksheets.get(0) la récupère.
Le séparateur est un deuxième argument obligatoire. LoadFromFile("data.csv") seul est rejeté avec This is not a structured storage file, car la surcharge à un seul argument attend un format structuré tel que .xlsx ou .xls et ne détecte pas le CSV.
Il y a un second piège : l'importateur CSV écrit chaque champ sous forme de texte. Une colonne de quantités arrive sous la forme "10" plutôt que 10, ce qui signifie qu'elle ne peut pas être additionnée ni triée numériquement — exactement le problème décrit plus haut dans ce tutoriel. Convertissez les colonnes dont vous avez besoin avant d'enregistrer :
const csvSheet = workbook.Worksheets.get(0);

// The importer leaves every field as text — coerce each numeric column.
// Columns 2 and 3 hold Quantity and Price; both arrive as "10" and "999.99".
for (let row = 2; row <= 4; row++) {
    [2, 3].forEach((column) => {
        const cell = csvSheet.Range.get({ row: row, column: column });
        if (cell.Text !== "") {
            cell.NumberValue = Number(cell.Text);
        }
    });
}
Pour un guide complet sur la conversion entre les formats CSV et Excel, consultez notre tutoriel de conversion CSV vers Excel.
Créer un fichier XLS au lieu de XLSX
Si votre application doit générer l'ancien format .xls au lieu de .xlsx, modifiez le paramètre de version :
workbook.SaveToFile({
    fileName: "Report.xls",
    version: xls.ExcelVersion.Version97to2003
});
Le membre d'énumération est Version97to2003 — il n'existe pas de Version97. Gardez les graphiques au format XLSX ; l'écrivain XLS testé échoue lorsque les métriques de police des graphiques sont requises.
XLSX (Excel 2007 et versions ultérieures) est le format recommandé pour les nouvelles applications. XLS (Excel 97–2003) n'est nécessaire que lorsqu'une compatibilité ascendante est requise.
Problèmes courants
window.wasmModule est undefined. Les anciens exemples lisaient l'API de feuille de calcul depuis window.wasmModule.spirexls. Les versions actuelles l'installent directement sur window.spirexls et laissent wasmModule undefined, de sorte que le tout premier accès lève une erreur. Vérifiez plutôt window.spirexls.
Module WASM non initialisé. Si window.spirexls est undefined, le runtime n'a pas terminé son chargement. Affichez un indicateur de chargement et attendez la fin de l'initialisation avant de tenter toute opération Excel.
L'ajustement automatique lève une erreur de police. AutoFitColumn et AutoFitRow ont besoin d'une police système pour mesurer le texte, et le bac à sable WebAssembly n'en a aucune. Ils échouent avec Cannot found font(Arial) installed on the system. Calculez ou codez en dur vos largeurs de colonne avec sheet.Columns.get(i).ColumnWidth.
Nombres stockés sous forme de texte. Utiliser cell.Text = "100" au lieu de cell.NumberValue = 100 casse le tri et les calculs. C'est le problème le plus courant rencontré par les développeurs lorsqu'ils écrivent des fichiers Excel en JavaScript, et l'import CSV le déclenche automatiquement — utilisez toujours NumberValue pour les données numériques.
Une feuille « Evaluation Warning » apparaît. Lorsque vous utilisez la version d'évaluation sans licence valide, Spire.XLS ajoute une feuille d'évaluation au classeur enregistré. Cette feuille est recréée à chaque enregistrement, donc la supprimer par programmation n'est pas une solution fiable. Appliquez une clé de licence pour l'éviter.
Fuites de mémoire dans les applications de longue durée. Appelez workbook.Dispose() après chaque cycle de génération. Dans les applications monopage, les classeurs non libérés accumulent de la mémoire et dégradent les performances au fil du temps.
FAQ
JavaScript peut-il créer des fichiers Excel sans Microsoft Excel ?
Oui. Spire.XLS pour JavaScript s'exécute entièrement dans le navigateur via WebAssembly. Aucune installation de Microsoft Excel ou d'Office côté serveur n'est nécessaire pour générer des fichiers XLSX.
JavaScript peut-il créer des fichiers XLSX directement dans le navigateur ?
Oui. Toutes les opérations sur la feuille de calcul se déroulent côté client. Le fichier est enregistré dans un système de fichiers virtuel, puis téléchargé en tant que Blob — aucun serveur backend n'est nécessaire.
Quelle est la différence entre XLS et XLSX ?
XLSX (Excel 2007 et versions ultérieures) est le format moderne basé sur XML, recommandé pour les nouvelles applications. XLS (Excel 97–2003) est l'ancien format binaire, utile pour la compatibilité avec les systèmes plus anciens.
Conclusion
Créer des fichiers Excel en JavaScript ne nécessite ni serveur backend ni Microsoft Excel. Avec Spire.XLS pour JavaScript, vous pouvez construire des classeurs à partir de zéro, écrire des données typées, ajouter des formules, appliquer une mise en forme et organiser les données sur plusieurs feuilles — le tout dans le navigateur.
Commencez par l'exemple de base ci-dessus, puis ajoutez des formules et de la mise en forme selon vos besoins. Pour une intégration spécifique à React et l'export de tableaux HTML, consultez notre tutoriel dédié à l'export.
Voir aussi
Cómo crear archivos Excel en JavaScript (XLSX/XLS)
Tabla de contenido
JavaScript puede generar libros de Excel directamente en el navegador. Con Spire.XLS for JavaScript, puede crear un libro, agregar hojas de cálculo, escribir valores y fórmulas, aplicar formato y guardar el resultado como un archivo XLSX o XLS, todo del lado del cliente, sin necesidad de instalar Microsoft Excel.
Este tutorial comienza con un libro XLSX básico y luego agrega valores de celda con tipo, fórmulas, formato, varias hojas de cálculo, compatibilidad de descarga en el navegador, conversión de CSV y salida XLS para compatibilidad heredada.
Instalar e inicializar Spire.XLS for JavaScript
Spire.XLS for JavaScript se distribuye dentro del paquete spire.office, junto con Spire.PDF, Spire.Doc y Spire.Presentation:
npm i spire.office
Iniciar el tiempo de ejecución requiere dos importaciones. La primera inicia el host compartido de .NET WebAssembly; la segunda registra la API de hojas de cálculo:
// 1. Boot the shared runtime once per page.
const common = await import('/node_modules/spire.office/spire.common.js');
await common.initializeWasm();

// 2. Load the spreadsheet engine — this is what creates window.spirexls.
await import('/node_modules/spire.office/spire.xls.js');
Los archivos Spire.*.Wasm.zip y la carpeta _framework deben ser accesibles desde la raíz del sitio. El tiempo de ejecución los resuelve contra la URL del documento en lugar de contra el módulo que realizó la importación, por lo que en un proyecto de Vite o Create React App deben ubicarse en public/. El prefijo process.env.PUBLIC_URL que se muestra en configuraciones basadas en React es una convención de Create React App, no un estándar del navegador; ajuste la ruta base para que coincida con su herramienta de compilación si no está usando CRA. Si faltan los archivos, el navegador registra WebAssembly.compile(): expected magic word; el servidor de desarrollo ha respondido a la solicitud del archivo con index.html.
Luego, todo depende de una única variable global:
const xls = window.spirexls;
En la configuración actual del paquete utilizada por este tutorial, la API de hojas de cálculo se expone a través de window.spirexls. Use esa variable global después de que se haya inicializado el tiempo de ejecución. Las versiones anteriores la exponían como window.wasmModule.spirexls; si está trabajando con una versión diferente del paquete, verifique qué variable global está disponible.
Ya está listo para generar archivos de Excel.
Crear un archivo de Excel básico en JavaScript
Vamos a crear un informe de ventas. Crearemos un libro, agregaremos una hoja de cálculo, escribiremos datos de productos en las celdas y guardaremos el resultado como un archivo XLSX que se descarga automáticamente.
async function createExcelFile() {
    const xls = window.spirexls;
    if (!xls) {
        console.error('Spire.XLS is not initialized.');
        return;
    }

    // A fresh Workbook() already contains three blank worksheets, so clear them
    // and add the single sheet this report needs.
    const workbook = new xls.Workbook();
    workbook.Worksheets.Clear();
    const sheet = workbook.Worksheets.Add("Sales Report");

    // Sample data: product sales
    const data = [
        ["Product", "Quantity", "Price"],
        ["Laptop", 10, 999.99],
        ["Mouse", 50, 24.99],
        ["Keyboard", 30, 59.99],
        ["Monitor", 15, 329.99]
    ];

    // Write data to cells
    for (let row = 0; row < data.length; row++) {
        for (let col = 0; col < data[row].length; col++) {
            const cell = sheet.Range.get({ row: row + 1, column: col + 1 });
            if (typeof data[row][col] === "string") {
                cell.Text = data[row][col];
            } else {
                cell.NumberValue = data[row][col];
            }
        }
    }

    // Save to the virtual file system, read the bytes, download, then dispose
    const fileName = "SalesReport.xlsx";
    workbook.SaveToFile({
        fileName: fileName,
        version: xls.ExcelVersion.Version2016
    });

    const fileData = window.dotnetRuntime.Module.FS.readFile(fileName);
    const blob = new Blob([fileData], {
        type: "application/vnd.openxmlformats-officedocument.spreadsheetml.sheet"
    });
    const url = URL.createObjectURL(blob);
    const a = document.createElement("a");
    a.href = url;
    a.download = fileName;
    a.click();
    URL.revokeObjectURL(url);

    workbook.Dispose();
}
Llame a createExcelFile() y obtendrá un SalesReport.xlsx con cuatro filas de productos más un encabezado. El flujo de trabajo es simple: crear libro → escribir datos → guardar → descargar.
Las siguientes secciones amplían este ejemplo. Cada fragmento de código supone que se agrega dentro de createExcelFile() después de que se hayan creado el libro y la hoja de cálculo.
Escribir diferentes tipos de datos en celdas de Excel
Excel distingue entre texto, números, fechas y valores booleanos. Equivocarse con esto genera archivos en los que la ordenación se rompe, las fórmulas devuelven errores y los números se muestran como texto.
const sheet = workbook.Worksheets.get(0);

// Text — for labels, names, descriptions
sheet.Range.get("A1").Text = "Product Name";

// Number — for anything you'll calculate, sort, or filter
sheet.Range.get("B1").NumberValue = 999.99;

// Date — a real DateTimeValue plus a display format
const dateCell = sheet.Range.get("C1");
dateCell.DateTimeValue = new Date(Date.UTC(2025, 2, 15));
dateCell.NumberFormat = "yyyy-mm-dd";

// Boolean — use BooleanValue, not text
sheet.Range.get("D1").BooleanValue = true;
¿El error más común? Escribir cell.Text = "999.99" en lugar de cell.NumberValue = 999.99. El valor se ve idéntico al abrir el archivo, pero Excel lo trata como texto: no puede sumarlo, promediarlo ni ordenarlo numéricamente. Use siempre NumberValue para números, DateTimeValue para fechas y BooleanValue para booleanos.
Las fechas necesitan una precaución adicional. DateTimeValue conserva el instante UTC representado por el Date de JavaScript. Por lo tanto, crear una fecha con la medianoche local puede desplazar el día mostrado en algunas zonas horarias; use Date.UTC() cuando desee que se conserve una fecha de calendario específica.
Agregar fórmulas a la hoja de cálculo de Excel
Las fórmulas convierten su archivo generado en una hoja de cálculo real, no solo en un volcado de datos. Agreguemos una columna Total que calcule Quantity × Price para cada fila, más un total general en la parte inferior:
// Add "Total" header
sheet.Range.get({ row: 1, column: 4 }).Text = "Total";

// Per-row formula: Total = Quantity × Price
for (let i = 2; i <= 5; i++) {
    sheet.Range.get({ row: i, column: 4 }).Formula = `=B${i}*C${i}`;
}

// Grand total row
sheet.Range.get({ row: 6, column: 1 }).Text = "Total";
sheet.Range.get({ row: 6, column: 2 }).Formula = "=SUM(B2:B5)";
sheet.Range.get({ row: 6, column: 4 }).Formula = "=SUM(D2:D5)";

// Evaluate the formulas once, so their results are written into the file.
workbook.CalculateAllValue();
Llame a workbook.CalculateAllValue() antes de guardar cuando necesite que el libro generado contenga resultados de fórmulas calculados. Esto es útil para visores o aplicaciones que dependen de valores en caché en lugar de recalcular las fórmulas al abrir.
Para obtener una guía completa sobre funciones de Excel y operaciones con fórmulas, consulte Insertar o leer funciones y fórmulas en hojas de cálculo de Excel con JavaScript en React.
Formatear el archivo de Excel generado
Una hoja de cálculo con datos sin procesar funciona, pero una hoja de cálculo con formato comunica. Convirtamos nuestro informe de ventas en algo que realmente enviaría a una parte interesada:
// Bold, colored header row
const header = sheet.Range.get("A1:D1");
header.Style.Font.IsBold = true;
header.Style.Font.Size = 12;
header.Style.Color = xls.Color.get_LightSkyBlue();

// Currency format for Price and Total columns
for (let i = 2; i <= 5; i++) {
    sheet.Range.get({ row: i, column: 3 }).NumberFormat = "$#,##0.00";
    sheet.Range.get({ row: i, column: 4 }).NumberFormat = "$#,##0.00";
}

// Set column widths explicitly
[26, 10, 12, 12].forEach((width, i) => {
    sheet.Columns.get(i).ColumnWidth = width;
});

// Clean borders
const usedRange = sheet.Range.get("A1:D6");
usedRange.Borders.LineStyle = xls.LineStyleType.Thin;
usedRange.Borders.Color = xls.Color.get_LightSteelBlue();
Vale la pena conocer dos detalles aquí. sheet.Columns.get(i) y sheet.Rows.get(i) están basados en 0 y usan get, a diferencia del get_Item que exponen otras colecciones. Y en la configuración del navegador probada, AutoFitColumn requiere una fuente que no está disponible en el entorno aislado de WebAssembly, por lo que establecer ColumnWidth explícitamente es más confiable.
El resultado: un encabezado azul en negrita, precios con formato de moneda, columnas con el tamaño adecuado y bordes limpios.
Para obtener una guía detallada sobre las dimensiones de filas y columnas, consulte Establecer la altura de fila y el ancho de columna en Excel con JavaScript en React.
Crear varias hojas de cálculo en un libro de Excel
Los informes reales rara vez caben en una sola hoja. Un informe de ventas podría tener un resumen en la primera pestaña, detalles de productos en la segunda y desgloses mensuales en la tercera.
workbook.Worksheets.Clear();
const summarySheet = workbook.Worksheets.Add("Summary");
const productsSheet = workbook.Worksheets.Add("Products");
const monthlySheet = workbook.Worksheets.Add("Monthly Data");

// Products sheet — write actual data so cross-sheet formulas work
productsSheet.Range.get("A1").Text = "Product";
productsSheet.Range.get("B1").Text = "Quantity";
productsSheet.Range.get("C1").Text = "Price";
productsSheet.Range.get("D1").Text = "Total";

const products = [
    ["Laptop", 10, 999.99],
    ["Mouse", 50, 24.99],
    ["Keyboard", 30, 59.99],
    ["Monitor", 15, 329.99]
];

for (let i = 0; i < products.length; i++) {
    const row = i + 2;
    productsSheet.Range.get({ row: row, column: 1 }).Text = products[i][0];
    productsSheet.Range.get({ row: row, column: 2 }).NumberValue = products[i][1];
    productsSheet.Range.get({ row: row, column: 3 }).NumberValue = products[i][2];
    productsSheet.Range.get({ row: row, column: 4 }).Formula = `=B${row}*C${row}`;
}

// Summary sheet with cross-sheet reference
summarySheet.Range.get("A1").Text = "Sales Summary";
summarySheet.Range.get("A1").Style.Font.IsBold = true;
summarySheet.Range.get("A2").Text = "Total Products";
summarySheet.Range.get("B2").NumberValue = 4;
summarySheet.Range.get("A3").Text = "Total Revenue";
summarySheet.Range.get("B3").Formula = "=SUM(Products!D2:D5)";
Cada Worksheets.Add(name) devuelve la hoja que acaba de crear, en el orden en que se realizan las llamadas, por lo que el orden de las pestañas coincide con el orden del código. Observe la fórmula entre hojas: =SUM(Products!D2:D5) en la hoja Summary hace referencia a la columna Total de la hoja Products. Excel lo maneja automáticamente cuando se abre el archivo; no se necesita código adicional.
Para obtener más información sobre la administración de hojas de cálculo (agregar, eliminar y reordenar hojas), consulte Agregar, eliminar y mover hojas de cálculo de Excel con JavaScript en React.
Guardar y descargar el archivo XLSX en el navegador
Una vez que su libro esté listo, Spire.XLS lo guarda en un sistema de archivos virtual de WebAssembly. Luego lee los datos del archivo, los convierte en un Blob y activa una descarga:
workbook.SaveToFile({
    fileName: "Report.xlsx",
    version: xls.ExcelVersion.Version2016
});

const fileData = window.dotnetRuntime.Module.FS.readFile("Report.xlsx");
const blob = new Blob([fileData], {
    type: "application/vnd.openxmlformats-officedocument.spreadsheetml.sheet"
});
const url = URL.createObjectURL(blob);
const a = document.createElement("a");
a.href = url;
a.download = "Report.xlsx";
a.click();
URL.revokeObjectURL(url);

workbook.Dispose();
Llame siempre a workbook.Dispose() después de la descarga para liberar memoria, especialmente en aplicaciones donde los usuarios generan varios archivos en una sesión. El libro en sí reside en el montón de WebAssembly hasta que lo haga, y el recolector de basura del navegador no reclama ese montón.
¿Busca integración con React o exportación de tablas HTML? Consulte nuestra guía para descargar y exportar archivos de Excel en JavaScript y React.
Integrarlo todo: un informe de ventas con formato
Los fragmentos anteriores construyen un libro una preocupación a la vez. Aquí están en una sola función: una hoja de cálculo con estilo, con bandas de cebra y formatos de moneda, columnas de ingresos y participación impulsadas por fórmulas, un gráfico de columnas y una segunda hoja de cálculo que consolida los números.
/**
 * Build a formatted sales report workbook in the browser and download it as
 * SalesReport.xlsx.
 *
 * The layout is driven by `products` below — swap it for form input, an API
 * response or component state and nothing else needs to change.
 */
async function createExcelReport() {
  // spire.office 11.7.0 exposes Spire.XLS as `window.spirexls`. Older builds
  // hung it off `window.wasmModule.spirexls`; that global no longer exists.
  const xls = window.spirexls;
  if (!xls) throw new Error('Spire.XLS is not ready yet');

  // [product, units sold, unit price] — revenue and share are derived by formula
  const products = [
    ['Atlas 14 Ultrabook', 42, 1249.0],
    ['Orbit Wireless Mouse', 380, 24.99],
    ['Vertex Mechanical Keyboard', 165, 89.5],
    ['Lumen 27 4K Monitor', 74, 429.0],
    ['Halo USB-C Dock', 210, 139.0],
    ['Pulse ANC Headset', 128, 199.0],
  ];
  const FIRST = 5; // first data row
  const TOTAL = FIRST + products.length; // total row

  const wb = new xls.Workbook();
  wb.Worksheets.Clear();
  const sheet = wb.Worksheets.Add('Sales Report');

  const at = (a) => sheet.Range.get(a);
  const cell = (row, col) => sheet.Range.get({ row: row, column: col });
  const paint = (a, colour) => {
    at(a).Style.Color = colour;
  };

  // ── Sizing ── explicit widths (AutoFitColumn is unreliable in the WASM sandbox)
  [34, 9, 13, 14, 9].forEach((w, i) => {
    sheet.Columns.get(i).ColumnWidth = w;
  });
  sheet.Rows.get(0).RowHeight = 34; // title
  sheet.Rows.get(1).RowHeight = 20; // subtitle
  sheet.Rows.get(2).RowHeight = 8; // spacer
  sheet.Rows.get(3).RowHeight = 24; // header

  // ── Title band ── merge first, then style the whole merged area
  at('A1:E1').Merge();
  cell(1, 1).Text = 'Sales Report — Q3 2026';
  paint('A1:E1', xls.Color.get_DarkBlue());
  at('A1:E1').Style.Font.Color = xls.Color.get_White();
  at('A1:E1').Style.Font.IsBold = true;
  at('A1:E1').Style.Font.Size = 15;
  at('A1:E1').Style.VerticalAlignment = xls.VerticalAlignType.Center;

  at('A2:E2').Merge();
  cell(2, 1).Text = 'Region: West · Period: 1 Jul – 30 Sep 2026 · Amounts in USD';
  paint('A2:E2', xls.Color.get_DarkBlue());
  at('A2:E2').Style.Font.Color = xls.Color.get_LightSteelBlue();
  at('A2:E2').Style.Font.Size = 9.5;
  at('A2:E2').Style.VerticalAlignment = xls.VerticalAlignType.Center;

  // ── Header row ───────────────────────────────────────────────────────────
  ['Product', 'Units', 'Unit Price', 'Revenue', 'Share'].forEach((label, i) => {
    cell(4, i + 1).Text = label;
  });
  paint('A4:E4', xls.Color.get_LightSteelBlue());
  at('A4:E4').Style.Font.Color = xls.Color.get_DarkBlue();
  at('A4:E4').Style.Font.IsBold = true;
  at('A4:E4').Style.Font.Size = 10.5;
  at('A4:E4').Style.HorizontalAlignment = xls.HorizontalAlignType.Center;
  at('A4:E4').Style.VerticalAlignment = xls.VerticalAlignType.Center;

  // ── Data rows ── numbers go in as NumberValue, never as text
  products.forEach(([name, units, price], i) => {
    const r = FIRST + i;
    cell(r, 1).Text = name;
    cell(r, 2).NumberValue = units;
    cell(r, 3).NumberValue = price;
    cell(r, 4).Formula = `=B${r}*C${r}`;
    cell(r, 5).Formula = `=D${r}/$D${TOTAL}`; // share of the grand total
    sheet.Rows.get(r - 1).RowHeight = 20;
    if (i % 2) paint(`A${r}:E${r}`, xls.Color.get_WhiteSmoke()); // zebra banding
  });

  // ── Total row ────────────────────────────────────────────────────────────
  cell(TOTAL, 1).Text = 'Total';
  [2, 4, 5].forEach((col) => {
    const letter = String.fromCharCode(64 + col);
    cell(TOTAL, col).Formula = `=SUM(${letter}${FIRST}:${letter}${TOTAL - 1})`;
  });
  paint(`A${TOTAL}:E${TOTAL}`, xls.Color.get_LightSkyBlue());
  at(`A${TOTAL}:E${TOTAL}`).Style.Font.IsBold = true;
  sheet.Rows.get(TOTAL - 1).RowHeight = 22;

  // ── Number formats and borders ───────────────────────────────────────────
  at(`B${FIRST}:B${TOTAL}`).NumberFormat = '#,##0';
  at(`C${FIRST}:D${TOTAL}`).NumberFormat = '$#,##0.00';
  at(`E${FIRST}:E${TOTAL}`).NumberFormat = '0.0%';

  const table = at(`A4:E${TOTAL}`);
  table.Borders.LineStyle = xls.LineStyleType.Thin;
  table.Borders.Color = xls.Color.get_LightSteelBlue();
  at(`A${TOTAL}:E${TOTAL}`).Borders.get_Item(xls.BordersLineType.EdgeTop).LineStyle =
    xls.LineStyleType.Medium;

  // ── Chart ── build the series by hand (DataRange would mix units)
  const chart = sheet.Charts.Add();
  chart.ChartType = xls.ExcelChartType.ColumnClustered;
  chart.LeftColumn = 6;
  chart.TopRow = 3;
  chart.RightColumn = 13;
  chart.BottomRow = 21;
  const serie = chart.Series.Add();
  serie.CategoryLabels = at(`A${FIRST}:A${TOTAL - 1}`);
  serie.Values = at(`D${FIRST}:D${TOTAL - 1}`);
  serie.Name = 'Revenue';
  chart.ChartTitleArea.Text = 'Revenue by product';
  chart.HasLegend = false;
  chart.PrimaryValueAxis.NumberFormat = '$#,##0';

  // ── Sheet chrome ──
  sheet.FreezePanes(FIRST, 1);
  sheet.GridLinesVisible = false;
  sheet.TabColor = xls.Color.get_DarkBlue();

  // ── Second worksheet: cross-sheet roll-up ──
  const summary = wb.Worksheets.Add('Summary');
  summary.Columns.get(0).ColumnWidth = 26;
  summary.Columns.get(1).ColumnWidth = 18;
  summary.Rows.get(0).RowHeight = 30;
  summary.Rows.get(1).RowHeight = 18;
  summary.Rows.get(3).RowHeight = 22;

  const band = (a, text, size) => {
    summary.Range.get(a).Merge();
    summary.Range.get(a.split(':')[0]).Text = text;
    summary.Range.get(a).Style.Color = xls.Color.get_DarkBlue();
    summary.Range.get(a).Style.Font.Color = xls.Color.get_White();
    summary.Range.get(a).Style.Font.IsBold = true;
    summary.Range.get(a).Style.Font.Size = size;
    summary.Range.get(a).Style.VerticalAlignment = xls.VerticalAlignType.Center;
  };
  band('A1:B1', 'Executive Summary', 14);
  band('A2:B2', 'Sales Report · Q3 2026', 9.5);

  ['Metric', 'Value'].forEach((label, i) => {
    summary.Range.get({ row: 4, column: i + 1 }).Text = label;
  });
  summary.Range.get('A4:B4').Style.Color = xls.Color.get_LightSteelBlue();
  summary.Range.get('A4:B4').Style.Font.Color = xls.Color.get_DarkBlue();
  summary.Range.get('A4:B4').Style.Font.IsBold = true;

  [
    ['Total revenue', "='Sales Report'!D" + TOTAL, '$#,##0.00'],
    ['Units shipped', "='Sales Report'!B" + TOTAL, '#,##0'],
    ['Average unit price', `='Sales Report'!D${TOTAL}/'Sales Report'!B${TOTAL}`, '$#,##0.00'],
  ].forEach(([label, formula, format], i) => {
    summary.Range.get({ row: 5 + i, column: 1 }).Text = label;
    const value = summary.Range.get({ row: 5 + i, column: 2 });
    value.Formula = formula;
    value.NumberFormat = format;
    value.Style.HorizontalAlignment = xls.HorizontalAlignType.Right;
    if (i % 2) summary.Range.get(`A${5 + i}:B${5 + i}`).Style.Color = xls.Color.get_WhiteSmoke();
  });

  // Date — use Date.UTC to avoid timezone shift
  summary.Range.get('A8').Text = 'Report date';
  const reportDate = summary.Range.get('B8');
  reportDate.DateTimeValue = new Date(Date.UTC(2026, 8, 28));
  reportDate.NumberFormat = 'yyyy-mm-dd';
  reportDate.Style.HorizontalAlignment = xls.HorizontalAlignType.Right;

  const kpis = summary.Range.get('A4:B8');
  kpis.Borders.LineStyle = xls.LineStyleType.Thin;
  kpis.Borders.Color = xls.Color.get_LightSteelBlue();
  summary.GridLinesVisible = false;
  summary.TabColor = xls.Color.get_LightSteelBlue();

  // ── Save, then release ──
  wb.CalculateAllValue();
  const fileName = 'SalesReport.xlsx';
  wb.SaveToFile({ fileName: fileName, version: xls.ExcelVersion.Version2016 });

  const fileData = window.dotnetRuntime.Module.FS.readFile(fileName);
  const blob = new Blob([fileData], {
    type: 'application/vnd.openxmlformats-officedocument.spreadsheetml.sheet',
  });
  const url = URL.createObjectURL(blob);
  Object.assign(document.createElement('a'), { href: url, download: fileName }).click();
  URL.revokeObjectURL(url);

  wb.Dispose(); // free the WASM heap — one workbook per generation cycle
}
El diseño sigue los datos. Reemplace el array products con una respuesta de su propia API y todo lo demás (totales, porcentajes de participación, el rango del gráfico, la consolidación del resumen) seguirá funcionando, porque todo está expresado como fórmulas o rangos derivados en lugar de valores codificados de forma fija.
Para obtener más tipos de gráficos y opciones de configuración, consulte Crear gráficos de Excel con JavaScript en React.
Crear un archivo de Excel a partir de datos CSV
Puede cargar datos tabulares desde un archivo CSV en una hoja de cálculo y guardar el resultado como XLSX. El libro resultante se puede formatear o ampliar con fórmulas y hojas de cálculo adicionales:
// The library reads from its own virtual file system, so the CSV has to be
// there before you can load it — written from a string here, from the bytes of
// a File object in a real application.
const csv = "Product,Quantity,Price\nLaptop,10,999.99\nMouse,50,24.99\nKeyboard,30,59.99";
window.dotnetRuntime.Module.FS.writeFile("data.csv", new TextEncoder().encode(csv));

workbook.LoadFromFile("data.csv", ",");
workbook.SaveToFile({
    fileName: "ConvertedFromCSV.xlsx",
    version: xls.ExcelVersion.Version2016
});
La hoja importada recibe el nombre del archivo (data), por lo que Worksheets.get(0) la toma.
El separador es un segundo argumento obligatorio. LoadFromFile("data.csv") por sí solo se rechaza con This is not a structured storage file, porque la sobrecarga de un solo argumento espera un formato estructurado como .xlsx o .xls y no detecta CSV.
Hay un segundo problema: el importador de CSV escribe todos los campos como texto. Una columna de cantidad llega como "10" en lugar de 10, lo que significa que no se puede sumar ni ordenar numéricamente, el problema exacto descrito anteriormente en este tutorial. Convierta las columnas que necesite antes de guardar:
const csvSheet = workbook.Worksheets.get(0);

// The importer leaves every field as text — coerce each numeric column.
// Columns 2 and 3 hold Quantity and Price; both arrive as "10" and "999.99".
for (let row = 2; row <= 4; row++) {
    [2, 3].forEach((column) => {
        const cell = csvSheet.Range.get({ row: row, column: column });
        if (cell.Text !== "") {
            cell.NumberValue = Number(cell.Text);
        }
    });
}
Para obtener una guía completa sobre la conversión entre formatos CSV y Excel, consulte nuestro tutorial de conversión de CSV a Excel.
Crear un archivo XLS en lugar de XLSX
Si su aplicación necesita generar el formato .xls heredado en lugar de .xlsx, cambie el parámetro de versión:
workbook.SaveToFile({
    fileName: "Report.xls",
    version: xls.ExcelVersion.Version97to2003
});
El miembro de enumeración es Version97to2003; no existe Version97. Mantenga los gráficos en XLSX; el escritor XLS probado falla cuando se requieren métricas de fuente de gráficos.
XLSX (Excel 2007+) es el formato recomendado para aplicaciones nuevas. XLS (Excel 97–2003) solo es necesario cuando se requiere compatibilidad con versiones anteriores.
Problemas comunes
window.wasmModule no está definido. Los ejemplos más antiguos leían la API de hojas de cálculo desde window.wasmModule.spirexls. Las versiones actuales la instalan directamente en window.spirexls y dejan wasmModule sin definir, por lo que el primer acceso genera un error. En su lugar, verifique window.spirexls.
Módulo WASM no inicializado. Si window.spirexls no está definido, el tiempo de ejecución no ha terminado de cargarse. Muestre un indicador de carga y espere a que se complete la inicialización antes de intentar cualquier operación de Excel.
El ajuste automático genera un error de fuente. AutoFitColumn y AutoFitRow necesitan una fuente del sistema para medir el texto, y el entorno aislado de WebAssembly no tiene ninguna. Fallan con Cannot found font(Arial) installed on the system. Calcule o codifique de forma fija los anchos de sus columnas con sheet.Columns.get(i).ColumnWidth.
Números almacenados como texto. Usar cell.Text = "100" en lugar de cell.NumberValue = 100 rompe la ordenación y los cálculos. Este es el problema más común que encuentran los desarrolladores al escribir archivos de Excel en JavaScript, y la importación de CSV lo provoca automáticamente; use siempre NumberValue para datos numéricos.
Aparece una hoja de "Advertencia de evaluación". Cuando se usa la compilación de evaluación sin una licencia válida, Spire.XLS agrega una hoja de evaluación al libro guardado. Esta hoja se vuelve a crear al guardar, por lo que eliminarla mediante programación no es una solución confiable. Aplique una clave de licencia para evitarlo.
Fugas de memoria en aplicaciones de larga duración. Llame a workbook.Dispose() después de cada ciclo de generación. En aplicaciones de una sola página, los libros no eliminados acumulan memoria y degradan el rendimiento con el tiempo.
Preguntas frecuentes
¿Puede JavaScript crear archivos de Excel sin Microsoft Excel?
Sí. Spire.XLS for JavaScript se ejecuta completamente en el navegador mediante WebAssembly. No se requiere Microsoft Excel ni una instalación de Office del lado del servidor para generar archivos XLSX.
¿Puede JavaScript crear archivos XLSX directamente en el navegador?
Sí. Todas las operaciones de hojas de cálculo ocurren del lado del cliente. El archivo se guarda en un sistema de archivos virtual y luego se descarga como un Blob; no se necesita un servidor backend.
¿Cuál es la diferencia entre XLS y XLSX?
XLSX (Excel 2007 y posteriores) es el formato moderno basado en XML, recomendado para aplicaciones nuevas. XLS (Excel 97–2003) es el formato binario heredado, útil para la compatibilidad con sistemas más antiguos.
Conclusión
Crear archivos de Excel en JavaScript no requiere un servidor backend ni Microsoft Excel. Con Spire.XLS for JavaScript, puede crear libros desde cero, escribir datos con tipo, agregar fórmulas, aplicar formato y organizar datos en varias hojas, todo en el navegador.
Comience con el ejemplo básico anterior y luego agregue fórmulas y formato a medida que crezcan sus necesidades. Para obtener integración específica de React y exportación de tablas HTML, consulte nuestro tutorial dedicado a la exportación.
Ver también
Wie man Excel-Dateien in JavaScript erstellt (XLSX/XLS)
Inhaltsverzeichnis
JavaScript kann Excel-Arbeitsmappen direkt im Browser generieren. Mit Spire.XLS für JavaScript können Sie eine Arbeitsmappe erstellen, Arbeitsblätter hinzufügen, Werte und Formeln schreiben, Formatierungen anwenden und das Ergebnis entweder als XLSX- oder XLS-Datei speichern – alles clientseitig, ohne dass Microsoft Excel installiert sein muss.
Dieses Tutorial beginnt mit einer einfachen XLSX-Arbeitsmappe und fügt dann typisierte Zellwerte, Formeln, Formatierungen, mehrere Arbeitsblätter, Browser-Download-Unterstützung, CSV-Konvertierung und XLS-Ausgabe für Legacy-Kompatibilität hinzu.
Spire.XLS für JavaScript installieren und initialisieren
Spire.XLS für JavaScript ist im Paket spire.office enthalten, zusammen mit Spire.PDF, Spire.Doc und Spire.Presentation:
npm i spire.office
Das Starten der Runtime erfordert zwei Imports. Der erste startet den gemeinsamen .NET-WebAssembly-Host; der zweite registriert die Tabellenkalkulations-API:
// 1. Boot the shared runtime once per page.
const common = await import('/node_modules/spire.office/spire.common.js');
await common.initializeWasm();

// 2. Load the spreadsheet engine — this is what creates window.spirexls.
await import('/node_modules/spire.office/spire.xls.js');
Die Archive Spire.*.Wasm.zip und der Ordner _framework müssen vom Stammverzeichnis der Website aus erreichbar sein. Die Runtime löst sie anhand der Dokument-URL auf und nicht anhand des Moduls, das den Import durchgeführt hat. In einem Vite- oder Create-React-App-Projekt müssen sie daher in public/ liegen. Das in React-basierten Setups gezeigte Präfix process.env.PUBLIC_URL ist eine Create-React-App-Konvention, kein Browserstandard – passen Sie den Basispfad an Ihr Build-Tool an, wenn Sie nicht CRA verwenden. Wenn die Archive fehlen, protokolliert der Browser WebAssembly.compile(): expected magic word – der Dev-Server hat die Archiv-Anfrage mit index.html beantwortet.
Alles hängt dann von einem einzigen globalen Objekt ab:
const xls = window.spirexls;
Im aktuellen Paket-Setup, das in diesem Tutorial verwendet wird, wird die Tabellenkalkulations-API über window.spirexls bereitgestellt. Verwenden Sie dieses globale Objekt, nachdem die Runtime initialisiert wurde. Ältere Releases haben sie als window.wasmModule.spirexls bereitgestellt; wenn Sie mit einer anderen Paketversion arbeiten, prüfen Sie, welches globale Objekt verfügbar ist.
Sie sind jetzt bereit, Excel-Dateien zu generieren.
Eine einfache Excel-Datei in JavaScript erstellen
Erstellen wir einen Verkaufsbericht. Wir erstellen eine Arbeitsmappe, fügen ein Arbeitsblatt hinzu, schreiben Produktdaten in Zellen und speichern das Ergebnis als XLSX-Datei, die automatisch heruntergeladen wird.
async function createExcelFile() {
    const xls = window.spirexls;
    if (!xls) {
        console.error('Spire.XLS is not initialized.');
        return;
    }

    // A fresh Workbook() already contains three blank worksheets, so clear them
    // and add the single sheet this report needs.
    const workbook = new xls.Workbook();
    workbook.Worksheets.Clear();
    const sheet = workbook.Worksheets.Add("Sales Report");

    // Sample data: product sales
    const data = [
        ["Product", "Quantity", "Price"],
        ["Laptop", 10, 999.99],
        ["Mouse", 50, 24.99],
        ["Keyboard", 30, 59.99],
        ["Monitor", 15, 329.99]
    ];

    // Write data to cells
    for (let row = 0; row < data.length; row++) {
        for (let col = 0; col < data[row].length; col++) {
            const cell = sheet.Range.get({ row: row + 1, column: col + 1 });
            if (typeof data[row][col] === "string") {
                cell.Text = data[row][col];
            } else {
                cell.NumberValue = data[row][col];
            }
        }
    }

    // Save to the virtual file system, read the bytes, download, then dispose
    const fileName = "SalesReport.xlsx";
    workbook.SaveToFile({
        fileName: fileName,
        version: xls.ExcelVersion.Version2016
    });

    const fileData = window.dotnetRuntime.Module.FS.readFile(fileName);
    const blob = new Blob([fileData], {
        type: "application/vnd.openxmlformats-officedocument.spreadsheetml.sheet"
    });
    const url = URL.createObjectURL(blob);
    const a = document.createElement("a");
    a.href = url;
    a.download = fileName;
    a.click();
    URL.revokeObjectURL(url);

    workbook.Dispose();
}
Rufen Sie createExcelFile() auf, und Sie erhalten eine SalesReport.xlsx mit vier Produktzeilen plus einer Kopfzeile. Der Workflow ist einfach: Arbeitsmappe erstellen → Daten schreiben → speichern → herunterladen.
Die folgenden Abschnitte erweitern dieses Beispiel. Jedes Code-Snippet geht davon aus, dass es innerhalb von createExcelFile() hinzugefügt wird, nachdem die Arbeitsmappe und das Arbeitsblatt erstellt wurden.
Verschiedene Datentypen in Excel-Zellen schreiben
Excel unterscheidet zwischen Text, Zahlen, Datumsangaben und booleschen Werten. Wenn Sie dies falsch machen, entstehen Dateien, in denen die Sortierung fehlschlägt, Formeln Fehler zurückgeben und Zahlen als Text angezeigt werden.
const sheet = workbook.Worksheets.get(0);

// Text — for labels, names, descriptions
sheet.Range.get("A1").Text = "Product Name";

// Number — for anything you'll calculate, sort, or filter
sheet.Range.get("B1").NumberValue = 999.99;

// Date — a real DateTimeValue plus a display format
const dateCell = sheet.Range.get("C1");
dateCell.DateTimeValue = new Date(Date.UTC(2025, 2, 15));
dateCell.NumberFormat = "yyyy-mm-dd";

// Boolean — use BooleanValue, not text
sheet.Range.get("D1").BooleanValue = true;
Der häufigste Fehler? Sie schreiben cell.Text = "999.99" statt cell.NumberValue = 999.99. Der Wert sieht beim Öffnen der Datei identisch aus, aber Excel behandelt ihn als Text – Sie können ihn nicht summieren, mitteln oder numerisch sortieren. Verwenden Sie immer NumberValue für Zahlen, DateTimeValue für Datumsangaben und BooleanValue für boolesche Werte.
Datumsangaben erfordern eine zusätzliche Vorsichtsmaßnahme. DateTimeValue bewahrt den UTC-Zeitpunkt, der durch das JavaScript-Date dargestellt wird. Das Erstellen eines Datums mit lokaler Mitternacht kann daher in einigen Zeitzonen den angezeigten Tag verschieben; verwenden Sie Date.UTC(), wenn ein bestimmtes Kalenderdatum beibehalten werden soll.
Formeln zum Excel-Arbeitsblatt hinzufügen
Formeln machen Ihre generierte Datei zu einer echten Tabellenkalkulation, nicht nur zu einem Daten-Dump. Fügen wir eine Spalte Total hinzu, die Quantity × Price für jede Zeile berechnet, plus eine Gesamtsumme am Ende:
// Add "Total" header
sheet.Range.get({ row: 1, column: 4 }).Text = "Total";

// Per-row formula: Total = Quantity × Price
for (let i = 2; i <= 5; i++) {
    sheet.Range.get({ row: i, column: 4 }).Formula = `=B${i}*C${i}`;
}

// Grand total row
sheet.Range.get({ row: 6, column: 1 }).Text = "Total";
sheet.Range.get({ row: 6, column: 2 }).Formula = "=SUM(B2:B5)";
sheet.Range.get({ row: 6, column: 4 }).Formula = "=SUM(D2:D5)";

// Evaluate the formulas once, so their results are written into the file.
workbook.CalculateAllValue();
Rufen Sie workbook.CalculateAllValue() vor dem Speichern auf, wenn die generierte Arbeitsmappe berechnete Formelergebnisse enthalten soll. Dies ist nützlich für Viewer oder Anwendungen, die auf zwischengespeicherte Werte angewiesen sind, anstatt Formeln beim Öffnen neu zu berechnen.
Eine umfassende Anleitung zu Excel-Funktionen und Formeloperationen finden Sie unter Funktionen und Formeln in Excel-Arbeitsblättern mit JavaScript in React einfügen oder lesen.
Die generierte Excel-Datei formatieren
Eine Tabellenkalkulation mit Rohdaten funktioniert, aber eine formatierte Tabellenkalkulation kommuniziert. Machen wir aus unserem Verkaufsbericht etwas, das Sie tatsächlich an einen Stakeholder senden würden:
// Bold, colored header row
const header = sheet.Range.get("A1:D1");
header.Style.Font.IsBold = true;
header.Style.Font.Size = 12;
header.Style.Color = xls.Color.get_LightSkyBlue();

// Currency format for Price and Total columns
for (let i = 2; i <= 5; i++) {
    sheet.Range.get({ row: i, column: 3 }).NumberFormat = "$#,##0.00";
    sheet.Range.get({ row: i, column: 4 }).NumberFormat = "$#,##0.00";
}

// Set column widths explicitly
[26, 10, 12, 12].forEach((width, i) => {
    sheet.Columns.get(i).ColumnWidth = width;
});

// Clean borders
const usedRange = sheet.Range.get("A1:D6");
usedRange.Borders.LineStyle = xls.LineStyleType.Thin;
usedRange.Borders.Color = xls.Color.get_LightSteelBlue();
Zwei Details sind hier erwähnenswert. sheet.Columns.get(i) und sheet.Rows.get(i) sind 0-basiert und verwenden get, anders als das get_Item, das andere Sammlungen bereitstellen. Und im getesteten Browser-Setup erfordert AutoFitColumn eine Schriftart, die in der WebAssembly-Sandbox nicht verfügbar ist, daher ist das explizite Festlegen von ColumnWidth zuverlässiger.
Das Ergebnis: eine fett gedruckte blaue Kopfzeile, währungsformatierte Preise, richtig dimensionierte Spalten und saubere Rahmen.
Eine ausführliche Anleitung zu Zeilen- und Spaltenabmessungen finden Sie unter Zeilenhöhe und Spaltenbreite in Excel mit JavaScript in React festlegen.
Mehrere Arbeitsblätter in einer Excel-Arbeitsmappe erstellen
Echte Berichte passen selten auf ein Blatt. Ein Verkaufsbericht könnte eine Zusammenfassung auf der ersten Registerkarte, Produktdetails auf der zweiten und monatliche Aufschlüsselungen auf der dritten haben.
workbook.Worksheets.Clear();
const summarySheet = workbook.Worksheets.Add("Summary");
const productsSheet = workbook.Worksheets.Add("Products");
const monthlySheet = workbook.Worksheets.Add("Monthly Data");

// Products sheet — write actual data so cross-sheet formulas work
productsSheet.Range.get("A1").Text = "Product";
productsSheet.Range.get("B1").Text = "Quantity";
productsSheet.Range.get("C1").Text = "Price";
productsSheet.Range.get("D1").Text = "Total";

const products = [
    ["Laptop", 10, 999.99],
    ["Mouse", 50, 24.99],
    ["Keyboard", 30, 59.99],
    ["Monitor", 15, 329.99]
];

for (let i = 0; i < products.length; i++) {
    const row = i + 2;
    productsSheet.Range.get({ row: row, column: 1 }).Text = products[i][0];
    productsSheet.Range.get({ row: row, column: 2 }).NumberValue = products[i][1];
    productsSheet.Range.get({ row: row, column: 3 }).NumberValue = products[i][2];
    productsSheet.Range.get({ row: row, column: 4 }).Formula = `=B${row}*C${row}`;
}

// Summary sheet with cross-sheet reference
summarySheet.Range.get("A1").Text = "Sales Summary";
summarySheet.Range.get("A1").Style.Font.IsBold = true;
summarySheet.Range.get("A2").Text = "Total Products";
summarySheet.Range.get("B2").NumberValue = 4;
summarySheet.Range.get("A3").Text = "Total Revenue";
summarySheet.Range.get("B3").Formula = "=SUM(Products!D2:D5)";
Jedes Worksheets.Add(name) gibt das gerade erstellte Blatt zurück, in der Reihenfolge der Aufrufe, sodass die Registerkartenreihenfolge mit der Codereihenfolge übereinstimmt. Beachten Sie die blattübergreifende Formel: =SUM(Products!D2:D5) auf dem Blatt „Summary“ verweist auf die Spalte Total auf dem Blatt „Products“. Excel verarbeitet dies automatisch beim Öffnen der Datei – kein zusätzlicher Code erforderlich.
Weitere Informationen zur Arbeitsblattverwaltung – Hinzufügen, Entfernen und Neuanordnen von Blättern – finden Sie unter Excel-Arbeitsblätter mit JavaScript in React hinzufügen, entfernen und verschieben.
Die XLSX-Datei im Browser speichern und herunterladen
Sobald Ihre Arbeitsmappe fertig ist, speichert Spire.XLS sie in einem virtuellen WebAssembly-Dateisystem. Anschließend lesen Sie die Dateidaten, konvertieren sie in einen Blob und lösen einen Download aus:
workbook.SaveToFile({
    fileName: "Report.xlsx",
    version: xls.ExcelVersion.Version2016
});

const fileData = window.dotnetRuntime.Module.FS.readFile("Report.xlsx");
const blob = new Blob([fileData], {
    type: "application/vnd.openxmlformats-officedocument.spreadsheetml.sheet"
});
const url = URL.createObjectURL(blob);
const a = document.createElement("a");
a.href = url;
a.download = "Report.xlsx";
a.click();
URL.revokeObjectURL(url);

workbook.Dispose();
Rufen Sie nach dem Download immer workbook.Dispose() auf, um Speicher freizugeben – insbesondere in Apps, in denen Benutzer mehrere Dateien in einer Sitzung generieren. Die Arbeitsmappe selbst verbleibt bis dahin im WebAssembly-Heap, und dieser Heap wird nicht vom Garbage Collector des Browsers zurückgewonnen.
Suchen Sie React-Integration oder HTML-Tabellenexport? Sehen Sie sich unsere Anleitung zum Herunterladen und Exportieren von Excel-Dateien in JavaScript & React an.
Alles zusammenfügen: Ein formatierter Verkaufsbericht
Die obigen Snippets erstellen eine Arbeitsmappe Stück für Stück. Hier sind sie in einer einzigen Funktion: ein formatiertes Arbeitsblatt mit Zebra-Streifen und Währungsformaten, formelgesteuerten Umsatz- und Anteilsspalten, einem Säulendiagramm und einem zweiten Arbeitsblatt, das die Zahlen zusammenfasst.
/**
 * Build a formatted sales report workbook in the browser and download it as
 * SalesReport.xlsx.
 *
 * The layout is driven by `products` below — swap it for form input, an API
 * response or component state and nothing else needs to change.
 */
async function createExcelReport() {
  // spire.office 11.7.0 exposes Spire.XLS as `window.spirexls`. Older builds
  // hung it off `window.wasmModule.spirexls`; that global no longer exists.
  const xls = window.spirexls;
  if (!xls) throw new Error('Spire.XLS is not ready yet');

  // [product, units sold, unit price] — revenue and share are derived by formula
  const products = [
    ['Atlas 14 Ultrabook', 42, 1249.0],
    ['Orbit Wireless Mouse', 380, 24.99],
    ['Vertex Mechanical Keyboard', 165, 89.5],
    ['Lumen 27 4K Monitor', 74, 429.0],
    ['Halo USB-C Dock', 210, 139.0],
    ['Pulse ANC Headset', 128, 199.0],
  ];
  const FIRST = 5; // first data row
  const TOTAL = FIRST + products.length; // total row

  const wb = new xls.Workbook();
  wb.Worksheets.Clear();
  const sheet = wb.Worksheets.Add('Sales Report');

  const at = (a) => sheet.Range.get(a);
  const cell = (row, col) => sheet.Range.get({ row: row, column: col });
  const paint = (a, colour) => {
    at(a).Style.Color = colour;
  };

  // ── Sizing ── explicit widths (AutoFitColumn is unreliable in the WASM sandbox)
  [34, 9, 13, 14, 9].forEach((w, i) => {
    sheet.Columns.get(i).ColumnWidth = w;
  });
  sheet.Rows.get(0).RowHeight = 34; // title
  sheet.Rows.get(1).RowHeight = 20; // subtitle
  sheet.Rows.get(2).RowHeight = 8; // spacer
  sheet.Rows.get(3).RowHeight = 24; // header

  // ── Title band ── merge first, then style the whole merged area
  at('A1:E1').Merge();
  cell(1, 1).Text = 'Sales Report — Q3 2026';
  paint('A1:E1', xls.Color.get_DarkBlue());
  at('A1:E1').Style.Font.Color = xls.Color.get_White();
  at('A1:E1').Style.Font.IsBold = true;
  at('A1:E1').Style.Font.Size = 15;
  at('A1:E1').Style.VerticalAlignment = xls.VerticalAlignType.Center;

  at('A2:E2').Merge();
  cell(2, 1).Text = 'Region: West · Period: 1 Jul – 30 Sep 2026 · Amounts in USD';
  paint('A2:E2', xls.Color.get_DarkBlue());
  at('A2:E2').Style.Font.Color = xls.Color.get_LightSteelBlue();
  at('A2:E2').Style.Font.Size = 9.5;
  at('A2:E2').Style.VerticalAlignment = xls.VerticalAlignType.Center;

  // ── Header row ───────────────────────────────────────────────────────────
  ['Product', 'Units', 'Unit Price', 'Revenue', 'Share'].forEach((label, i) => {
    cell(4, i + 1).Text = label;
  });
  paint('A4:E4', xls.Color.get_LightSteelBlue());
  at('A4:E4').Style.Font.Color = xls.Color.get_DarkBlue();
  at('A4:E4').Style.Font.IsBold = true;
  at('A4:E4').Style.Font.Size = 10.5;
  at('A4:E4').Style.HorizontalAlignment = xls.HorizontalAlignType.Center;
  at('A4:E4').Style.VerticalAlignment = xls.VerticalAlignType.Center;

  // ── Data rows ── numbers go in as NumberValue, never as text
  products.forEach(([name, units, price], i) => {
    const r = FIRST + i;
    cell(r, 1).Text = name;
    cell(r, 2).NumberValue = units;
    cell(r, 3).NumberValue = price;
    cell(r, 4).Formula = `=B${r}*C${r}`;
    cell(r, 5).Formula = `=D${r}/$D${TOTAL}`; // share of the grand total
    sheet.Rows.get(r - 1).RowHeight = 20;
    if (i % 2) paint(`A${r}:E${r}`, xls.Color.get_WhiteSmoke()); // zebra banding
  });

  // ── Total row ────────────────────────────────────────────────────────────
  cell(TOTAL, 1).Text = 'Total';
  [2, 4, 5].forEach((col) => {
    const letter = String.fromCharCode(64 + col);
    cell(TOTAL, col).Formula = `=SUM(${letter}${FIRST}:${letter}${TOTAL - 1})`;
  });
  paint(`A${TOTAL}:E${TOTAL}`, xls.Color.get_LightSkyBlue());
  at(`A${TOTAL}:E${TOTAL}`).Style.Font.IsBold = true;
  sheet.Rows.get(TOTAL - 1).RowHeight = 22;

  // ── Number formats and borders ───────────────────────────────────────────
  at(`B${FIRST}:B${TOTAL}`).NumberFormat = '#,##0';
  at(`C${FIRST}:D${TOTAL}`).NumberFormat = '$#,##0.00';
  at(`E${FIRST}:E${TOTAL}`).NumberFormat = '0.0%';

  const table = at(`A4:E${TOTAL}`);
  table.Borders.LineStyle = xls.LineStyleType.Thin;
  table.Borders.Color = xls.Color.get_LightSteelBlue();
  at(`A${TOTAL}:E${TOTAL}`).Borders.get_Item(xls.BordersLineType.EdgeTop).LineStyle =
    xls.LineStyleType.Medium;

  // ── Chart ── build the series by hand (DataRange would mix units)
  const chart = sheet.Charts.Add();
  chart.ChartType = xls.ExcelChartType.ColumnClustered;
  chart.LeftColumn = 6;
  chart.TopRow = 3;
  chart.RightColumn = 13;
  chart.BottomRow = 21;
  const serie = chart.Series.Add();
  serie.CategoryLabels = at(`A${FIRST}:A${TOTAL - 1}`);
  serie.Values = at(`D${FIRST}:D${TOTAL - 1}`);
  serie.Name = 'Revenue';
  chart.ChartTitleArea.Text = 'Revenue by product';
  chart.HasLegend = false;
  chart.PrimaryValueAxis.NumberFormat = '$#,##0';

  // ── Sheet chrome ──
  sheet.FreezePanes(FIRST, 1);
  sheet.GridLinesVisible = false;
  sheet.TabColor = xls.Color.get_DarkBlue();

  // ── Second worksheet: cross-sheet roll-up ──
  const summary = wb.Worksheets.Add('Summary');
  summary.Columns.get(0).ColumnWidth = 26;
  summary.Columns.get(1).ColumnWidth = 18;
  summary.Rows.get(0).RowHeight = 30;
  summary.Rows.get(1).RowHeight = 18;
  summary.Rows.get(3).RowHeight = 22;

  const band = (a, text, size) => {
    summary.Range.get(a).Merge();
    summary.Range.get(a.split(':')[0]).Text = text;
    summary.Range.get(a).Style.Color = xls.Color.get_DarkBlue();
    summary.Range.get(a).Style.Font.Color = xls.Color.get_White();
    summary.Range.get(a).Style.Font.IsBold = true;
    summary.Range.get(a).Style.Font.Size = size;
    summary.Range.get(a).Style.VerticalAlignment = xls.VerticalAlignType.Center;
  };
  band('A1:B1', 'Executive Summary', 14);
  band('A2:B2', 'Sales Report · Q3 2026', 9.5);

  ['Metric', 'Value'].forEach((label, i) => {
    summary.Range.get({ row: 4, column: i + 1 }).Text = label;
  });
  summary.Range.get('A4:B4').Style.Color = xls.Color.get_LightSteelBlue();
  summary.Range.get('A4:B4').Style.Font.Color = xls.Color.get_DarkBlue();
  summary.Range.get('A4:B4').Style.Font.IsBold = true;

  [
    ['Total revenue', "='Sales Report'!D" + TOTAL, '$#,##0.00'],
    ['Units shipped', "='Sales Report'!B" + TOTAL, '#,##0'],
    ['Average unit price', `='Sales Report'!D${TOTAL}/'Sales Report'!B${TOTAL}`, '$#,##0.00'],
  ].forEach(([label, formula, format], i) => {
    summary.Range.get({ row: 5 + i, column: 1 }).Text = label;
    const value = summary.Range.get({ row: 5 + i, column: 2 });
    value.Formula = formula;
    value.NumberFormat = format;
    value.Style.HorizontalAlignment = xls.HorizontalAlignType.Right;
    if (i % 2) summary.Range.get(`A${5 + i}:B${5 + i}`).Style.Color = xls.Color.get_WhiteSmoke();
  });

  // Date — use Date.UTC to avoid timezone shift
  summary.Range.get('A8').Text = 'Report date';
  const reportDate = summary.Range.get('B8');
  reportDate.DateTimeValue = new Date(Date.UTC(2026, 8, 28));
  reportDate.NumberFormat = 'yyyy-mm-dd';
  reportDate.Style.HorizontalAlignment = xls.HorizontalAlignType.Right;

  const kpis = summary.Range.get('A4:B8');
  kpis.Borders.LineStyle = xls.LineStyleType.Thin;
  kpis.Borders.Color = xls.Color.get_LightSteelBlue();
  summary.GridLinesVisible = false;
  summary.TabColor = xls.Color.get_LightSteelBlue();

  // ── Save, then release ──
  wb.CalculateAllValue();
  const fileName = 'SalesReport.xlsx';
  wb.SaveToFile({ fileName: fileName, version: xls.ExcelVersion.Version2016 });

  const fileData = window.dotnetRuntime.Module.FS.readFile(fileName);
  const blob = new Blob([fileData], {
    type: 'application/vnd.openxmlformats-officedocument.spreadsheetml.sheet',
  });
  const url = URL.createObjectURL(blob);
  Object.assign(document.createElement('a'), { href: url, download: fileName }).click();
  URL.revokeObjectURL(url);

  wb.Dispose(); // free the WASM heap — one workbook per generation cycle
}
Das Layout folgt den Daten. Ersetzen Sie das Array products durch eine Antwort Ihrer eigenen API, und alles andere – Summen, Anteilsprozentsätze, der Diagrammbereich, die Zusammenfassung – funktioniert weiterhin, da sie alle als Formeln oder abgeleitete Bereiche und nicht als fest codierte Werte ausgedrückt sind.
Weitere Diagrammtypen und Konfigurationsoptionen finden Sie unter Excel-Diagramme mit JavaScript in React erstellen.
Eine Excel-Datei aus CSV-Daten erstellen
Sie können tabellarische Daten aus einer CSV-Datei in ein Arbeitsblatt laden und das Ergebnis als XLSX speichern. Die resultierende Arbeitsmappe kann dann formatiert oder um Formeln und zusätzliche Arbeitsblätter erweitert werden:
// The library reads from its own virtual file system, so the CSV has to be
// there before you can load it — written from a string here, from the bytes of
// a File object in a real application.
const csv = "Product,Quantity,Price\nLaptop,10,999.99\nMouse,50,24.99\nKeyboard,30,59.99";
window.dotnetRuntime.Module.FS.writeFile("data.csv", new TextEncoder().encode(csv));

workbook.LoadFromFile("data.csv", ",");
workbook.SaveToFile({
    fileName: "ConvertedFromCSV.xlsx",
    version: xls.ExcelVersion.Version2016
});
Das importierte Blatt wird nach der Datei benannt (data), sodass Worksheets.get(0) es aufgreift.
Das Trennzeichen ist ein erforderliches zweites Argument. LoadFromFile("data.csv") allein wird mit This is not a structured storage file abgelehnt, da die Überladung mit einem Argument ein strukturiertes Format wie .xlsx oder .xls erwartet und CSV nicht erkennt.
Es gibt einen zweiten Haken: Der CSV-Importer schreibt jedes Feld als Text. Eine Mengenspalte kommt als "10" statt als 10 an, was bedeutet, dass sie nicht numerisch summiert oder sortiert werden kann – genau das Problem, das zuvor in diesem Tutorial beschrieben wurde. Konvertieren Sie die benötigten Spalten vor dem Speichern:
const csvSheet = workbook.Worksheets.get(0);

// The importer leaves every field as text — coerce each numeric column.
// Columns 2 and 3 hold Quantity and Price; both arrive as "10" and "999.99".
for (let row = 2; row <= 4; row++) {
    [2, 3].forEach((column) => {
        const cell = csvSheet.Range.get({ row: row, column: column });
        if (cell.Text !== "") {
            cell.NumberValue = Number(cell.Text);
        }
    });
}
Eine vollständige Anleitung zur Konvertierung zwischen CSV- und Excel-Formaten finden Sie in unserem Tutorial zur CSV-zu-Excel-Konvertierung.
Eine XLS-Datei statt XLSX erstellen
Wenn Ihre Anwendung das Legacy-Format .xls statt .xlsx generieren muss, ändern Sie den Versionsparameter:
workbook.SaveToFile({
    fileName: "Report.xls",
    version: xls.ExcelVersion.Version97to2003
});
Das Enum-Element ist Version97to2003 – es gibt kein Version97. Behalten Sie Diagramme in XLSX; der getestete XLS-Writer schlägt fehl, wenn Diagramm-Schriftartmetriken erforderlich sind.
XLSX (Excel 2007+) ist das empfohlene Format für neue Anwendungen. XLS (Excel 97–2003) ist nur erforderlich, wenn Abwärtskompatibilität benötigt wird.
Häufige Probleme
window.wasmModule ist nicht definiert. Ältere Beispiele lesen die Tabellenkalkulations-API aus window.wasmModule.spirexls. Aktuelle Releases installieren sie direkt auf window.spirexls und lassen wasmModule nicht definiert, sodass bereits der erste Zugriff einen Fehler auslöst. Prüfen Sie stattdessen window.spirexls.
WASM-Modul nicht initialisiert. Wenn window.spirexls nicht definiert ist, hat die Runtime das Laden noch nicht abgeschlossen. Zeigen Sie einen Ladeindikator an und warten Sie, bis die Initialisierung abgeschlossen ist, bevor Sie Excel-Operationen versuchen.
Auto-Fit löst einen Schriftartfehler aus. AutoFitColumn und AutoFitRow benötigen eine Systemschriftart zum Messen von Text, und die WebAssembly-Sandbox hat keine. Sie schlagen mit Cannot found font(Arial) installed on the system. fehl. Berechnen oder hardcoden Sie Ihre Spaltenbreiten mit sheet.Columns.get(i).ColumnWidth.
Zahlen als Text gespeichert. Die Verwendung von cell.Text = "100" statt cell.NumberValue = 100 bricht Sortierung und Berechnungen. Dies ist das häufigste Problem, auf das Entwickler beim Schreiben von Excel-Dateien in JavaScript stoßen, und der CSV-Import löst es automatisch aus – verwenden Sie immer NumberValue für numerische Daten.
Ein Blatt "Evaluation Warning" erscheint. Wenn Sie die Evaluierungsversion ohne gültige Lizenz verwenden, fügt Spire.XLS der gespeicherten Arbeitsmappe ein Evaluierungsblatt hinzu. Dieses Blatt wird beim Speichern neu erstellt, sodass das programmgesteuerte Entfernen kein zuverlässiger Workaround ist. Wenden Sie einen Lizenzschlüssel an, um dies zu verhindern.
Speicherlecks in lang laufenden Apps. Rufen Sie workbook.Dispose() nach jedem Generierungszyklus auf. In Single-Page-Anwendungen sammeln nicht freigegebene Arbeitsmappen Speicher an und beeinträchtigen die Leistung im Laufe der Zeit.
FAQ
Kann JavaScript Excel-Dateien ohne Microsoft Excel erstellen?
Ja. Spire.XLS für JavaScript läuft vollständig im Browser über WebAssembly. Es ist keine Installation von Microsoft Excel oder server-seitigem Office erforderlich, um XLSX-Dateien zu generieren.
Kann JavaScript XLSX-Dateien direkt im Browser erstellen?
Ja. Alle Tabellenkalkulationsoperationen erfolgen clientseitig. Die Datei wird in einem virtuellen Dateisystem gespeichert und dann als Blob heruntergeladen – kein Backend-Server erforderlich.
Was ist der Unterschied zwischen XLS und XLSX?
XLSX (Excel 2007 und später) ist das moderne XML-basierte Format, empfohlen für neue Anwendungen. XLS (Excel 97–2003) ist das ältere binäre Format, nützlich für die Kompatibilität mit älteren Systemen.
Fazit
Das Erstellen von Excel-Dateien in JavaScript erfordert keinen Backend-Server oder Microsoft Excel. Mit Spire.XLS für JavaScript können Sie Arbeitsmappen von Grund auf erstellen, typisierte Daten schreiben, Formeln hinzufügen, Formatierungen anwenden und Daten über mehrere Blätter organisieren – alles im Browser.
Beginnen Sie mit dem obigen einfachen Beispiel und ergänzen Sie dann Formeln und Formatierungen, wenn Ihre Anforderungen wachsen. Für React-spezifische Integration und HTML-Tabellenexport lesen Sie unser dediziertes Export-Tutorial.
Siehe auch
Как создавать файлы Excel в JavaScript (XLSX/XLS)
Содержание
- Установка и инициализация
- Создание базового файла Excel
- Запись различных типов данных
- Добавление формул
- Форматирование созданного файла
- Создание нескольких рабочих листов
- Сохранение и загрузка
- Собираем всё вместе
- Создание из данных CSV
- Создание файла XLS
- Распространённые проблемы
- Часто задаваемые вопросы
- Заключение
JavaScript может создавать книги Excel прямо в браузере. С помощью Spire.XLS for JavaScript вы можете создать книгу, добавить рабочие листы, записать значения и формулы, применить форматирование и сохранить результат в формате XLSX или XLS — всё на стороне клиента, без необходимости установки Microsoft Excel.
Это руководство начинается с базовой книги XLSX, а затем добавляет типизированные значения ячеек, формулы, форматирование, несколько рабочих листов, поддержку загрузки в браузере, преобразование CSV и вывод в XLS для обратной совместимости.
Установка и инициализация Spire.XLS for JavaScript
Spire.XLS for JavaScript поставляется внутри пакета spire.office вместе с Spire.PDF, Spire.Doc и Spire.Presentation:
npm i spire.office
Для запуска среды требуется два импорта. Первый запускает общий хост .NET WebAssembly; второй регистрирует API для работы с электронными таблицами:
// 1. Boot the shared runtime once per page.
const common = await import('/node_modules/spire.office/spire.common.js');
await common.initializeWasm();

// 2. Load the spreadsheet engine — this is what creates window.spirexls.
await import('/node_modules/spire.office/spire.xls.js');
Архивы Spire.*.Wasm.zip и папка _framework должны быть доступны из корня сайта. Среда выполнения разрешает их относительно URL документа, а не относительно модуля, выполнившего импорт, поэтому в проекте Vite или Create React App они должны находиться в public/. Префикс process.env.PUBLIC_URL, показанный в настройках на основе React, является соглашением Create React App, а не стандартом браузера — настройте базовый путь в соответствии с вашим инструментом сборки, если вы не используете CRA. Если архивы отсутствуют, браузер выводит в консоль WebAssembly.compile(): expected magic word — сервер разработки ответил на запрос архива с помощью index.html.
Затем всё завязано на один глобальный объект:
const xls = window.spirexls;
В текущей конфигурации пакета, используемой в этом руководстве, API для работы с электронными таблицами предоставляется через window.spirexls. Используйте этот глобальный объект после инициализации среды выполнения. В более старых версиях он был доступен как window.wasmModule.spirexls; если вы работаете с другой версией пакета, проверьте, какой глобальный объект доступен.
Теперь вы готовы создавать файлы Excel.
Создание базового файла Excel на JavaScript
Давайте создадим отчёт о продажах. Мы создадим книгу, добавим рабочий лист, запишем данные о продуктах в ячейки и сохраним результат в виде файла XLSX, который автоматически загрузится.
async function createExcelFile() {
    const xls = window.spirexls;
    if (!xls) {
        console.error('Spire.XLS is not initialized.');
        return;
    }

    // A fresh Workbook() already contains three blank worksheets, so clear them
    // and add the single sheet this report needs.
    const workbook = new xls.Workbook();
    workbook.Worksheets.Clear();
    const sheet = workbook.Worksheets.Add("Sales Report");

    // Sample data: product sales
    const data = [
        ["Product", "Quantity", "Price"],
        ["Laptop", 10, 999.99],
        ["Mouse", 50, 24.99],
        ["Keyboard", 30, 59.99],
        ["Monitor", 15, 329.99]
    ];

    // Write data to cells
    for (let row = 0; row < data.length; row++) {
        for (let col = 0; col < data[row].length; col++) {
            const cell = sheet.Range.get({ row: row + 1, column: col + 1 });
            if (typeof data[row][col] === "string") {
                cell.Text = data[row][col];
            } else {
                cell.NumberValue = data[row][col];
            }
        }
    }

    // Save to the virtual file system, read the bytes, download, then dispose
    const fileName = "SalesReport.xlsx";
    workbook.SaveToFile({
        fileName: fileName,
        version: xls.ExcelVersion.Version2016
    });

    const fileData = window.dotnetRuntime.Module.FS.readFile(fileName);
    const blob = new Blob([fileData], {
        type: "application/vnd.openxmlformats-officedocument.spreadsheetml.sheet"
    });
    const url = URL.createObjectURL(blob);
    const a = document.createElement("a");
    a.href = url;
    a.download = fileName;
    a.click();
    URL.revokeObjectURL(url);

    workbook.Dispose();
}
Вызовите createExcelFile(), и вы получите SalesReport.xlsx с четырьмя строками продуктов и заголовком. Рабочий процесс прост: создать книгу → записать данные → сохранить → скачать.
Следующие разделы расширяют этот пример. Предполагается, что каждый фрагмент кода добавлен внутри createExcelFile() после создания книги и рабочего листа.
Запись различных типов данных в ячейки Excel
Excel различает текст, числа, даты и логические значения. Неправильное определение типа приводит к файлам, в которых нарушается сортировка, формулы возвращают ошибки, а числа отображаются как текст.
const sheet = workbook.Worksheets.get(0);

// Text — for labels, names, descriptions
sheet.Range.get("A1").Text = "Product Name";

// Number — for anything you'll calculate, sort, or filter
sheet.Range.get("B1").NumberValue = 999.99;

// Date — a real DateTimeValue plus a display format
const dateCell = sheet.Range.get("C1");
dateCell.DateTimeValue = new Date(Date.UTC(2025, 2, 15));
dateCell.NumberFormat = "yyyy-mm-dd";

// Boolean — use BooleanValue, not text
sheet.Range.get("D1").BooleanValue = true;
Самая распространённая ошибка? Запись cell.Text = "999.99" вместо cell.NumberValue = 999.99. Значение выглядит идентично при открытии файла, но Excel обрабатывает его как текст — вы не можете суммировать, усреднять или сортировать его численно. Всегда используйте NumberValue для чисел, DateTimeValue для дат и BooleanValue для логических значений.
Даты требуют одной дополнительной меры предосторожности. DateTimeValue сохраняет момент UTC, представленный JavaScript-объектом Date. Создание даты с местной полуночью может поэтому сдвинуть отображаемый день в некоторых часовых поясах; используйте Date.UTC(), когда вы хотите сохранить конкретную календарную дату.
Добавление формул на рабочий лист Excel
Формулы превращают созданный файл в настоящую электронную таблицу, а не просто в набор данных. Давайте добавим столбец Total, который вычисляет Quantity × Price для каждой строки, а также общий итог внизу:
// Add "Total" header
sheet.Range.get({ row: 1, column: 4 }).Text = "Total";

// Per-row formula: Total = Quantity × Price
for (let i = 2; i <= 5; i++) {
    sheet.Range.get({ row: i, column: 4 }).Formula = `=B${i}*C${i}`;
}

// Grand total row
sheet.Range.get({ row: 6, column: 1 }).Text = "Total";
sheet.Range.get({ row: 6, column: 2 }).Formula = "=SUM(B2:B5)";
sheet.Range.get({ row: 6, column: 4 }).Formula = "=SUM(D2:D5)";

// Evaluate the formulas once, so their results are written into the file.
workbook.CalculateAllValue();
Вызывайте workbook.CalculateAllValue() перед сохранением, когда вам нужно, чтобы созданная книга содержала вычисленные результаты формул. Это полезно для программ просмотра или приложений, которые полагаются на кэшированные значения вместо пересчёта формул при открытии.
Для получения полного руководства по функциям Excel и операциям с формулами см. Вставка или чтение функций и формул в рабочих листах Excel с помощью JavaScript в React.
Форматирование созданного файла Excel
Электронная таблица с необработанными данными работает, но отформатированная таблица передаёт информацию. Давайте превратим наш отчёт о продажах во что-то, что вы действительно отправили бы заинтересованному лицу:
// Bold, colored header row
const header = sheet.Range.get("A1:D1");
header.Style.Font.IsBold = true;
header.Style.Font.Size = 12;
header.Style.Color = xls.Color.get_LightSkyBlue();

// Currency format for Price and Total columns
for (let i = 2; i <= 5; i++) {
    sheet.Range.get({ row: i, column: 3 }).NumberFormat = "$#,##0.00";
    sheet.Range.get({ row: i, column: 4 }).NumberFormat = "$#,##0.00";
}

// Set column widths explicitly
[26, 10, 12, 12].forEach((width, i) => {
    sheet.Columns.get(i).ColumnWidth = width;
});

// Clean borders
const usedRange = sheet.Range.get("A1:D6");
usedRange.Borders.LineStyle = xls.LineStyleType.Thin;
usedRange.Borders.Color = xls.Color.get_LightSteelBlue();
Здесь стоит знать две детали. sheet.Columns.get(i) и sheet.Rows.get(i) используют нумерацию с 0 и метод get, в отличие от get_Item, который предоставляют другие коллекции. И в протестированной конфигурации браузера AutoFitColumn требует шрифт, недоступный в песочнице WebAssembly, поэтому явная установка ColumnWidth более надёжна.
Результат: жирный синий заголовок, цены в денежном формате, столбцы правильного размера и чистые границы.
Для получения подробных рекомендаций по размерам строк и столбцов см. Установка высоты строки и ширины столбца в Excel с помощью JavaScript в React.
Создание нескольких рабочих листов в книге Excel
Настоящие отчёты редко помещаются на одном листе. Отчёт о продажах может содержать сводку на первой вкладке, сведения о продуктах на второй и помесячную разбивку на третьей.
workbook.Worksheets.Clear();
const summarySheet = workbook.Worksheets.Add("Summary");
const productsSheet = workbook.Worksheets.Add("Products");
const monthlySheet = workbook.Worksheets.Add("Monthly Data");

// Products sheet — write actual data so cross-sheet formulas work
productsSheet.Range.get("A1").Text = "Product";
productsSheet.Range.get("B1").Text = "Quantity";
productsSheet.Range.get("C1").Text = "Price";
productsSheet.Range.get("D1").Text = "Total";

const products = [
    ["Laptop", 10, 999.99],
    ["Mouse", 50, 24.99],
    ["Keyboard", 30, 59.99],
    ["Monitor", 15, 329.99]
];

for (let i = 0; i < products.length; i++) {
    const row = i + 2;
    productsSheet.Range.get({ row: row, column: 1 }).Text = products[i][0];
    productsSheet.Range.get({ row: row, column: 2 }).NumberValue = products[i][1];
    productsSheet.Range.get({ row: row, column: 3 }).NumberValue = products[i][2];
    productsSheet.Range.get({ row: row, column: 4 }).Formula = `=B${row}*C${row}`;
}

// Summary sheet with cross-sheet reference
summarySheet.Range.get("A1").Text = "Sales Summary";
summarySheet.Range.get("A1").Style.Font.IsBold = true;
summarySheet.Range.get("A2").Text = "Total Products";
summarySheet.Range.get("B2").NumberValue = 4;
summarySheet.Range.get("A3").Text = "Total Revenue";
summarySheet.Range.get("B3").Formula = "=SUM(Products!D2:D5)";
Каждый вызов Worksheets.Add(name) возвращает только что созданный лист в порядке вызовов, поэтому порядок вкладок соответствует порядку в коде. Обратите внимание на формулу между листами: =SUM(Products!D2:D5) на листе Summary ссылается на столбец Total на листе Products. Excel обрабатывает это автоматически при открытии файла — дополнительный код не требуется.
Подробнее об управлении рабочими листами — добавлении, удалении и изменении порядка листов — см. Добавление, удаление и перемещение рабочих листов Excel с помощью JavaScript в React.
Сохранение и загрузка файла XLSX в браузере
Когда ваша книга готова, Spire.XLS сохраняет её в виртуальную файловую систему WebAssembly. Затем вы читаете данные файла, преобразуете их в Blob и запускаете загрузку:
workbook.SaveToFile({
    fileName: "Report.xlsx",
    version: xls.ExcelVersion.Version2016
});

const fileData = window.dotnetRuntime.Module.FS.readFile("Report.xlsx");
const blob = new Blob([fileData], {
    type: "application/vnd.openxmlformats-officedocument.spreadsheetml.sheet"
});
const url = URL.createObjectURL(blob);
const a = document.createElement("a");
a.href = url;
a.download = "Report.xlsx";
a.click();
URL.revokeObjectURL(url);

workbook.Dispose();
Всегда вызывайте workbook.Dispose() после загрузки, чтобы освободить память — особенно в приложениях, где пользователи создают несколько файлов за сеанс. Сама книга находится в куче WebAssembly, пока вы этого не сделаете, и эта куча не освобождается сборщиком мусора браузера.
Ищете интеграцию с React или экспорт HTML-таблиц? Ознакомьтесь с нашим руководством по загрузке и экспорту файлов Excel в JavaScript и React.
Собираем всё вместе: форматированный отчёт о продажах
Приведённые выше фрагменты создают книгу по частям. Здесь они собраны в одну функцию: оформленный рабочий лист с чередующейся заливкой строк и денежными форматами, столбцы выручки и доли на основе формул, гистограмма и второй рабочий лист, который суммирует числа.
/**
 * Build a formatted sales report workbook in the browser and download it as
 * SalesReport.xlsx.
 *
 * The layout is driven by `products` below — swap it for form input, an API
 * response or component state and nothing else needs to change.
 */
async function createExcelReport() {
  // spire.office 11.7.0 exposes Spire.XLS as `window.spirexls`. Older builds
  // hung it off `window.wasmModule.spirexls`; that global no longer exists.
  const xls = window.spirexls;
  if (!xls) throw new Error('Spire.XLS is not ready yet');

  // [product, units sold, unit price] — revenue and share are derived by formula
  const products = [
    ['Atlas 14 Ultrabook', 42, 1249.0],
    ['Orbit Wireless Mouse', 380, 24.99],
    ['Vertex Mechanical Keyboard', 165, 89.5],
    ['Lumen 27 4K Monitor', 74, 429.0],
    ['Halo USB-C Dock', 210, 139.0],
    ['Pulse ANC Headset', 128, 199.0],
  ];
  const FIRST = 5; // first data row
  const TOTAL = FIRST + products.length; // total row

  const wb = new xls.Workbook();
  wb.Worksheets.Clear();
  const sheet = wb.Worksheets.Add('Sales Report');

  const at = (a) => sheet.Range.get(a);
  const cell = (row, col) => sheet.Range.get({ row: row, column: col });
  const paint = (a, colour) => {
    at(a).Style.Color = colour;
  };

  // ── Sizing ── explicit widths (AutoFitColumn is unreliable in the WASM sandbox)
  [34, 9, 13, 14, 9].forEach((w, i) => {
    sheet.Columns.get(i).ColumnWidth = w;
  });
  sheet.Rows.get(0).RowHeight = 34; // title
  sheet.Rows.get(1).RowHeight = 20; // subtitle
  sheet.Rows.get(2).RowHeight = 8; // spacer
  sheet.Rows.get(3).RowHeight = 24; // header

  // ── Title band ── merge first, then style the whole merged area
  at('A1:E1').Merge();
  cell(1, 1).Text = 'Sales Report — Q3 2026';
  paint('A1:E1', xls.Color.get_DarkBlue());
  at('A1:E1').Style.Font.Color = xls.Color.get_White();
  at('A1:E1').Style.Font.IsBold = true;
  at('A1:E1').Style.Font.Size = 15;
  at('A1:E1').Style.VerticalAlignment = xls.VerticalAlignType.Center;

  at('A2:E2').Merge();
  cell(2, 1).Text = 'Region: West · Period: 1 Jul – 30 Sep 2026 · Amounts in USD';
  paint('A2:E2', xls.Color.get_DarkBlue());
  at('A2:E2').Style.Font.Color = xls.Color.get_LightSteelBlue();
  at('A2:E2').Style.Font.Size = 9.5;
  at('A2:E2').Style.VerticalAlignment = xls.VerticalAlignType.Center;

  // ── Header row ───────────────────────────────────────────────────────────
  ['Product', 'Units', 'Unit Price', 'Revenue', 'Share'].forEach((label, i) => {
    cell(4, i + 1).Text = label;
  });
  paint('A4:E4', xls.Color.get_LightSteelBlue());
  at('A4:E4').Style.Font.Color = xls.Color.get_DarkBlue();
  at('A4:E4').Style.Font.IsBold = true;
  at('A4:E4').Style.Font.Size = 10.5;
  at('A4:E4').Style.HorizontalAlignment = xls.HorizontalAlignType.Center;
  at('A4:E4').Style.VerticalAlignment = xls.VerticalAlignType.Center;

  // ── Data rows ── numbers go in as NumberValue, never as text
  products.forEach(([name, units, price], i) => {
    const r = FIRST + i;
    cell(r, 1).Text = name;
    cell(r, 2).NumberValue = units;
    cell(r, 3).NumberValue = price;
    cell(r, 4).Formula = `=B${r}*C${r}`;
    cell(r, 5).Formula = `=D${r}/$D${TOTAL}`; // share of the grand total
    sheet.Rows.get(r - 1).RowHeight = 20;
    if (i % 2) paint(`A${r}:E${r}`, xls.Color.get_WhiteSmoke()); // zebra banding
  });

  // ── Total row ────────────────────────────────────────────────────────────
  cell(TOTAL, 1).Text = 'Total';
  [2, 4, 5].forEach((col) => {
    const letter = String.fromCharCode(64 + col);
    cell(TOTAL, col).Formula = `=SUM(${letter}${FIRST}:${letter}${TOTAL - 1})`;
  });
  paint(`A${TOTAL}:E${TOTAL}`, xls.Color.get_LightSkyBlue());
  at(`A${TOTAL}:E${TOTAL}`).Style.Font.IsBold = true;
  sheet.Rows.get(TOTAL - 1).RowHeight = 22;

  // ── Number formats and borders ───────────────────────────────────────────
  at(`B${FIRST}:B${TOTAL}`).NumberFormat = '#,##0';
  at(`C${FIRST}:D${TOTAL}`).NumberFormat = '$#,##0.00';
  at(`E${FIRST}:E${TOTAL}`).NumberFormat = '0.0%';

  const table = at(`A4:E${TOTAL}`);
  table.Borders.LineStyle = xls.LineStyleType.Thin;
  table.Borders.Color = xls.Color.get_LightSteelBlue();
  at(`A${TOTAL}:E${TOTAL}`).Borders.get_Item(xls.BordersLineType.EdgeTop).LineStyle =
    xls.LineStyleType.Medium;

  // ── Chart ── build the series by hand (DataRange would mix units)
  const chart = sheet.Charts.Add();
  chart.ChartType = xls.ExcelChartType.ColumnClustered;
  chart.LeftColumn = 6;
  chart.TopRow = 3;
  chart.RightColumn = 13;
  chart.BottomRow = 21;
  const serie = chart.Series.Add();
  serie.CategoryLabels = at(`A${FIRST}:A${TOTAL - 1}`);
  serie.Values = at(`D${FIRST}:D${TOTAL - 1}`);
  serie.Name = 'Revenue';
  chart.ChartTitleArea.Text = 'Revenue by product';
  chart.HasLegend = false;
  chart.PrimaryValueAxis.NumberFormat = '$#,##0';

  // ── Sheet chrome ──
  sheet.FreezePanes(FIRST, 1);
  sheet.GridLinesVisible = false;
  sheet.TabColor = xls.Color.get_DarkBlue();

  // ── Second worksheet: cross-sheet roll-up ──
  const summary = wb.Worksheets.Add('Summary');
  summary.Columns.get(0).ColumnWidth = 26;
  summary.Columns.get(1).ColumnWidth = 18;
  summary.Rows.get(0).RowHeight = 30;
  summary.Rows.get(1).RowHeight = 18;
  summary.Rows.get(3).RowHeight = 22;

  const band = (a, text, size) => {
    summary.Range.get(a).Merge();
    summary.Range.get(a.split(':')[0]).Text = text;
    summary.Range.get(a).Style.Color = xls.Color.get_DarkBlue();
    summary.Range.get(a).Style.Font.Color = xls.Color.get_White();
    summary.Range.get(a).Style.Font.IsBold = true;
    summary.Range.get(a).Style.Font.Size = size;
    summary.Range.get(a).Style.VerticalAlignment = xls.VerticalAlignType.Center;
  };
  band('A1:B1', 'Executive Summary', 14);
  band('A2:B2', 'Sales Report · Q3 2026', 9.5);

  ['Metric', 'Value'].forEach((label, i) => {
    summary.Range.get({ row: 4, column: i + 1 }).Text = label;
  });
  summary.Range.get('A4:B4').Style.Color = xls.Color.get_LightSteelBlue();
  summary.Range.get('A4:B4').Style.Font.Color = xls.Color.get_DarkBlue();
  summary.Range.get('A4:B4').Style.Font.IsBold = true;

  [
    ['Total revenue', "='Sales Report'!D" + TOTAL, '$#,##0.00'],
    ['Units shipped', "='Sales Report'!B" + TOTAL, '#,##0'],
    ['Average unit price', `='Sales Report'!D${TOTAL}/'Sales Report'!B${TOTAL}`, '$#,##0.00'],
  ].forEach(([label, formula, format], i) => {
    summary.Range.get({ row: 5 + i, column: 1 }).Text = label;
    const value = summary.Range.get({ row: 5 + i, column: 2 });
    value.Formula = formula;
    value.NumberFormat = format;
    value.Style.HorizontalAlignment = xls.HorizontalAlignType.Right;
    if (i % 2) summary.Range.get(`A${5 + i}:B${5 + i}`).Style.Color = xls.Color.get_WhiteSmoke();
  });

  // Date — use Date.UTC to avoid timezone shift
  summary.Range.get('A8').Text = 'Report date';
  const reportDate = summary.Range.get('B8');
  reportDate.DateTimeValue = new Date(Date.UTC(2026, 8, 28));
  reportDate.NumberFormat = 'yyyy-mm-dd';
  reportDate.Style.HorizontalAlignment = xls.HorizontalAlignType.Right;

  const kpis = summary.Range.get('A4:B8');
  kpis.Borders.LineStyle = xls.LineStyleType.Thin;
  kpis.Borders.Color = xls.Color.get_LightSteelBlue();
  summary.GridLinesVisible = false;
  summary.TabColor = xls.Color.get_LightSteelBlue();

  // ── Save, then release ──
  wb.CalculateAllValue();
  const fileName = 'SalesReport.xlsx';
  wb.SaveToFile({ fileName: fileName, version: xls.ExcelVersion.Version2016 });

  const fileData = window.dotnetRuntime.Module.FS.readFile(fileName);
  const blob = new Blob([fileData], {
    type: 'application/vnd.openxmlformats-officedocument.spreadsheetml.sheet',
  });
  const url = URL.createObjectURL(blob);
  Object.assign(document.createElement('a'), { href: url, download: fileName }).click();
  URL.revokeObjectURL(url);

  wb.Dispose(); // free the WASM heap — one workbook per generation cycle
}
Макет следует за данными. Замените массив products на ответ от вашего собственного API, и всё остальное — итоги, процентные доли, диапазон диаграммы, сводка — продолжит работать, потому что всё это выражено формулами или производными диапазонами, а не жёстко заданными значениями.
Для получения информации о других типах диаграмм и параметрах настройки см. Создание диаграмм Excel с помощью JavaScript в React.
Создание файла Excel из данных CSV
Вы можете загрузить табличные данные из файла CSV на рабочий лист и сохранить результат в формате XLSX. Полученную книгу затем можно отформатировать или расширить с помощью формул и дополнительных рабочих листов:
// The library reads from its own virtual file system, so the CSV has to be
// there before you can load it — written from a string here, from the bytes of
// a File object in a real application.
const csv = "Product,Quantity,Price\nLaptop,10,999.99\nMouse,50,24.99\nKeyboard,30,59.99";
window.dotnetRuntime.Module.FS.writeFile("data.csv", new TextEncoder().encode(csv));

workbook.LoadFromFile("data.csv", ",");
workbook.SaveToFile({
    fileName: "ConvertedFromCSV.xlsx",
    version: xls.ExcelVersion.Version2016
});
Импортированный лист получает имя файла (data), поэтому Worksheets.get(0) его подхватывает.
Разделитель является обязательным вторым аргументом. LoadFromFile("data.csv") сам по себе отклоняется с ошибкой This is not a structured storage file, потому что перегрузка с одним аргументом ожидает структурированный формат, такой как .xlsx или .xls, и не распознаёт CSV.
Есть и второй подвох: импортёр CSV записывает каждое поле как текст. Столбец с количеством приходит как "10", а не 10, что означает, что его нельзя суммировать или сортировать численно — именно та проблема, которая была описана ранее в этом руководстве. Преобразуйте нужные столбцы перед сохранением:
const csvSheet = workbook.Worksheets.get(0);

// The importer leaves every field as text — coerce each numeric column.
// Columns 2 and 3 hold Quantity and Price; both arrive as "10" and "999.99".
for (let row = 2; row <= 4; row++) {
    [2, 3].forEach((column) => {
        const cell = csvSheet.Range.get({ row: row, column: column });
        if (cell.Text !== "") {
            cell.NumberValue = Number(cell.Text);
        }
    });
}
Для получения полного руководства по преобразованию между форматами CSV и Excel см. наш учебник по преобразованию CSV в Excel.
Создание файла XLS вместо XLSX
Если вашему приложению нужно создавать устаревший формат .xls вместо .xlsx, измените параметр версии:
workbook.SaveToFile({
    fileName: "Report.xls",
    version: xls.ExcelVersion.Version97to2003
});
Член перечисления — Version97to2003 — Version97 не существует. Оставляйте диаграммы в XLSX; протестированный модуль записи XLS даёт сбой, когда требуются метрики шрифта диаграммы.
XLSX (Excel 2007+) — рекомендуемый формат для новых приложений. XLS (Excel 97–2003) необходим только при необходимости обратной совместимости.
Распространённые проблемы
window.wasmModule не определён. В старых примерах API для работы с электронными таблицами читался из window.wasmModule.spirexls. В текущих выпусках он устанавливается непосредственно в window.spirexls, а wasmModule остаётся неопределённым, поэтому самое первое обращение вызывает исключение. Вместо этого проверяйте window.spirexls.
Модуль WASM не инициализирован. Если window.spirexls не определён, среда выполнения ещё не завершила загрузку. Покажите индикатор загрузки и дождитесь завершения инициализации, прежде чем пытаться выполнять любые операции с Excel.
Автоподбор выдаёт ошибку шрифта. AutoFitColumn и AutoFitRow нуждаются в системном шрифте для измерения текста, а в песочнице WebAssembly его нет. Они завершаются с ошибкой Cannot found font(Arial) installed on the system. Вычислите или жёстко задайте ширину столбцов с помощью sheet.Columns.get(i).ColumnWidth.
Числа, сохранённые как текст. Использование cell.Text = "100" вместо cell.NumberValue = 100 нарушает сортировку и вычисления. Это самая распространённая проблема, с которой сталкиваются разработчики при записи файлов Excel на JavaScript, и импорт CSV автоматически её вызывает — всегда используйте NumberValue для числовых данных.
Появляется лист "Evaluation Warning". При использовании оценочной сборки без действующей лицензии Spire.XLS добавляет оценочный лист в сохраняемую книгу. Этот лист создаётся заново при каждом сохранении, поэтому его программное удаление не является надёжным обходным путём. Примените лицензионный ключ, чтобы предотвратить его появление.
Утечки памяти в долго работающих приложениях. Вызывайте workbook.Dispose() после каждого цикла создания. В одностраничных приложениях неосвобождённые книги накапливают память и со временем снижают производительность.
Часто задаваемые вопросы
Может ли JavaScript создавать файлы Excel без Microsoft Excel?
Да. Spire.XLS for JavaScript полностью работает в браузере через WebAssembly. Для создания файлов XLSX не требуется установка Microsoft Excel или серверного Office.
Может ли JavaScript создавать файлы XLSX непосредственно в браузере?
Да. Все операции с электронными таблицами выполняются на стороне клиента. Файл сохраняется в виртуальную файловую систему, а затем загружается как Blob — серверная часть не требуется.
В чём разница между XLS и XLSX?
XLSX (Excel 2007 и более поздние версии) — современный формат на основе XML, рекомендуемый для новых приложений. XLS (Excel 97–2003) — устаревший двоичный формат, полезный для совместимости со старыми системами.
Заключение
Создание файлов Excel на JavaScript не требует серверной части или Microsoft Excel. С помощью Spire.XLS for JavaScript вы можете создавать книги с нуля, записывать типизированные данные, добавлять формулы, применять форматирование и организовывать данные на нескольких листах — всё в браузере.
Начните с базового примера выше, затем добавляйте формулы и форматирование по мере необходимости. Для интеграции с React и экспорта HTML-таблиц см. наш специальный учебник по экспорту.
См. также
How to Create Excel Files in JavaScript (XLSX/XLS)
Table of Contents
JavaScript can generate Excel workbooks directly in the browser. With Spire.XLS for JavaScript, you can create a workbook, add worksheets, write values and formulas, apply formatting, and save the result as either an XLSX or XLS file—all client-side, with no Microsoft Excel installation required.
This tutorial starts with a basic XLSX workbook and then adds typed cell values, formulas, formatting, multiple worksheets, browser download support, CSV conversion, and XLS output for legacy compatibility.
Install and Initialize Spire.XLS for JavaScript
Spire.XLS for JavaScript ships inside the spire.office package, together with Spire.PDF, Spire.Doc, and Spire.Presentation:
npm i spire.office
Booting the runtime takes two imports. The first starts the shared .NET WebAssembly host; the second registers the spreadsheet API:
// 1. Boot the shared runtime once per page.
const common = await import('/node_modules/spire.office/spire.common.js');
await common.initializeWasm();

// 2. Load the spreadsheet engine — this is what creates window.spirexls.
await import('/node_modules/spire.office/spire.xls.js');
The Spire.*.Wasm.zip archives and the _framework folder must be reachable from the site root. The runtime resolves them against the document URL rather than against the module that performed the import, so in a Vite or Create React App project they have to sit in public/. The process.env.PUBLIC_URL prefix shown in React-based setups is a Create React App convention, not a browser standard — adjust the base path to match your build tool if you are not using CRA. If the archives are missing, the browser logs WebAssembly.compile(): expected magic word — the dev server has answered the archive request with index.html.
Everything then hangs off one global:
const xls = window.spirexls;
In the current package setup used by this tutorial, the spreadsheet API is exposed through window.spirexls. Use that global after the runtime has been initialized. Older releases exposed it as window.wasmModule.spirexls; if you are working with a different package version, check which global is available.
You're now ready to generate Excel files.
Create a Basic Excel File in JavaScript
Let's build a sales report. We'll create a workbook, add a worksheet, write product data into cells, and save the result as an XLSX file that downloads automatically.
async function createExcelFile() {
    const xls = window.spirexls;
    if (!xls) {
        console.error('Spire.XLS is not initialized.');
        return;
    }

    // A fresh Workbook() already contains three blank worksheets, so clear them
    // and add the single sheet this report needs.
    const workbook = new xls.Workbook();
    workbook.Worksheets.Clear();
    const sheet = workbook.Worksheets.Add("Sales Report");

    // Sample data: product sales
    const data = [
        ["Product", "Quantity", "Price"],
        ["Laptop", 10, 999.99],
        ["Mouse", 50, 24.99],
        ["Keyboard", 30, 59.99],
        ["Monitor", 15, 329.99]
    ];

    // Write data to cells
    for (let row = 0; row < data.length; row++) {
        for (let col = 0; col < data[row].length; col++) {
            const cell = sheet.Range.get({ row: row + 1, column: col + 1 });
            if (typeof data[row][col] === "string") {
                cell.Text = data[row][col];
            } else {
                cell.NumberValue = data[row][col];
            }
        }
    }

    // Save to the virtual file system, read the bytes, download, then dispose
    const fileName = "SalesReport.xlsx";
    workbook.SaveToFile({
        fileName: fileName,
        version: xls.ExcelVersion.Version2016
    });

    const fileData = window.dotnetRuntime.Module.FS.readFile(fileName);
    const blob = new Blob([fileData], {
        type: "application/vnd.openxmlformats-officedocument.spreadsheetml.sheet"
    });
    const url = URL.createObjectURL(blob);
    const a = document.createElement("a");
    a.href = url;
    a.download = fileName;
    a.click();
    URL.revokeObjectURL(url);

    workbook.Dispose();
}
Call createExcelFile() and you'll get a SalesReport.xlsx with four product rows plus a header. The workflow is simple: create workbook → write data → save → download.
The following sections extend this example. Each code snippet assumes it is added inside createExcelFile() after the workbook and worksheet have been created.
Write Different Data Types to Excel Cells
Excel distinguishes between text, numbers, dates, and booleans. Getting this wrong leads to files where sorting breaks, formulas return errors, and numbers display as text.
const sheet = workbook.Worksheets.get(0);

// Text — for labels, names, descriptions
sheet.Range.get("A1").Text = "Product Name";

// Number — for anything you'll calculate, sort, or filter
sheet.Range.get("B1").NumberValue = 999.99;

// Date — a real DateTimeValue plus a display format
const dateCell = sheet.Range.get("C1");
dateCell.DateTimeValue = new Date(Date.UTC(2025, 2, 15));
dateCell.NumberFormat = "yyyy-mm-dd";

// Boolean — use BooleanValue, not text
sheet.Range.get("D1").BooleanValue = true;
The most common mistake? Writing cell.Text = "999.99" instead of cell.NumberValue = 999.99. The value looks identical when you open the file, but Excel treats it as text—you can't sum it, average it, or sort it numerically. Always use NumberValue for numbers, DateTimeValue for dates, and BooleanValue for booleans.
Dates need one extra precaution. DateTimeValue preserves the UTC instant represented by the JavaScript Date. Creating a date with local midnight can therefore shift the displayed day in some time zones; use Date.UTC() when you want a specific calendar date to be preserved.
Add Formulas to the Excel Worksheet
Formulas make your generated file a real spreadsheet, not just a data dump. Let's add a Total column that calculates Quantity × Price for each row, plus a grand total at the bottom:
// Add "Total" header
sheet.Range.get({ row: 1, column: 4 }).Text = "Total";

// Per-row formula: Total = Quantity × Price
for (let i = 2; i <= 5; i++) {
    sheet.Range.get({ row: i, column: 4 }).Formula = `=B${i}*C${i}`;
}

// Grand total row
sheet.Range.get({ row: 6, column: 1 }).Text = "Total";
sheet.Range.get({ row: 6, column: 2 }).Formula = "=SUM(B2:B5)";
sheet.Range.get({ row: 6, column: 4 }).Formula = "=SUM(D2:D5)";

// Evaluate the formulas once, so their results are written into the file.
workbook.CalculateAllValue();
Call workbook.CalculateAllValue() before saving when you need the generated workbook to contain calculated formula results. This is useful for viewers or applications that rely on cached values instead of recalculating formulas on open.
For a comprehensive guide to Excel functions and formula operations, see Insert or Read Functions and Formulas in Excel Worksheets with JavaScript in React.
Format the Generated Excel File
A spreadsheet with raw data works, but a formatted spreadsheet communicates. Let's turn our sales report into something you'd actually send to a stakeholder:
// Bold, colored header row
const header = sheet.Range.get("A1:D1");
header.Style.Font.IsBold = true;
header.Style.Font.Size = 12;
header.Style.Color = xls.Color.get_LightSkyBlue();

// Currency format for Price and Total columns
for (let i = 2; i <= 5; i++) {
    sheet.Range.get({ row: i, column: 3 }).NumberFormat = "$#,##0.00";
    sheet.Range.get({ row: i, column: 4 }).NumberFormat = "$#,##0.00";
}

// Set column widths explicitly
[26, 10, 12, 12].forEach((width, i) => {
    sheet.Columns.get(i).ColumnWidth = width;
});

// Clean borders
const usedRange = sheet.Range.get("A1:D6");
usedRange.Borders.LineStyle = xls.LineStyleType.Thin;
usedRange.Borders.Color = xls.Color.get_LightSteelBlue();
Two details are worth knowing here. sheet.Columns.get(i) and sheet.Rows.get(i) are 0-based and use get, unlike the get_Item that other collections expose. And in the tested browser setup, AutoFitColumn requires a font that is not available in the WebAssembly sandbox, so setting ColumnWidth explicitly is more reliable.
The result: a bold blue header, currency-formatted prices, properly sized columns, and clean borders.
For detailed guidance on row and column dimensions, see Set Row Height and Column Width in Excel with JavaScript in React.
Create Multiple Worksheets in an Excel Workbook
Real reports rarely fit on one sheet. A sales report might have a summary on the first tab, product details on the second, and monthly breakdowns on the third.
workbook.Worksheets.Clear();
const summarySheet = workbook.Worksheets.Add("Summary");
const productsSheet = workbook.Worksheets.Add("Products");
const monthlySheet = workbook.Worksheets.Add("Monthly Data");

// Products sheet — write actual data so cross-sheet formulas work
productsSheet.Range.get("A1").Text = "Product";
productsSheet.Range.get("B1").Text = "Quantity";
productsSheet.Range.get("C1").Text = "Price";
productsSheet.Range.get("D1").Text = "Total";

const products = [
    ["Laptop", 10, 999.99],
    ["Mouse", 50, 24.99],
    ["Keyboard", 30, 59.99],
    ["Monitor", 15, 329.99]
];

for (let i = 0; i < products.length; i++) {
    const row = i + 2;
    productsSheet.Range.get({ row: row, column: 1 }).Text = products[i][0];
    productsSheet.Range.get({ row: row, column: 2 }).NumberValue = products[i][1];
    productsSheet.Range.get({ row: row, column: 3 }).NumberValue = products[i][2];
    productsSheet.Range.get({ row: row, column: 4 }).Formula = `=B${row}*C${row}`;
}

// Summary sheet with cross-sheet reference
summarySheet.Range.get("A1").Text = "Sales Summary";
summarySheet.Range.get("A1").Style.Font.IsBold = true;
summarySheet.Range.get("A2").Text = "Total Products";
summarySheet.Range.get("B2").NumberValue = 4;
summarySheet.Range.get("A3").Text = "Total Revenue";
summarySheet.Range.get("B3").Formula = "=SUM(Products!D2:D5)";
Each Worksheets.Add(name) returns the sheet it just created, in the order the calls are made, so the tab order matches the code order. Notice the cross-sheet formula: =SUM(Products!D2:D5) on the Summary sheet references the Total column on the Products sheet. Excel handles this automatically when the file opens—no extra code needed.
For more on worksheet management — adding, removing, and reordering sheets — see Add, Remove, and Move Excel Worksheets with JavaScript in React.
Save and Download the XLSX File in the Browser
Once your workbook is ready, Spire.XLS saves it to a WebAssembly virtual file system. You then read the file data, convert it to a Blob, and trigger a download:
workbook.SaveToFile({
    fileName: "Report.xlsx",
    version: xls.ExcelVersion.Version2016
});

const fileData = window.dotnetRuntime.Module.FS.readFile("Report.xlsx");
const blob = new Blob([fileData], {
    type: "application/vnd.openxmlformats-officedocument.spreadsheetml.sheet"
});
const url = URL.createObjectURL(blob);
const a = document.createElement("a");
a.href = url;
a.download = "Report.xlsx";
a.click();
URL.revokeObjectURL(url);

workbook.Dispose();
Always call workbook.Dispose() after the download to free memory—especially in apps where users generate multiple files in a session. The workbook itself lives in the WebAssembly heap until you do, and that heap is not reclaimed by the browser's garbage collector.
Looking for React integration or HTML table export? Check out our guide to downloading and exporting Excel files in JavaScript & React.
Putting It Together: A Formatted Sales Report
The snippets above build a workbook one concern at a time. Here they are in a single function: a styled worksheet with zebra banding and currency formats, formula-driven revenue and share columns, a column chart, and a second worksheet that rolls the numbers up.
/**
 * Build a formatted sales report workbook in the browser and download it as
 * SalesReport.xlsx.
 *
 * The layout is driven by `products` below — swap it for form input, an API
 * response or component state and nothing else needs to change.
 */
async function createExcelReport() {
  // spire.office 11.7.0 exposes Spire.XLS as `window.spirexls`. Older builds
  // hung it off `window.wasmModule.spirexls`; that global no longer exists.
  const xls = window.spirexls;
  if (!xls) throw new Error('Spire.XLS is not ready yet');

  // [product, units sold, unit price] — revenue and share are derived by formula
  const products = [
    ['Atlas 14 Ultrabook', 42, 1249.0],
    ['Orbit Wireless Mouse', 380, 24.99],
    ['Vertex Mechanical Keyboard', 165, 89.5],
    ['Lumen 27 4K Monitor', 74, 429.0],
    ['Halo USB-C Dock', 210, 139.0],
    ['Pulse ANC Headset', 128, 199.0],
  ];
  const FIRST = 5; // first data row
  const TOTAL = FIRST + products.length; // total row

  const wb = new xls.Workbook();
  wb.Worksheets.Clear();
  const sheet = wb.Worksheets.Add('Sales Report');

  const at = (a) => sheet.Range.get(a);
  const cell = (row, col) => sheet.Range.get({ row: row, column: col });
  const paint = (a, colour) => {
    at(a).Style.Color = colour;
  };

  // ── Sizing ── explicit widths (AutoFitColumn is unreliable in the WASM sandbox)
  [34, 9, 13, 14, 9].forEach((w, i) => {
    sheet.Columns.get(i).ColumnWidth = w;
  });
  sheet.Rows.get(0).RowHeight = 34; // title
  sheet.Rows.get(1).RowHeight = 20; // subtitle
  sheet.Rows.get(2).RowHeight = 8; // spacer
  sheet.Rows.get(3).RowHeight = 24; // header

  // ── Title band ── merge first, then style the whole merged area
  at('A1:E1').Merge();
  cell(1, 1).Text = 'Sales Report — Q3 2026';
  paint('A1:E1', xls.Color.get_DarkBlue());
  at('A1:E1').Style.Font.Color = xls.Color.get_White();
  at('A1:E1').Style.Font.IsBold = true;
  at('A1:E1').Style.Font.Size = 15;
  at('A1:E1').Style.VerticalAlignment = xls.VerticalAlignType.Center;

  at('A2:E2').Merge();
  cell(2, 1).Text = 'Region: West · Period: 1 Jul – 30 Sep 2026 · Amounts in USD';
  paint('A2:E2', xls.Color.get_DarkBlue());
  at('A2:E2').Style.Font.Color = xls.Color.get_LightSteelBlue();
  at('A2:E2').Style.Font.Size = 9.5;
  at('A2:E2').Style.VerticalAlignment = xls.VerticalAlignType.Center;

  // ── Header row ───────────────────────────────────────────────────────────
  ['Product', 'Units', 'Unit Price', 'Revenue', 'Share'].forEach((label, i) => {
    cell(4, i + 1).Text = label;
  });
  paint('A4:E4', xls.Color.get_LightSteelBlue());
  at('A4:E4').Style.Font.Color = xls.Color.get_DarkBlue();
  at('A4:E4').Style.Font.IsBold = true;
  at('A4:E4').Style.Font.Size = 10.5;
  at('A4:E4').Style.HorizontalAlignment = xls.HorizontalAlignType.Center;
  at('A4:E4').Style.VerticalAlignment = xls.VerticalAlignType.Center;

  // ── Data rows ── numbers go in as NumberValue, never as text
  products.forEach(([name, units, price], i) => {
    const r = FIRST + i;
    cell(r, 1).Text = name;
    cell(r, 2).NumberValue = units;
    cell(r, 3).NumberValue = price;
    cell(r, 4).Formula = `=B${r}*C${r}`;
    cell(r, 5).Formula = `=D${r}/$D${TOTAL}`; // share of the grand total
    sheet.Rows.get(r - 1).RowHeight = 20;
    if (i % 2) paint(`A${r}:E${r}`, xls.Color.get_WhiteSmoke()); // zebra banding
  });

  // ── Total row ────────────────────────────────────────────────────────────
  cell(TOTAL, 1).Text = 'Total';
  [2, 4, 5].forEach((col) => {
    const letter = String.fromCharCode(64 + col);
    cell(TOTAL, col).Formula = `=SUM(${letter}${FIRST}:${letter}${TOTAL - 1})`;
  });
  paint(`A${TOTAL}:E${TOTAL}`, xls.Color.get_LightSkyBlue());
  at(`A${TOTAL}:E${TOTAL}`).Style.Font.IsBold = true;
  sheet.Rows.get(TOTAL - 1).RowHeight = 22;

  // ── Number formats and borders ───────────────────────────────────────────
  at(`B${FIRST}:B${TOTAL}`).NumberFormat = '#,##0';
  at(`C${FIRST}:D${TOTAL}`).NumberFormat = '$#,##0.00';
  at(`E${FIRST}:E${TOTAL}`).NumberFormat = '0.0%';

  const table = at(`A4:E${TOTAL}`);
  table.Borders.LineStyle = xls.LineStyleType.Thin;
  table.Borders.Color = xls.Color.get_LightSteelBlue();
  at(`A${TOTAL}:E${TOTAL}`).Borders.get_Item(xls.BordersLineType.EdgeTop).LineStyle =
    xls.LineStyleType.Medium;

  // ── Chart ── build the series by hand (DataRange would mix units)
  const chart = sheet.Charts.Add();
  chart.ChartType = xls.ExcelChartType.ColumnClustered;
  chart.LeftColumn = 6;
  chart.TopRow = 3;
  chart.RightColumn = 13;
  chart.BottomRow = 21;
  const serie = chart.Series.Add();
  serie.CategoryLabels = at(`A${FIRST}:A${TOTAL - 1}`);
  serie.Values = at(`D${FIRST}:D${TOTAL - 1}`);
  serie.Name = 'Revenue';
  chart.ChartTitleArea.Text = 'Revenue by product';
  chart.HasLegend = false;
  chart.PrimaryValueAxis.NumberFormat = '$#,##0';

  // ── Sheet chrome ──
  sheet.FreezePanes(FIRST, 1);
  sheet.GridLinesVisible = false;
  sheet.TabColor = xls.Color.get_DarkBlue();

  // ── Second worksheet: cross-sheet roll-up ──
  const summary = wb.Worksheets.Add('Summary');
  summary.Columns.get(0).ColumnWidth = 26;
  summary.Columns.get(1).ColumnWidth = 18;
  summary.Rows.get(0).RowHeight = 30;
  summary.Rows.get(1).RowHeight = 18;
  summary.Rows.get(3).RowHeight = 22;

  const band = (a, text, size) => {
    summary.Range.get(a).Merge();
    summary.Range.get(a.split(':')[0]).Text = text;
    summary.Range.get(a).Style.Color = xls.Color.get_DarkBlue();
    summary.Range.get(a).Style.Font.Color = xls.Color.get_White();
    summary.Range.get(a).Style.Font.IsBold = true;
    summary.Range.get(a).Style.Font.Size = size;
    summary.Range.get(a).Style.VerticalAlignment = xls.VerticalAlignType.Center;
  };
  band('A1:B1', 'Executive Summary', 14);
  band('A2:B2', 'Sales Report · Q3 2026', 9.5);

  ['Metric', 'Value'].forEach((label, i) => {
    summary.Range.get({ row: 4, column: i + 1 }).Text = label;
  });
  summary.Range.get('A4:B4').Style.Color = xls.Color.get_LightSteelBlue();
  summary.Range.get('A4:B4').Style.Font.Color = xls.Color.get_DarkBlue();
  summary.Range.get('A4:B4').Style.Font.IsBold = true;

  [
    ['Total revenue', "='Sales Report'!D" + TOTAL, '$#,##0.00'],
    ['Units shipped', "='Sales Report'!B" + TOTAL, '#,##0'],
    ['Average unit price', `='Sales Report'!D${TOTAL}/'Sales Report'!B${TOTAL}`, '$#,##0.00'],
  ].forEach(([label, formula, format], i) => {
    summary.Range.get({ row: 5 + i, column: 1 }).Text = label;
    const value = summary.Range.get({ row: 5 + i, column: 2 });
    value.Formula = formula;
    value.NumberFormat = format;
    value.Style.HorizontalAlignment = xls.HorizontalAlignType.Right;
    if (i % 2) summary.Range.get(`A${5 + i}:B${5 + i}`).Style.Color = xls.Color.get_WhiteSmoke();
  });

  // Date — use Date.UTC to avoid timezone shift
  summary.Range.get('A8').Text = 'Report date';
  const reportDate = summary.Range.get('B8');
  reportDate.DateTimeValue = new Date(Date.UTC(2026, 8, 28));
  reportDate.NumberFormat = 'yyyy-mm-dd';
  reportDate.Style.HorizontalAlignment = xls.HorizontalAlignType.Right;

  const kpis = summary.Range.get('A4:B8');
  kpis.Borders.LineStyle = xls.LineStyleType.Thin;
  kpis.Borders.Color = xls.Color.get_LightSteelBlue();
  summary.GridLinesVisible = false;
  summary.TabColor = xls.Color.get_LightSteelBlue();

  // ── Save, then release ──
  wb.CalculateAllValue();
  const fileName = 'SalesReport.xlsx';
  wb.SaveToFile({ fileName: fileName, version: xls.ExcelVersion.Version2016 });

  const fileData = window.dotnetRuntime.Module.FS.readFile(fileName);
  const blob = new Blob([fileData], {
    type: 'application/vnd.openxmlformats-officedocument.spreadsheetml.sheet',
  });
  const url = URL.createObjectURL(blob);
  Object.assign(document.createElement('a'), { href: url, download: fileName }).click();
  URL.revokeObjectURL(url);

  wb.Dispose(); // free the WASM heap — one workbook per generation cycle
}
The layout follows the data. Replace the products array with a response from your own API and everything else — totals, share percentages, the chart range, the summary roll-up — keeps working, because they are all expressed as formulas or derived ranges rather than hard-coded values.
For more chart types and configuration options, see Create Excel Charts with JavaScript in React.
Create an Excel File from CSV Data
You can load tabular data from a CSV file into a worksheet and save the result as XLSX. The resulting workbook can then be formatted or extended with formulas and additional worksheets:
// The library reads from its own virtual file system, so the CSV has to be
// there before you can load it — written from a string here, from the bytes of
// a File object in a real application.
const csv = "Product,Quantity,Price\nLaptop,10,999.99\nMouse,50,24.99\nKeyboard,30,59.99";
window.dotnetRuntime.Module.FS.writeFile("data.csv", new TextEncoder().encode(csv));

workbook.LoadFromFile("data.csv", ",");
workbook.SaveToFile({
    fileName: "ConvertedFromCSV.xlsx",
    version: xls.ExcelVersion.Version2016
});
The imported sheet is named after the file (data), so Worksheets.get(0) picks it up.
The separator is a required second argument. LoadFromFile("data.csv") on its own is rejected with This is not a structured storage file, because the single-argument overload expects a structured format such as .xlsx or .xls and does not sniff CSV.
There is a second catch: the CSV importer writes every field as text. A quantity column arrives as "10" rather than 10, which means it cannot be summed or sorted numerically — the exact problem described earlier in this tutorial. Convert the columns you need before saving:
const csvSheet = workbook.Worksheets.get(0);

// The importer leaves every field as text — coerce each numeric column.
// Columns 2 and 3 hold Quantity and Price; both arrive as "10" and "999.99".
for (let row = 2; row <= 4; row++) {
    [2, 3].forEach((column) => {
        const cell = csvSheet.Range.get({ row: row, column: column });
        if (cell.Text !== "") {
            cell.NumberValue = Number(cell.Text);
        }
    });
}
For a full guide on converting between CSV and Excel formats, see our CSV to Excel conversion tutorial.
Create an XLS File Instead of XLSX
If your application needs to generate the legacy .xls format instead of .xlsx, change the version parameter:
workbook.SaveToFile({
    fileName: "Report.xls",
    version: xls.ExcelVersion.Version97to2003
});
The enum member is Version97to2003 — there is no Version97. Keep charts in XLSX; the tested XLS writer fails when chart font metrics are required.
XLSX (Excel 2007+) is the recommended format for new applications. XLS (Excel 97–2003) is only necessary when backward compatibility is required.
Common Problems
window.wasmModule is undefined. Older samples read the spreadsheet API from window.wasmModule.spirexls. Current releases install it directly on window.spirexls and leave wasmModule undefined, so the very first access throws. Check window.spirexls instead.
WASM module not initialized. If window.spirexls is undefined, the runtime hasn't finished loading. Show a loading indicator and wait for initialization to complete before attempting any Excel operations.
Auto-fit throws a font error. AutoFitColumn and AutoFitRow need a system font to measure text, and the WebAssembly sandbox has none. They fail with Cannot found font(Arial) installed on the system. Compute or hard-code your column widths with sheet.Columns.get(i).ColumnWidth.
Numbers stored as text. Using cell.Text = "100" instead of cell.NumberValue = 100 breaks sorting and calculations. This is the most common issue developers encounter when writing Excel files in JavaScript, and CSV import triggers it automatically—always use NumberValue for numeric data.
An "Evaluation Warning" sheet appears. When using the evaluation build without a valid license, Spire.XLS adds an evaluation sheet to the saved workbook. This sheet is recreated on save, so removing it programmatically is not a reliable workaround. Apply a license key to prevent it.
Memory leaks in long-running apps. Call workbook.Dispose() after every generation cycle. In single-page applications, undisposed workbooks accumulate memory and degrade performance over time.
FAQ
Can JavaScript create Excel files without Microsoft Excel?
Yes. Spire.XLS for JavaScript runs entirely in the browser via WebAssembly. No Microsoft Excel or server-side Office installation is required to generate XLSX files.
Can JavaScript create XLSX files directly in the browser?
Yes. All spreadsheet operations happen client-side. The file is saved to a virtual file system, then downloaded as a Blob—no backend server needed.
What's the difference between XLS and XLSX?
XLSX (Excel 2007 and later) is the modern XML-based format, recommended for new applications. XLS (Excel 97–2003) is the legacy binary format, useful for older system compatibility.
Conclusion
Creating Excel files in JavaScript doesn't require a backend server or Microsoft Excel. With Spire.XLS for JavaScript, you can build workbooks from scratch, write typed data, add formulas, apply formatting, and organize data across multiple sheets—all in the browser.
Start with the basic example above, then layer in formulas and formatting as your needs grow. For React-specific integration and HTML table export, see our dedicated export tutorial.
See Also
Copiar e Reutilizar Páginas PDF entre Documentos com JavaScript
Índice

Montar um PDF refinado a partir de arquivos de origem dispersos é uma tarefa rotineira, mas delicada: uma página de capa precisa ficar na frente de um resumo de projeto, páginas de preços pertencem ao seu contrato, um resumo trimestral reúne gráficos de uma dúzia de relatórios. Fazer isso manualmente significa lidar com vários leitores de PDF e torcer para que a ordem das páginas saia correta, com tamanhos de página incompatíveis complicando ainda mais o problema.
O Spire.PDF for JavaScript transfere toda a operação para o navegador. Com o suporte do WebAssembly, ele carrega, manipula e salva documentos PDF inteiramente no lado do cliente por meio de um sistema de arquivos virtual (VFS), o que significa que nenhum arquivo é enviado a um servidor de backend. Este artigo apresenta quatro técnicas distintas para copiar páginas de PDF entre documentos — três que realocam páginas inteiras e uma que extrai o conteúdo da página como um template reutilizável — com exemplos completos de código React para cada uma.
Para instruções de configuração do projeto e instalação, consulte Integrating Spire.PDF for JavaScript in a React Project. Os exemplos abaixo pressupõem que o Spire.PDF esteja instalado e o módulo WebAssembly tenha sido inicializado.
Quatro Maneiras de Copiar Páginas de PDF em Resumo
Antes de examinar cada método individualmente, a tabela abaixo oferece uma comparação rápida. As três primeiras técnicas movem páginas intactas e transferem automaticamente as dimensões, a rotação e as margens da página de origem. A quarta desvincula o conteúdo da geometria da página, dando a você controle total sobre o tamanho da página de destino e a posição de desenho.
| Método | Chamada de API | O Que É Copiado | Tamanho da Página | Caso de Uso Típico |
|---|---|---|---|---|
| Inserir uma única página | InsertPage |
Uma página em uma posição que você escolher | Herdado da origem | Adicionar uma capa ou página de título na frente |
| Inserir um intervalo de páginas | InsertPageRange |
Um bloco consecutivo de páginas | Herdado da origem | Anexar uma seção específica, como tabelas de preços |
| Anexar um documento inteiro | AppendPage |
Todas as páginas do documento de origem | Herdado da origem | Concatenar documentos completos de ponta a ponta |
| Desenhar o conteúdo da página como template | CreateTemplate + DrawTemplate |
Apenas o conteúdo da página, desenhado em qualquer página | Você decide o tamanho de destino | Reutilizar conteúdo em tamanhos de página diferentes ou repeti-lo várias vezes |
Os três primeiros métodos são simples movimentações de páginas — escolha a origem, escolha o destino, e a biblioteca faz o resto. A abordagem com template é mais avançada e abre possibilidades que a simples cópia de páginas não consegue atender, como dimensionar o conteúdo para caber em um tamanho de página diferente ou carimbar o mesmo conteúdo em várias páginas. Abordaremos primeiro os três métodos de movimentação de páginas e, em seguida, exploraremos a técnica de template em profundidade.
Copiar uma Única Página para uma Posição Específica
O mais preciso dos quatro métodos, PdfDocument.InsertPage, copia uma página de um documento de origem e a coloca em um índice exato no destino. O parâmetro resultPageIndex controla onde a cópia é inserida: passe 0 para colocá-la no início, passe a contagem atual de páginas do destino para anexá-la, ou forneça qualquer índice intermediário para inseri-la nessa posição. Omita resultPageIndex completamente e a página será colocada no final por padrão.
function App() {
  const copyPageAtPosition = async () => {
    // Get the Spire.PDF WASM module
    const pdfModule = window.wasmModule?.spirepdf;

    // Check whether the module is ready
    if (!pdfModule) {
      alert('Spire.PDF is not ready yet');
      return;
    }

    // Load both the source and the target document into the VFS
    const sourceFileName = 'SourceDocument.pdf';
    const targetFileName = 'TargetDocument.pdf';
    await window.spire.FetchFileToVFS(sourceFileName, "", `${process.env.PUBLIC_URL}/data/`);
    await window.spire.FetchFileToVFS(targetFileName, "", `${process.env.PUBLIC_URL}/data/`);

    // Load the two documents
    const sourceDoc = new pdfModule.PdfDocument();
    sourceDoc.LoadFromFile(sourceFileName);
    const targetDoc = new pdfModule.PdfDocument();
    targetDoc.LoadFromFile(targetFileName);

    // Copy page 1 of the source document to the front of the target document
    // pageIndex comes from the source document, resultPageIndex is where the copy lands
    targetDoc.InsertPage({ ldDoc: sourceDoc, pageIndex: 0, resultPageIndex: 0 });

    // Save the result document
    const outputFileName = 'CopyPageAtPosition.pdf';
    targetDoc.SaveToFile(outputFileName);
    sourceDoc.Close();
    targetDoc.Close();

    // Read the generated file from the VFS and trigger the download
    const fileArray = window.dotnetRuntime.Module.FS.readFile(outputFileName);
    const blob = new Blob([fileArray], { type: 'application/pdf' });
    const url = URL.createObjectURL(blob);
    const a = document.createElement('a');
    a.href = url;
    a.download = outputFileName;
    a.click();
    URL.revokeObjectURL(url);
  };

  return (
    <div style={{ textAlign: 'center', height: '300px' }}>
      <h1>Copy Page at Position</h1>
      <button onClick={copyPageAtPosition}>
        Start
      </button>
    </div>
  );
}

export default App;
Entre todos os quatro métodos de cópia,
resultPageIndexé o único parâmetro que permite escolher o ponto de inserção. Defini-lo como 0 coloca a página em primeiro lugar, 1 a coloca em segundo, e passar a contagem atual de páginas do documento de destino produz o mesmo efeito que anexar.
O documento de destino cresce de duas para três páginas, com a primeira página do documento de origem agora ocupando a posição inicial:
Copiar um Intervalo de Páginas para o Final
Quando você precisa de mais de uma página, mas menos do que um documento inteiro, PdfDocument.InsertPageRange copia um bloco contíguo de páginas definido por um índice inicial e final. Diferentemente de InsertPage, este método aceita argumentos posicionais em vez de um objeto de opções, e sempre anexa as páginas copiadas ao final do destino — não há parâmetro para escolher a posição de inserção. O índice final é inclusivo, portanto passar (sourceDoc, 1, 2) copia as páginas 2 e 3 (com base zero).
function App() {
  const appendPageRange = async () => {
    // Get the Spire.PDF WASM module
    const pdfModule = window.wasmModule?.spirepdf;

    // Check whether the module is ready
    if (!pdfModule) {
      alert('Spire.PDF is not ready yet');
      return;
    }

    // Load both the source and the target document into the VFS
    const sourceFileName = 'SourceDocument.pdf';
    const targetFileName = 'TargetDocument.pdf';
    await window.spire.FetchFileToVFS(sourceFileName, "", `${process.env.PUBLIC_URL}/data/`);
    await window.spire.FetchFileToVFS(targetFileName, "", `${process.env.PUBLIC_URL}/data/`);

    // Load the two documents
    const sourceDoc = new pdfModule.PdfDocument();
    sourceDoc.LoadFromFile(sourceFileName);
    const targetDoc = new pdfModule.PdfDocument();
    targetDoc.LoadFromFile(targetFileName);

    // Append pages 2 to 3 of the source document to the end of the target document
    // Note: these are positional arguments, not an object; endIndex is inclusive
    targetDoc.InsertPageRange(sourceDoc, 1, 2);

    // Save the result document
    const outputFileName = 'CopyPageRange.pdf';
    targetDoc.SaveToFile(outputFileName);
    sourceDoc.Close();
    targetDoc.Close();

    // Read the generated file from the VFS and trigger the download
    const fileArray = window.dotnetRuntime.Module.FS.readFile(outputFileName);
    const blob = new Blob([fileArray], { type: 'application/pdf' });
    const url = URL.createObjectURL(blob);
    const a = document.createElement('a');
    a.href = url;
    a.download = outputFileName;
    a.click();
    URL.revokeObjectURL(url);
  };

  return (
    <div style={{ textAlign: 'center', height: '300px' }}>
      <h1>Copy Page Range</h1>
      <button onClick={appendPageRange}>
        Copy pages 2-3
      </button>
    </div>
  );
}

export default App;
O documento de destino ganha duas páginas adicionais, passando de um total de duas para quatro:
Anexar um Documento Inteiro
Para o caso mais simples — mover todas as páginas de um documento para outro — PdfDocument.AppendPage elimina a necessidade de calcular índices. Passe o objeto do documento de origem e todas as suas páginas serão anexadas ao destino em sua sequência original. Para concatenar vários documentos, chame AppendPage repetidamente com cada documento de origem, um por vez.
function App() {
  const appendWholeDocument = async () => {
    // Get the Spire.PDF WASM module
    const pdfModule = window.wasmModule?.spirepdf;

    // Check whether the module is ready
    if (!pdfModule) {
      alert('Spire.PDF is not ready yet');
      return;
    }

    // Load both the source and the target document into the VFS
    const sourceFileName = 'SourceDocument.pdf';
    const targetFileName = 'TargetDocument.pdf';
    await window.spire.FetchFileToVFS(sourceFileName, "", `${process.env.PUBLIC_URL}/data/`);
    await window.spire.FetchFileToVFS(targetFileName, "", `${process.env.PUBLIC_URL}/data/`);

    // Load the two documents
    const sourceDoc = new pdfModule.PdfDocument();
    sourceDoc.LoadFromFile(sourceFileName);
    const targetDoc = new pdfModule.PdfDocument();
    targetDoc.LoadFromFile(targetFileName);

    // Use AppendPage when the whole document has to be copied; all pages are appended in order
    targetDoc.AppendPage({ doc: sourceDoc });

    // Save the result document
    const outputFileName = 'CopyAllPages.pdf';
    targetDoc.SaveToFile(outputFileName);
    sourceDoc.Close();
    targetDoc.Close();

    // Read the generated file from the VFS and trigger the download
    const fileArray = window.dotnetRuntime.Module.FS.readFile(outputFileName);
    const blob = new Blob([fileArray], { type: 'application/pdf' });
    const url = URL.createObjectURL(blob);
    const a = document.createElement('a');
    a.href = url;
    a.download = outputFileName;
    a.click();
    URL.revokeObjectURL(url);
  };

  return (
    <div style={{ textAlign: 'center', height: '300px' }}>
      <h1>Copy Whole Document</h1>
      <button onClick={appendWholeDocument}>
        Start
      </button>
    </div>
  );
}

export default App;
Todas as quatro páginas do documento de origem se juntam ao destino, expandindo-o de duas para seis páginas:
Copiar o Conteúdo da Página com um Template
Os três métodos acima tratam uma página como uma unidade indivisível: ela se move com seu tamanho, rotação e margens preservados. Mas a montagem de documentos no mundo real frequentemente exige um controle mais refinado — colocar o conteúdo de uma página em uma página de tamanho diferente, ampliá-lo ou reduzi-lo, ou carimbar o mesmo conteúdo em várias páginas. É aqui que PdfPageBase.CreateTemplate entra em cena.
CreateTemplate extrai o conteúdo visual de uma página para um objeto PdfTemplate. Em seguida, você desenha esse template em qualquer página usando Canvas.DrawTemplate, especificando a posição e o tamanho da área de desenho. O template é desvinculado da geometria da página original, então você pode renderizá-lo em qualquer escala, em qualquer posição, em qualquer tamanho de página — e pode desenhar o mesmo template quantas vezes precisar.
Isso torna os templates especialmente úteis para cenários como:
- Colocar o conteúdo de uma capa A5 centralizado em uma página A4 sem borda branca
- Criar uma marca d'água ou padrão de fundo a partir de uma página existente
- Duplicar o layout de um formulário em várias páginas novas, em escalas diferentes
function App() {
  const copyPageWithTemplate = async () => {
    // Get the Spire.PDF WASM module
    const pdfModule = window.wasmModule?.spirepdf;

    // Check whether the module is ready
    if (!pdfModule) {
      alert('Spire.PDF is not ready yet');
      return;
    }

    // Load the PDF file to work on into the VFS
    const inputFileName = 'SourceDocument.pdf';
    await window.spire.FetchFileToVFS(inputFileName, "", `${process.env.PUBLIC_URL}/data/`);

    // Load the document
    const doc = new pdfModule.PdfDocument();
    doc.LoadFromFile(inputFileName);

    // Take the page to be reused and turn it into a template: read the content once, draw it many times
    const sourcePage = doc.Pages.get_Item(0);
    const template = sourcePage.CreateTemplate();

    // First placement: insert an A4 page at position 2, a different size from the source,
    // and draw the content scaled to 297.6 x 421.6 at (80, 80)
    const page1 = doc.Pages.Insert(1, new pdfModule.SizeF(595.0, 842.0), new pdfModule.PdfMargins({ margin: 0.0 }));
    page1.Canvas.DrawTemplate(template, new pdfModule.PointF(80.0, 80.0), new pdfModule.SizeF(297.6, 421.6));

    // Second placement: insert another A4 page, drawing the same template smaller in the lower right
    const page2 = doc.Pages.Insert(2, new pdfModule.SizeF(595.0, 842.0), new pdfModule.PdfMargins({ margin: 0.0 }));
    page2.Canvas.DrawTemplate(template, new pdfModule.PointF(320.0, 460.0), new pdfModule.SizeF(200.0, 283.3));

    // Save the result document
    const outputFileName = 'CopyPageWithTemplate.pdf';
    doc.SaveToFile(outputFileName);
    doc.Close();

    // Read the generated file from the VFS and trigger the download
    const fileArray = window.dotnetRuntime.Module.FS.readFile(outputFileName);
    const blob = new Blob([fileArray], { type: 'application/pdf' });
    const url = URL.createObjectURL(blob);
    const a = document.createElement('a');
    a.href = url;
    a.download = outputFileName;
    a.click();
    URL.revokeObjectURL(url);
  };

  return (
    <div style={{ textAlign: 'center', height: '300px' }}>
      <h1>Copy Page with Template</h1>
      <button onClick={copyPageWithTemplate}>
        Start
      </button>
    </div>
  );
}

export default App;
Alguns detalhes que vale a pena observar sobre DrawTemplate:
- Argumento de tamanho: Quando o terceiro argumento (tamanho de destino) é omitido, o template é renderizado em suas dimensões originais, sem escala. Em uma página de destino maior, o conteúdo ocupa apenas uma parte do espaço disponível.
- Criação de página: As dimensões e margens da página de destino vêm de
Pages.Insert, não do template. No exemplo, margens zero em todos os lados fazem a origem do desenho coincidir com o canto superior esquerdo da página. - Múltiplos desenhos: O mesmo objeto
templateé desenhado duas vezes em duas páginas separadas, em posições e escalas diferentes, demonstrando a capacidade de reutilização.
O conteúdo da página 1 agora aparece em duas páginas A4 recém-inseridas, em escalas e posições diferentes, fazendo o documento crescer de quatro para seis páginas:
Perguntas Frequentes
Criar uma página com new PdfMargins(0.0) gera Arg_NullReferenceException
Causa: O construtor de PdfMargins interpreta um argumento numérico simples como um identificador interno, e não como um valor de margem. Portanto, chamar new pdfModule.PdfMargins(0.0) produz um objeto que não representa margens válidas — acessar sua propriedade Left ou Top dispara Arg_NullReferenceException, e passá-lo para a criação de página produz resultados inesperados.
Solução: Sempre passe as margens como um objeto de configuração. Para margens zero uniformes, use { margin: 0.0 }; para valores individuais por lado, especifique cada lado explicitamente:
// Zero margins on all four sides
const margins = new pdfModule.PdfMargins({ margin: 0.0 });

// Or set each side separately
const custom = new pdfModule.PdfMargins({ left: 20.0, top: 20.0, right: 20.0, bottom: 20.0 });
Um erro de intervalo fora dos limites ou invertido é lançado ao copiar páginas
Causa: Os índices de página são com base zero, e endIndex em InsertPageRange é inclusivo. O intervalo válido, portanto, vai de 0 a Pages.Count - 1. Fornecer um índice fora desse intervalo gera Index out of range, enquanto definir startIndex maior que endIndex gera The start index is greater then the end index.
Solução: Proteja o limite superior limitando-o em relação a Pages.Count antes de chamar o método:
// To copy pages 2 to 4: start = 1, end = 3, with the page count as the upper bound
const start = 1;
const end = Math.min(3, sourceDoc.Pages.Count - 1);
targetDoc.InsertPageRange(sourceDoc, start, end);
Uma página rotacionada sai com a orientação errada após a cópia
Causa: CreateTemplate() captura o conteúdo desenhado da página, mas não seu ângulo de rotação (a entrada /Rotate). Quando a página de origem possui uma rotação, o sistema de coordenadas do template fica desalinhado com a página de destino — desenhá-lo diretamente coloca o conteúdo fora da área visível, e a cópia resultante tem Rotation igual a 0.
Solução: Para páginas de origem rotacionadas, prefira uma cópia de página inteira para que o ângulo de rotação acompanhe o conteúdo:
// Whole-page copy: the rotation angle comes with the page
targetDoc.InsertPage({ ldDoc: sourceDoc, pageIndex: 0, resultPageIndex: 1 });
Se a abordagem com template for inevitável, limpe temporariamente a rotação da página de origem antes de extrair o template e depois restaure o ângulo original tanto na origem quanto na nova página:
const rotation = sourcePage.Rotation.value;

// Zero it temporarily so the template exports at the page's real coordinates
sourcePage.Rotation = 0;
const newPage = doc.Pages.Insert(1, sourcePage.Size, new pdfModule.PdfMargins({ margin: 0.0 }));
newPage.Canvas.DrawTemplate(sourcePage.CreateTemplate(), new pdfModule.PointF(0.0, 0.0));

// Restore the source page and give the copy the same angle
sourcePage.Rotation = rotation;
newPage.Rotation = rotation;
Para remover a marca d'água de avaliação dos documentos de saída ou desbloquear o acesso completo aos recursos, entre em contato com vendas para obter uma licença temporária de 30 dias.
Veja Também
JavaScript로 문서 간 PDF 페이지 복사 및 재사용
흩어진 원본 파일에서 완성도 높은 PDF를 조립하는 일은 일상적이지만 까다로운 작업입니다. 표지 페이지는 프로젝트 개요서 맨 앞에 있어야 하고, 가격 페이지는 계약서 안에 들어가야 하며, 분기 요약본은 수십 개 보고서의 차트를 하나로 엮어야 합니다. 이 작업을 수작업으로 하면 여러 PDF 리더를 오가며 페이지 순서가 제대로 나오기를 바라야 하고, 페이지 크기가 서로 맞지 않으면 문제가 더 커집니다.
Spire.PDF for JavaScript는 이 모든 작업을 브라우저 안으로 옮깁니다. WebAssembly를 기반으로 하며, 가상 파일 시스템(VFS)을 통해 전적으로 클라이언트 측에서 PDF 문서를 로드하고 조작하고 저장하므로 파일이 백엔드 서버로 업로드되는 일이 전혀 없습니다. 이 글에서는 문서 간에 PDF 페이지를 복사하는 네 가지 기법을 살펴봅니다. 세 가지는 전체 페이지를 이동하는 방법이고, 하나는 페이지 콘텐츠를 재사용 가능한 템플릿으로 추출하는 방법입니다. 각 방법에는 완전한 React 코드 예제가 포함되어 있습니다.
프로젝트 설정 및 설치 지침은 React 프로젝트에서 Spire.PDF for JavaScript 통합하기를 참조하세요. 아래 예제는 Spire.PDF가 설치되어 있고 WebAssembly 모듈이 초기화되었다고 가정합니다.
한눈에 보는 PDF 페이지 복사 네 가지 방법
각 방법을 개별적으로 살펴보기 전에, 아래 표에서 빠르게 비교해 보겠습니다. 처음 세 가지 기법은 페이지를 그대로 이동하며 원본 페이지의 크기, 회전, 여백을 자동으로 이어받습니다. 네 번째는 콘텐츠를 페이지 지오메트리에서 분리하여 대상 페이지 크기와 그리기 위치를 완전히 제어할 수 있게 해줍니다.
| 방법 | API 호출 | 복사되는 내용 | 페이지 크기 | 일반적인 사용 사례 |
|---|---|---|---|---|
| 단일 페이지 삽입 | InsertPage |
선택한 위치에 한 페이지 | 원본에서 상속 | 앞에 표지나 제목 페이지 추가 |
| 페이지 범위 삽입 | InsertPageRange |
연속된 페이지 블록 | 원본에서 상속 | 가격표 같은 특정 섹션 추가 |
| 전체 문서 추가 | AppendPage |
원본 문서의 모든 페이지 | 원본에서 상속 | 전체 문서를 처음부터 끝까지 연결 |
| 페이지 콘텐츠를 템플릿으로 그리기 | CreateTemplate + DrawTemplate |
페이지 콘텐츠만, 모든 페이지에 그려짐 | 대상 크기를 직접 결정 | 다른 페이지 크기에서 콘텐츠를 재사용하거나 여러 번 반복 |
처음 세 가지 방법은 간단한 페이지 이동입니다. 원본을 선택하고 대상을 선택하면 나머지는 라이브러리가 처리합니다. 템플릿 접근 방식은 더 고급이며, 콘텐츠를 다른 페이지 크기에 맞게 조정하거나 동일한 콘텐츠를 여러 페이지에 찍어내는 등 단순 페이지 복사로는 할 수 없는 가능성을 열어줍니다. 먼저 세 가지 페이지 이동 방법을 다룬 다음, 템플릿 기법을 깊이 살펴보겠습니다.
단일 페이지를 특정 위치에 복사
네 가지 방법 중 가장 정밀한 PdfDocument.InsertPage는 원본 문서에서 한 페이지를 복사하여 대상의 정확한 인덱스에 배치합니다. resultPageIndex 매개변수는 복사본이 들어갈 위치를 제어합니다. 0을 전달하면 맨 앞에 추가되고, 대상의 현재 페이지 수를 전달하면 맨 뒤에 추가되며, 그 사이의 임의 인덱스를 전달하면 해당 위치에 삽입됩니다. resultPageIndex를 완전히 생략하면 페이지는 기본적으로 맨 끝에 추가됩니다.
function App() {
  const copyPageAtPosition = async () => {
    // Get the Spire.PDF WASM module
    const pdfModule = window.wasmModule?.spirepdf;

    // Check whether the module is ready
    if (!pdfModule) {
      alert('Spire.PDF is not ready yet');
      return;
    }

    // Load both the source and the target document into the VFS
    const sourceFileName = 'SourceDocument.pdf';
    const targetFileName = 'TargetDocument.pdf';
    await window.spire.FetchFileToVFS(sourceFileName, "", `${process.env.PUBLIC_URL}/data/`);
    await window.spire.FetchFileToVFS(targetFileName, "", `${process.env.PUBLIC_URL}/data/`);

    // Load the two documents
    const sourceDoc = new pdfModule.PdfDocument();
    sourceDoc.LoadFromFile(sourceFileName);
    const targetDoc = new pdfModule.PdfDocument();
    targetDoc.LoadFromFile(targetFileName);

    // Copy page 1 of the source document to the front of the target document
    // pageIndex comes from the source document, resultPageIndex is where the copy lands
    targetDoc.InsertPage({ ldDoc: sourceDoc, pageIndex: 0, resultPageIndex: 0 });

    // Save the result document
    const outputFileName = 'CopyPageAtPosition.pdf';
    targetDoc.SaveToFile(outputFileName);
    sourceDoc.Close();
    targetDoc.Close();

    // Read the generated file from the VFS and trigger the download
    const fileArray = window.dotnetRuntime.Module.FS.readFile(outputFileName);
    const blob = new Blob([fileArray], { type: 'application/pdf' });
    const url = URL.createObjectURL(blob);
    const a = document.createElement('a');
    a.href = url;
    a.download = outputFileName;
    a.click();
    URL.revokeObjectURL(url);
  };

  return (
    <div style={{ textAlign: 'center', height: '300px' }}>
      <h1>Copy Page at Position</h1>
      <button onClick={copyPageAtPosition}>
        Start
      </button>
    </div>
  );
}

export default App;
네 가지 복사 방법 중
resultPageIndex는 삽입 지점을 선택할 수 있는 유일한 매개변수입니다. 0으로 설정하면 페이지가 맨 앞에, 1로 설정하면 두 번째에 위치하며, 대상 문서의 현재 페이지 수를 전달하면 추가하는 것과 같은 효과가 납니다.
대상 문서는 2페이지에서 3페이지로 늘어나고, 원본 문서의 첫 페이지가 맨 앞자리를 차지합니다.
페이지 범위를 끝에 복사
한 페이지보다 많지만 전체 문서보다는 적은 페이지가 필요할 때, PdfDocument.InsertPageRange는 시작 및 끝 인덱스로 정의된 연속된 페이지 블록을 복사합니다. InsertPage와 달리 이 메서드는 옵션 객체가 아니라 위치 인수를 받으며, 복사한 페이지를 항상 대상의 끝에 추가합니다. 삽입 위치를 선택하는 매개변수는 없습니다. 끝 인덱스는 포함되므로 (sourceDoc, 1, 2)를 전달하면 2페이지와 3페이지(0부터 시작)를 복사합니다.
function App() {
  const appendPageRange = async () => {
    // Get the Spire.PDF WASM module
    const pdfModule = window.wasmModule?.spirepdf;

    // Check whether the module is ready
    if (!pdfModule) {
      alert('Spire.PDF is not ready yet');
      return;
    }

    // Load both the source and the target document into the VFS
    const sourceFileName = 'SourceDocument.pdf';
    const targetFileName = 'TargetDocument.pdf';
    await window.spire.FetchFileToVFS(sourceFileName, "", `${process.env.PUBLIC_URL}/data/`);
    await window.spire.FetchFileToVFS(targetFileName, "", `${process.env.PUBLIC_URL}/data/`);

    // Load the two documents
    const sourceDoc = new pdfModule.PdfDocument();
    sourceDoc.LoadFromFile(sourceFileName);
    const targetDoc = new pdfModule.PdfDocument();
    targetDoc.LoadFromFile(targetFileName);

    // Append pages 2 to 3 of the source document to the end of the target document
    // Note: these are positional arguments, not an object; endIndex is inclusive
    targetDoc.InsertPageRange(sourceDoc, 1, 2);

    // Save the result document
    const outputFileName = 'CopyPageRange.pdf';
    targetDoc.SaveToFile(outputFileName);
    sourceDoc.Close();
    targetDoc.Close();

    // Read the generated file from the VFS and trigger the download
    const fileArray = window.dotnetRuntime.Module.FS.readFile(outputFileName);
    const blob = new Blob([fileArray], { type: 'application/pdf' });
    const url = URL.createObjectURL(blob);
    const a = document.createElement('a');
    a.href = url;
    a.download = outputFileName;
    a.click();
    URL.revokeObjectURL(url);
  };

  return (
    <div style={{ textAlign: 'center', height: '300px' }}>
      <h1>Copy Page Range</h1>
      <button onClick={appendPageRange}>
        Copy pages 2-3
      </button>
    </div>
  );
}

export default App;
대상 문서에 두 페이지가 추가되어 총 2페이지에서 4페이지로 늘어납니다.
전체 문서 추가
가장 간단한 경우, 즉 한 문서의 모든 페이지를 다른 문서로 옮기는 작업에는 PdfDocument.AppendPage를 사용하면 인덱스를 계산할 필요가 전혀 없습니다. 원본 문서 객체를 전달하면 모든 페이지가 원래 순서대로 대상에 추가됩니다. 여러 문서를 하나로 연결하려면 각 원본 문서를 차례로 AppendPage에 전달하여 반복 호출하면 됩니다.
function App() {
  const appendWholeDocument = async () => {
    // Get the Spire.PDF WASM module
    const pdfModule = window.wasmModule?.spirepdf;

    // Check whether the module is ready
    if (!pdfModule) {
      alert('Spire.PDF is not ready yet');
      return;
    }

    // Load both the source and the target document into the VFS
    const sourceFileName = 'SourceDocument.pdf';
    const targetFileName = 'TargetDocument.pdf';
    await window.spire.FetchFileToVFS(sourceFileName, "", `${process.env.PUBLIC_URL}/data/`);
    await window.spire.FetchFileToVFS(targetFileName, "", `${process.env.PUBLIC_URL}/data/`);

    // Load the two documents
    const sourceDoc = new pdfModule.PdfDocument();
    sourceDoc.LoadFromFile(sourceFileName);
    const targetDoc = new pdfModule.PdfDocument();
    targetDoc.LoadFromFile(targetFileName);

    // Use AppendPage when the whole document has to be copied; all pages are appended in order
    targetDoc.AppendPage({ doc: sourceDoc });

    // Save the result document
    const outputFileName = 'CopyAllPages.pdf';
    targetDoc.SaveToFile(outputFileName);
    sourceDoc.Close();
    targetDoc.Close();

    // Read the generated file from the VFS and trigger the download
    const fileArray = window.dotnetRuntime.Module.FS.readFile(outputFileName);
    const blob = new Blob([fileArray], { type: 'application/pdf' });
    const url = URL.createObjectURL(blob);
    const a = document.createElement('a');
    a.href = url;
    a.download = outputFileName;
    a.click();
    URL.revokeObjectURL(url);
  };

  return (
    <div style={{ textAlign: 'center', height: '300px' }}>
      <h1>Copy Whole Document</h1>
      <button onClick={appendWholeDocument}>
        Start
      </button>
    </div>
  );
}

export default App;
원본 문서의 네 페이지가 모두 대상에 합쳐져 2페이지에서 6페이지로 늘어납니다.
템플릿으로 페이지 콘텐츠 복사
위의 세 가지 방법은 페이지를 분할할 수 없는 단위로 취급합니다. 페이지는 크기, 회전, 여백이 유지된 채로 이동합니다. 하지만 실제 문서 조립에서는 더 세밀한 제어가 필요한 경우가 많습니다. 페이지 콘텐츠를 다른 크기의 페이지에 배치하거나, 확대/축소하거나, 동일한 콘텐츠를 여러 페이지에 찍어내는 경우가 그렇습니다. 바로 이때 PdfPageBase.CreateTemplate이 등장합니다.
CreateTemplate은 페이지의 시각적 콘텐츠를 PdfTemplate 객체로 추출합니다. 그런 다음 Canvas.DrawTemplate을 사용하여 해당 템플릿을 원하는 페이지에 그리면서 그리기 영역의 위치와 크기를 지정할 수 있습니다. 템플릿은 원본 페이지의 지오메트리에서 분리되므로 어떤 크기로든, 어떤 위치에든, 어떤 페이지 크기에서든 렌더링할 수 있으며, 동일한 템플릿을 필요한 만큼 여러 번 그릴 수 있습니다.
이 덕분에 템플릿은 다음과 같은 시나리오에서 특히 유용합니다.
- 흰색 테두리 없이 A4 페이지에 A5 표지의 콘텐츠를 중앙에 배치
- 기존 페이지에서 워터마크나 배경 패턴 만들기
- 양식 레이아웃을 여러 새 페이지에 다양한 크기로 복제
function App() {
  const copyPageWithTemplate = async () => {
    // Get the Spire.PDF WASM module
    const pdfModule = window.wasmModule?.spirepdf;

    // Check whether the module is ready
    if (!pdfModule) {
      alert('Spire.PDF is not ready yet');
      return;
    }

    // Load the PDF file to work on into the VFS
    const inputFileName = 'SourceDocument.pdf';
    await window.spire.FetchFileToVFS(inputFileName, "", `${process.env.PUBLIC_URL}/data/`);

    // Load the document
    const doc = new pdfModule.PdfDocument();
    doc.LoadFromFile(inputFileName);

    // Take the page to be reused and turn it into a template: read the content once, draw it many times
    const sourcePage = doc.Pages.get_Item(0);
    const template = sourcePage.CreateTemplate();

    // First placement: insert an A4 page at position 2, a different size from the source,
    // and draw the content scaled to 297.6 x 421.6 at (80, 80)
    const page1 = doc.Pages.Insert(1, new pdfModule.SizeF(595.0, 842.0), new pdfModule.PdfMargins({ margin: 0.0 }));
    page1.Canvas.DrawTemplate(template, new pdfModule.PointF(80.0, 80.0), new pdfModule.SizeF(297.6, 421.6));

    // Second placement: insert another A4 page, drawing the same template smaller in the lower right
    const page2 = doc.Pages.Insert(2, new pdfModule.SizeF(595.0, 842.0), new pdfModule.PdfMargins({ margin: 0.0 }));
    page2.Canvas.DrawTemplate(template, new pdfModule.PointF(320.0, 460.0), new pdfModule.SizeF(200.0, 283.3));

    // Save the result document
    const outputFileName = 'CopyPageWithTemplate.pdf';
    doc.SaveToFile(outputFileName);
    doc.Close();

    // Read the generated file from the VFS and trigger the download
    const fileArray = window.dotnetRuntime.Module.FS.readFile(outputFileName);
    const blob = new Blob([fileArray], { type: 'application/pdf' });
    const url = URL.createObjectURL(blob);
    const a = document.createElement('a');
    a.href = url;
    a.download = outputFileName;
    a.click();
    URL.revokeObjectURL(url);
  };

  return (
    <div style={{ textAlign: 'center', height: '300px' }}>
      <h1>Copy Page with Template</h1>
      <button onClick={copyPageWithTemplate}>
        Start
      </button>
    </div>
  );
}

export default App;
DrawTemplate에 대해 주목할 만한 몇 가지 세부 사항은 다음과 같습니다.
- 크기 인수: 세 번째 인수(대상 크기)를 생략하면 템플릿은 크기 조정 없이 원래 크기로 렌더링됩니다. 더 큰 대상 페이지에서는 콘텐츠가 사용 가능한 공간의 일부만 차지합니다.
- 페이지 생성: 대상 페이지의 크기와 여백은 템플릿이 아니라
Pages.Insert에서 가져옵니다. 예제에서는 사방 여백이 0이므로 그리기 원점이 페이지의 왼쪽 위 모서리와 일치합니다. - 여러 번 그리기: 동일한
template객체를 서로 다른 위치와 크기로 두 개의 별도 페이지에 두 번 그려서 재사용 기능을 보여줍니다.
1페이지의 콘텐츠가 이제 서로 다른 크기와 위치로 새로 삽입된 두 개의 A4 페이지에 나타나며, 문서는 4페이지에서 6페이지로 늘어납니다.
자주 묻는 질문
new PdfMargins(0.0)으로 페이지를 만들면 Arg_NullReferenceException이 발생합니다
원인: PdfMargins 생성자는 단순 숫자 인수를 여백 값이 아니라 내부 핸들로 해석합니다. 따라서 new pdfModule.PdfMargins(0.0)을 호출하면 유효한 여백을 나타내지 않는 객체가 생성됩니다. 이 객체의 Left 또는 Top 속성에 접근하면 Arg_NullReferenceException이 발생하고, 페이지 생성에 전달하면 예기치 않은 결과가 나옵니다.
해결 방법: 여백은 항상 구성 객체로 전달하세요. 모든 면을 0으로 균일하게 설정하려면 { margin: 0.0 }을 사용하고, 각 면의 값을 개별적으로 지정하려면 각 면을 명시적으로 설정하세요.
// Zero margins on all four sides
const margins = new pdfModule.PdfMargins({ margin: 0.0 });

// Or set each side separately
const custom = new pdfModule.PdfMargins({ left: 20.0, top: 20.0, right: 20.0, bottom: 20.0 });
페이지를 복사할 때 범위를 벗어나거나 역전된 범위 오류가 발생합니다
원인: 페이지 인덱스는 0부터 시작하며, InsertPageRange의 endIndex는 포함됩니다. 따라서 유효한 범위는 0부터 Pages.Count - 1까지입니다. 이 범위를 벗어난 인덱스를 전달하면 Index out of range가 발생하고, startIndex를 endIndex보다 크게 설정하면 The start index is greater then the end index.가 발생합니다.
해결 방법: 메서드를 호출하기 전에 상한을 Pages.Count에 맞춰 제한하여 보호하세요.
// To copy pages 2 to 4: start = 1, end = 3, with the page count as the upper bound
const start = 1;
const end = Math.min(3, sourceDoc.Pages.Count - 1);
targetDoc.InsertPageRange(sourceDoc, start, end);
회전된 페이지를 복사한 후 방향이 잘못 나옵니다
원인: CreateTemplate()은 페이지의 그려진 콘텐츠는 캡처하지만 회전 각도(/Rotate 항목)는 캡처하지 않습니다. 원본 페이지에 회전이 있으면 템플릿의 좌표계가 대상 페이지와 어긋나서, 템플릿을 그대로 그리면 콘텐츠가 보이는 영역 밖에 배치되고 결과 복사본의 Rotation은 0이 됩니다.
해결 방법: 회전된 원본 페이지에는 회전 각도가 콘텐츠와 함께 이동하도록 전체 페이지 복사를 사용하는 것이 좋습니다.
// Whole-page copy: the rotation angle comes with the page
targetDoc.InsertPage({ ldDoc: sourceDoc, pageIndex: 0, resultPageIndex: 1 });
템플릿 접근 방식을 피할 수 없다면, 템플릿을 추출하기 전에 원본 페이지의 회전을 일시적으로 지우고, 그런 다음 원본과 새 페이지 모두에 원래 각도를 복원하세요.
const rotation = sourcePage.Rotation.value;

// Zero it temporarily so the template exports at the page's real coordinates
sourcePage.Rotation = 0;
const newPage = doc.Pages.Insert(1, sourcePage.Size, new pdfModule.PdfMargins({ margin: 0.0 }));
newPage.Canvas.DrawTemplate(sourcePage.CreateTemplate(), new pdfModule.PointF(0.0, 0.0));

// Restore the source page and give the copy the same angle
sourcePage.Rotation = rotation;
newPage.Rotation = rotation;
출력 문서에서 평가판 워터마크를 제거하거나 전체 기능 액세스를 잠금 해제하려면 영업팀에 문의하여 30일 임시 라이선스를 받으세요.