In Excel, column charts are excellent for comparing data between different categories or groups. You can directly compare the values of different columns to see the differences and relationships between them. This is useful for analyzing market share, comparing the performance of different teams or products, or evaluating the impact of different factors. In this article, you will learn how to create a column chart in Excel in Java using Spire.XLS for Java.
Install Spire.XLS for Java
First of all, you're required to add the Spire.Xls.jar file as a dependency in your Java program. The JAR file can be downloaded from this link. If you use Maven, you can easily import the JAR file in your application by adding the following code to your project's pom.xml file.
<repositories>
    <repository>
        <id>com.e-iceblue</id>
        <name>e-iceblue</name>
        <url>https://repo.e-iceblue.com/nexus/content/groups/public/</url>
    </repository>
</repositories>
<dependencies>
    <dependency>
        <groupId>e-iceblue</groupId>
        <artifactId>spire.xls</artifactId>
        <version>16.4.1</version>
    </dependency>
</dependencies>
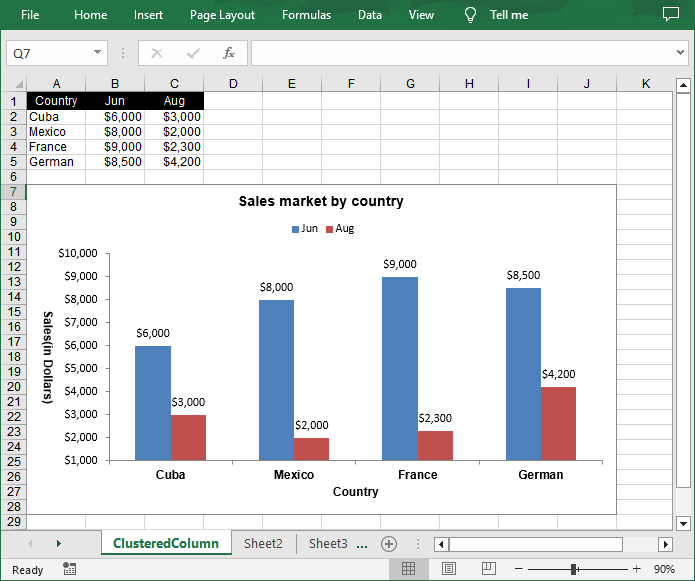
Create a Clustered Column Chart in Excel in Java
To add a clustered column chart to a worksheet, you can use the Worksheet.getCharts().add(ExcelChartType.ColumnClustered) method. The following are the detailed steps.
- Create a Workbook object.
- Get a specific worksheet through Workbook.getWorksheets().get() method.
- Write data into the specified cells.
- Add a clustered column char to the worksheet using Worksheet.getCharts().add(ExcelChartType.ColumnClustered) method.
- Set the chart data using Chart.setDataRange() method.
- Set the position, title, and other attributes of the chart through the properties under the Chart object.
- Save the result document using Workbook.saveToFile() method.
- Java
import com.spire.xls.*;
import com.spire.xls.charts.*;
import java.awt.*;

public class ClusteredColumnChart {
    public static void main(String[] args) {
        // Create a Workbook object
        Workbook workbook = new Workbook();

        //Get the first worksheet and set its name
        Worksheet sheet = workbook.getWorksheets().get(0);
        sheet.setName("ClusteredColumn");

        // Set chart data
        sheet.getCellRange("A1").setValue("Country");
        sheet.getCellRange("A2").setValue("Cuba");
        sheet.getCellRange("A3").setValue("Mexico");
        sheet.getCellRange("A4").setValue("France");
        sheet.getCellRange("A5").setValue("German");

        sheet.getCellRange("B1").setValue("Jun");
        sheet.getCellRange("B2").setNumberValue(6000);
        sheet.getCellRange("B3").setNumberValue(8000);
        sheet.getCellRange("B4").setNumberValue(9000);
        sheet.getCellRange("B5").setNumberValue(8500);

        sheet.getCellRange("C1").setValue("Aug");
        sheet.getCellRange("C2").setNumberValue(3000);
        sheet.getCellRange("C3").setNumberValue(2000);
        sheet.getCellRange("C4").setNumberValue(2300);
        sheet.getCellRange("C5").setNumberValue(4200);

        // Set cell style
        sheet.getCellRange("A1:C1").setRowHeight(15);
        sheet.getCellRange("A1:C1").getCellStyle().setColor(Color.black);
        sheet.getCellRange("A1:C1").getCellStyle().getExcelFont().setColor(Color.white);
        sheet.getCellRange("A1:C1").getCellStyle().setVerticalAlignment(VerticalAlignType.Center);
        sheet.getCellRange("A1:C1").getCellStyle().setHorizontalAlignment(HorizontalAlignType.Center);
        sheet.getCellRange("B2:C5").getCellStyle().setNumberFormat("\"$\"#,##0");

        // Add a clustered column chart to the worksheet
        Chart chart = sheet.getCharts().add(ExcelChartType.ColumnClustered);

        // Set data range of the chart
        chart.setDataRange(sheet.getCellRange("A1:C5"));
        chart.setSeriesDataFromRange(false);

        // Set position of the chart
        chart.setLeftColumn(1);
        chart.setTopRow(7);
        chart.setRightColumn(11);
        chart.setBottomRow(29);

        // Set chart title
        chart.setChartTitle("Sales market by country");
        chart.getChartTitleArea().isBold(true);
        chart.getChartTitleArea().setSize(12);

        // Set category axis and value axis of the chart
        chart.getPrimaryCategoryAxis().setTitle("Country");
        chart.getPrimaryCategoryAxis().getFont().isBold(true);
        chart.getPrimaryCategoryAxis().getTitleArea().isBold(true);

        chart.getPrimaryValueAxis().setTitle("Sales(in Dollars)");
        chart.getPrimaryValueAxis().hasMajorGridLines(false);
        chart.getPrimaryValueAxis().setMinValue(1000);
        chart.getPrimaryValueAxis().getTitleArea().isBold(true);
        chart.getPrimaryValueAxis().getTitleArea().setTextRotationAngle(90);

        // Set chart series
        ChartSeries series = chart.getSeries();
        for (int i = 0;i < series.size();i++)
        {
            ChartSerie cs = series.get(i);
            cs.getFormat().getOptions().isVaryColor(true);
            cs.getDataPoints().getDefaultDataPoint().getDataLabels().hasValue(true);
        }

        // Set legend position
        chart.getLegend().setPosition(LegendPositionType.Top);

        // Save the result document
        workbook.saveToFile("ClusteredColumnChart.xlsx",ExcelVersion.Version2016);
    }
}
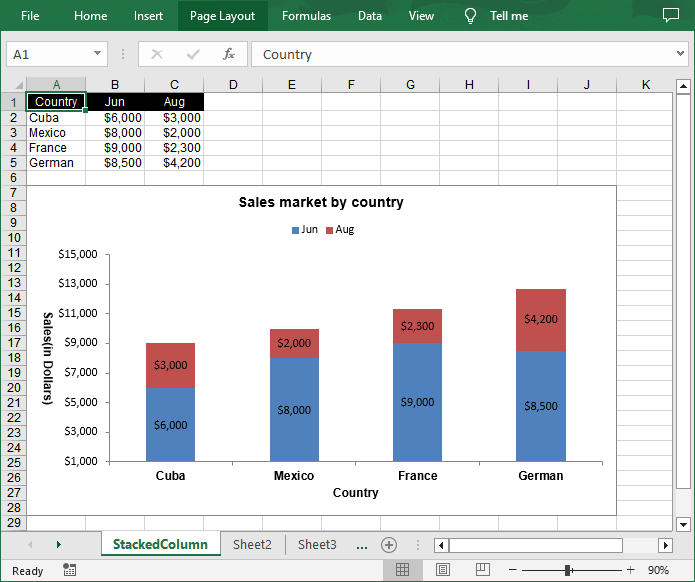
Create a Stacked Column Chart in Excel in Java
A stacked column chart shows the total value of each category as the height of the column, and the individual components within each category are stacked on top of each other. The following are the steps to add a stacked column chart in Excel.
- Create a Workbook object.
- Get a specific worksheet through Workbook.getWorksheets().get() method.
- Write data into the specified cells.
- Add a clustered column char to the worksheet using Worksheet.getCharts().add(ExcelChartType.ColumnStacked) method.
- Set the chart data using Chart.setDataRange() method.
- Set the position, title, and other attributes of the chart through the properties under the Chart object.
- Save the result document using Workbook.saveToFile() method.
- Java
import com.spire.xls.*;
import com.spire.xls.charts.*;
import java.awt.*;

public class StackedColumnChart {
    public static void main(String[] args) {
        // Create a Workbook object
        Workbook workbook = new Workbook();

        //Get the first worksheet and set its name
        Worksheet sheet = workbook.getWorksheets().get(0);
        sheet.setName("StackedColumn");

        // Set chart data
        sheet.getCellRange("A1").setValue("Country");
        sheet.getCellRange("A2").setValue("Cuba");
        sheet.getCellRange("A3").setValue("Mexico");
        sheet.getCellRange("A4").setValue("France");
        sheet.getCellRange("A5").setValue("German");

        sheet.getCellRange("B1").setValue("Jun");
        sheet.getCellRange("B2").setNumberValue(6000);
        sheet.getCellRange("B3").setNumberValue(8000);
        sheet.getCellRange("B4").setNumberValue(9000);
        sheet.getCellRange("B5").setNumberValue(8500);

        sheet.getCellRange("C1").setValue("Aug");
        sheet.getCellRange("C2").setNumberValue(3000);
        sheet.getCellRange("C3").setNumberValue(2000);
        sheet.getCellRange("C4").setNumberValue(2300);
        sheet.getCellRange("C5").setNumberValue(4200);

        // Set cell style
        sheet.getCellRange("A1:C1").setRowHeight(15);
        sheet.getCellRange("A1:C1").getCellStyle().setColor(Color.black);
        sheet.getCellRange("A1:C1").getCellStyle().getExcelFont().setColor(Color.white);
        sheet.getCellRange("A1:C1").getCellStyle().setVerticalAlignment(VerticalAlignType.Center);
        sheet.getCellRange("A1:C1").getCellStyle().setHorizontalAlignment(HorizontalAlignType.Center);
        sheet.getCellRange("B2:C5").getCellStyle().setNumberFormat("\"$\"#,##0");

        // Add a stacked column chart to the worksheet
        Chart chart = sheet.getCharts().add(ExcelChartType.ColumnStacked);

        // Set data range of the chart
        chart.setDataRange(sheet.getCellRange("A1:C5"));
        chart.setSeriesDataFromRange(false);

        // Set position of the chart
        chart.setLeftColumn(1);
        chart.setTopRow(7);
        chart.setRightColumn(11);
        chart.setBottomRow(29);

        // Set chart title
        chart.setChartTitle("Sales market by country");
        chart.getChartTitleArea().isBold(true);
        chart.getChartTitleArea().setSize(12);

        // Set category axis and value axis of the chart
        chart.getPrimaryCategoryAxis().setTitle("Country");
        chart.getPrimaryCategoryAxis().getFont().isBold(true);
        chart.getPrimaryCategoryAxis().getTitleArea().isBold(true);

        chart.getPrimaryValueAxis().setTitle("Sales(in Dollars)");
        chart.getPrimaryValueAxis().hasMajorGridLines(false);
        chart.getPrimaryValueAxis().setMinValue(1000);
        chart.getPrimaryValueAxis().getTitleArea().isBold(true);
        chart.getPrimaryValueAxis().getTitleArea().setTextRotationAngle(90);

        // Set chart series
        ChartSeries series = chart.getSeries();
        for (int i = 0;i < series.size();i++)
        {
            ChartSerie cs = series.get(i);
            cs.getFormat().getOptions().isVaryColor(true);
            cs.getDataPoints().getDefaultDataPoint().getDataLabels().hasValue(true);
        }

        // Set legend position
        chart.getLegend().setPosition(LegendPositionType.Top);

        // Save the result document
        workbook.saveToFile("StackedColumnChart.xlsx",ExcelVersion.Version2016);
    }
}
Apply for a Temporary License
If you'd like to remove the evaluation message from the generated documents, or to get rid of the function limitations, please request a 30-day trial license for yourself.
