
A bar chart is a type of graph that represents or summarizes data in the form of horizontal rectangular bars of equal width but different lengths. In MS Excel, the bar chart is a great tool to compare data among different groups, which helps users to analyze data and draw conclusions quickly. In this article, you will learn how to programmatically create a clustered bar chart or a stacked bar chart in an Excel worksheet using Spire.XLS for Java.
Install Spire.XLS for Java
First of all, you're required to add the Spire.Xls.jar file as a dependency in your Java program. The JAR file can be downloaded from this link. If you use Maven, you can easily import the JAR file in your application by adding the following code to your project's pom.xml file.
<repositories>
    <repository>
        <id>com.e-iceblue</id>
        <name>e-iceblue</name>
        <url>https://repo.e-iceblue.com/nexus/content/groups/public/</url>
    </repository>
</repositories>
<dependencies>
    <dependency>
        <groupId>e-iceblue</groupId>
        <artifactId>spire.xls</artifactId>
        <version>14.4.1</version>
    </dependency>
</dependencies>
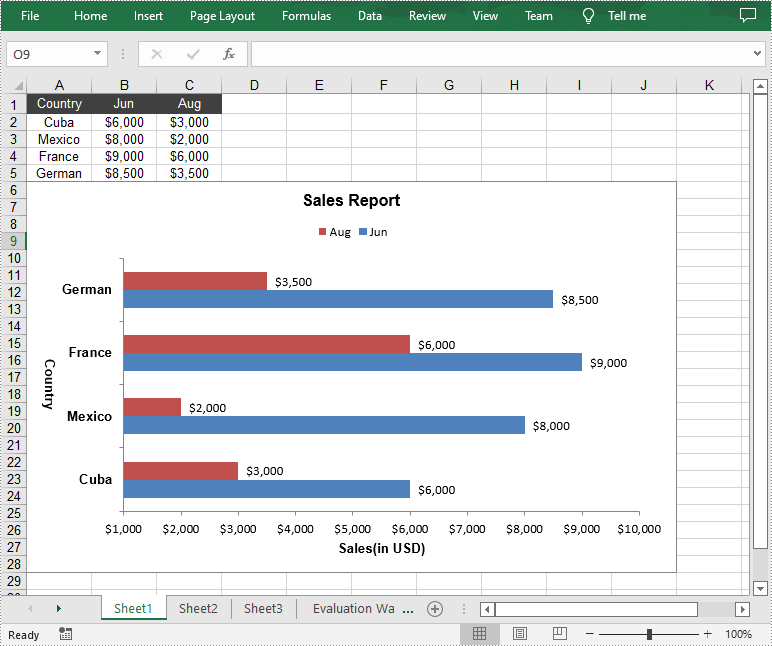
Create a Clustered Bar Chart in Excel
In clustered bar chart, data values of different series are displayed in separate bars side-by-side, which allows a direct comparison of multiple data series per category. The following are the detailed steps to create a clustered bar chart in an Excel worksheet.
- Create an instance of Workbook class.
- Get a specified worksheet by its index using Workbook.getWorksheets().get() method.
- Add some data to specified cells and set the cell styles.
- Add a 2D clustered bar chart to the specified worksheet using Worksheet.getCharts().add(ExcelChartType.BarClustered) method.
- Set data range for the chart using Chart.setDataRange(CellRange dataRange) method.
- Set the position and title of the chart.
- Get the primary category axis of the chart using Chart.getPrimaryCategoryAxis() method, and then set the display text and title of the category axis using the methods under ChartCategoryAxis class.
- Get the primary value axis of the chart using Chart.getPrimaryValueAxis() method, and then set the title, minimum value and major gridlines of the value axis using the methods under ChartValueAxis class.
- Loop through the data series of the chart, and then show data labels for the data points of each data series by setting the value of ChartSerie.getDataPoints().getDefaultDataPoint().getDataLabels().hasValue() method to true.
- Set the position of chart legend using Chart.getLegend().setPosition() method.
- Save the result file using Workbook.saveToFile() method.
- Java
import com.spire.xls.*;
import com.spire.xls.charts.ChartSerie;
import com.spire.xls.charts.ChartSeries;

import java.awt.*;

public class CreateBarChart {

    public static void main(String[] args) {

        //Create an instance of Workbook class
        Workbook workbook = new Workbook();

        //Get the first worksheet
        Worksheet sheet = workbook.getWorksheets().get(0);

        //Insert data to specified cells
        sheet.getCellRange("A1").setValue("Country");
        sheet.getCellRange("A2").setValue("Cuba");
        sheet.getCellRange("A3").setValue("Mexico");
        sheet.getCellRange("A4").setValue("France");
        sheet.getCellRange("A5").setValue("German");

        sheet.getCellRange("B1").setValue("Jun");
        sheet.getCellRange("B2").setNumberValue(6000);
        sheet.getCellRange("B3").setNumberValue(8000);
        sheet.getCellRange("B4").setNumberValue(9000);
        sheet.getCellRange("B5").setNumberValue(8500);

        sheet.getCellRange("C1").setValue("Aug");
        sheet.getCellRange("C2").setNumberValue(3000);
        sheet.getCellRange("C3").setNumberValue(2000);
        sheet.getCellRange("C4").setNumberValue(6000);
        sheet.getCellRange("C5").setNumberValue(3500);

        //Set cell styles
        sheet.getCellRange("A1:C1").setRowHeight(15);
        sheet.getCellRange("A1:C1").getCellStyle().setColor(Color.darkGray);
        sheet.getCellRange("A1:C1").getCellStyle().getExcelFont().setColor(Color.white);
        sheet.getCellRange("A1:C5").getCellStyle().setVerticalAlignment(VerticalAlignType.Center);
        sheet.getCellRange("A1:C5").getCellStyle().setHorizontalAlignment(HorizontalAlignType.Center);

        //Set number format
        sheet.getCellRange("B2:C5").getCellStyle().setNumberFormat("\"$\"#,##0");

        //Add a clustered bar chart to the worksheet
        Chart chart = sheet.getCharts().add(ExcelChartType.BarClustered);

        //Set data range for the chart
        chart.setDataRange(sheet.getCellRange("A1:C5"));
        chart.setSeriesDataFromRange(false);

        //Set position of the chart
        chart.setLeftColumn(1);
        chart.setTopRow(6);
        chart.setRightColumn(11);
        chart.setBottomRow(29);

        //Set and format chart title
        chart.setChartTitle("Sales Report");
        chart.getChartTitleArea().isBold(true);
        chart.getChartTitleArea().setSize(12);

        //Set and format category axis title
        chart.getPrimaryCategoryAxis().setTitle("Country");
        chart.getPrimaryCategoryAxis().getFont().isBold(true);
        chart.getPrimaryCategoryAxis().getTitleArea().isBold(true);
        chart.getPrimaryCategoryAxis().getTitleArea().setTextRotationAngle(90);

        //Set and format value axis title
        chart.getPrimaryValueAxis().setTitle("Sales(in USD)");
        chart.getPrimaryValueAxis().hasMajorGridLines(false);
        chart.getPrimaryValueAxis().setMinValue(1000);
        chart.getPrimaryValueAxis().getTitleArea().isBold(true);

        //Show data labels for data points
        ChartSeries series = chart.getSeries();
        for (int i = 0;i < series.size();i++)
        {
            ChartSerie cs = series.get(i);
            cs.getFormat().getOptions().isVaryColor(true);
            cs.getDataPoints().getDefaultDataPoint().getDataLabels().hasValue(true);
        }

        //Set position of chart legend
        chart.getLegend().setPosition(LegendPositionType.Top);

        //Save the result file
        workbook.saveToFile("CreateBarChart.xlsx", ExcelVersion.Version2016);
    }
}
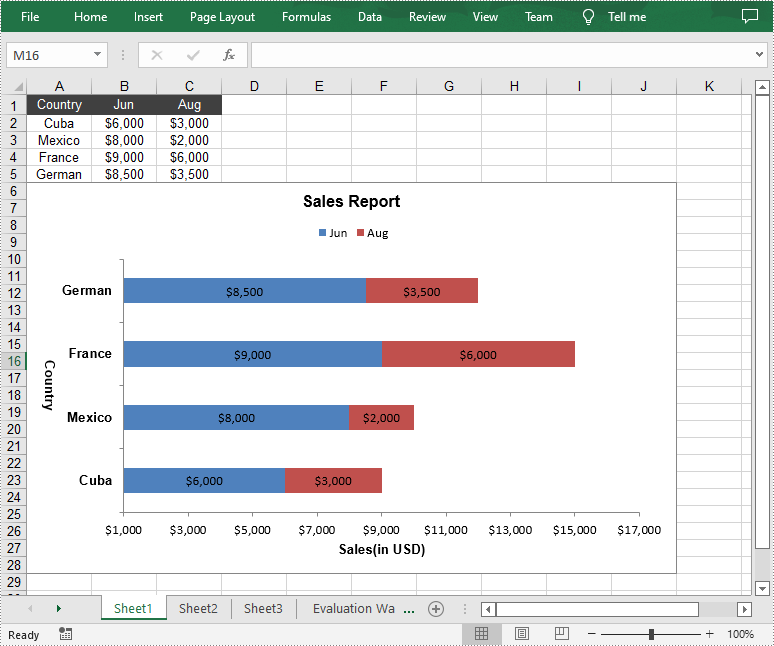
Create a Stacked Bar Chart in Excel
In stacked bar chart, data values of different series are stacked one over the other in a single bar. Compared with the clustered bar chart, the stacked bar chart provides a clearer view of part-to-whole comparison in each category. The following are the detailed steps to create a stacked bar chart in an Excel worksheet.
- Create an instance of Workbook class.
- Get a specified worksheet by its index using Workbook.getWorksheets().get() method.
- Add some data to specified cells and set the cell styles.
- Add a 2D stacked bar chart to the specified worksheet using Worksheet.getCharts().add(ExcelChartType.BarStacked) method.
- Set data range for the chart using Chart.setDataRange(CellRange dataRange) method.
- Set position, title, category axis title and value axis title for the chart.
- Loop through the data series of the chart, and then show data labels for the data points of each data series by setting the value of ChartSerie.getDataPoints().getDefaultDataPoint().getDataLabels().hasValue() method to true.
- Set the position of chart legend using Chart.getLegend().setPosition() method.
- Save the result file using Workbook.saveToFile() method.
- Java
import com.spire.xls.*;
import com.spire.xls.charts.ChartSerie;
import com.spire.xls.charts.ChartSeries;

import java.awt.*;

public class CreateBarChart {

    public static void main(String[] args) {

        //Create a Workbook object
        Workbook workbook = new Workbook();

        //Get the first worksheet
        Worksheet sheet = workbook.getWorksheets().get(0);

        //Insert data to specified cells
        sheet.getCellRange("A1").setValue("Country");
        sheet.getCellRange("A2").setValue("Cuba");
        sheet.getCellRange("A3").setValue("Mexico");
        sheet.getCellRange("A4").setValue("France");
        sheet.getCellRange("A5").setValue("German");

        sheet.getCellRange("B1").setValue("Jun");
        sheet.getCellRange("B2").setNumberValue(6000);
        sheet.getCellRange("B3").setNumberValue(8000);
        sheet.getCellRange("B4").setNumberValue(9000);
        sheet.getCellRange("B5").setNumberValue(8500);

        sheet.getCellRange("C1").setValue("Aug");
        sheet.getCellRange("C2").setNumberValue(3000);
        sheet.getCellRange("C3").setNumberValue(2000);
        sheet.getCellRange("C4").setNumberValue(6000);
        sheet.getCellRange("C5").setNumberValue(3500);

        //Set cell styles
        sheet.getCellRange("A1:C1").setRowHeight(15);
        sheet.getCellRange("A1:C1").getCellStyle().setColor(Color.darkGray);
        sheet.getCellRange("A1:C1").getCellStyle().getExcelFont().setColor(Color.white);
        sheet.getCellRange("A1:C5").getCellStyle().setVerticalAlignment(VerticalAlignType.Center);
        sheet.getCellRange("A1:C5").getCellStyle().setHorizontalAlignment(HorizontalAlignType.Center);

        //Set number format
        sheet.getCellRange("B2:C5").getCellStyle().setNumberFormat("\"$\"#,##0");

        //Add a stacked bar chart to the worksheet
        Chart chart = sheet.getCharts().add(ExcelChartType.BarStacked);

        //Set data range for the chart
        chart.setDataRange(sheet.getCellRange("A1:C5"));
        chart.setSeriesDataFromRange(false);

        //Set position of the chart
        chart.setLeftColumn(1);
        chart.setTopRow(6);
        chart.setRightColumn(11);
        chart.setBottomRow(29);

        //Set and format chart title
        chart.setChartTitle("Sales Report");
        chart.getChartTitleArea().isBold(true);
        chart.getChartTitleArea().setSize(12);

        //Set and format category axis title
        chart.getPrimaryCategoryAxis().setTitle("Country");
        chart.getPrimaryCategoryAxis().getFont().isBold(true);
        chart.getPrimaryCategoryAxis().getTitleArea().isBold(true);
        chart.getPrimaryCategoryAxis().getTitleArea().setTextRotationAngle(90);

        //Set and format value axis title
        chart.getPrimaryValueAxis().setTitle("Sales(in USD)");
        chart.getPrimaryValueAxis().hasMajorGridLines(false);
        chart.getPrimaryValueAxis().setMinValue(1000);
        chart.getPrimaryValueAxis().getTitleArea().isBold(true);

        //Show data labels for data points
        ChartSeries series = chart.getSeries();
        for (int i = 0;i < series.size();i++)
        {
            ChartSerie cs = series.get(i);
            cs.getFormat().getOptions().isVaryColor(true);
            cs.getDataPoints().getDefaultDataPoint().getDataLabels().hasValue(true);
        }

        //Set position of chart legend
        chart.getLegend().setPosition(LegendPositionType.Top);

        //Save the result file
        workbook.saveToFile("StackedBarChart.xlsx", ExcelVersion.Version2016);
    }
}
Apply for a Temporary License
If you'd like to remove the evaluation message from the generated documents, or to get rid of the function limitations, please request a 30-day trial license for yourself.
