Python (362)
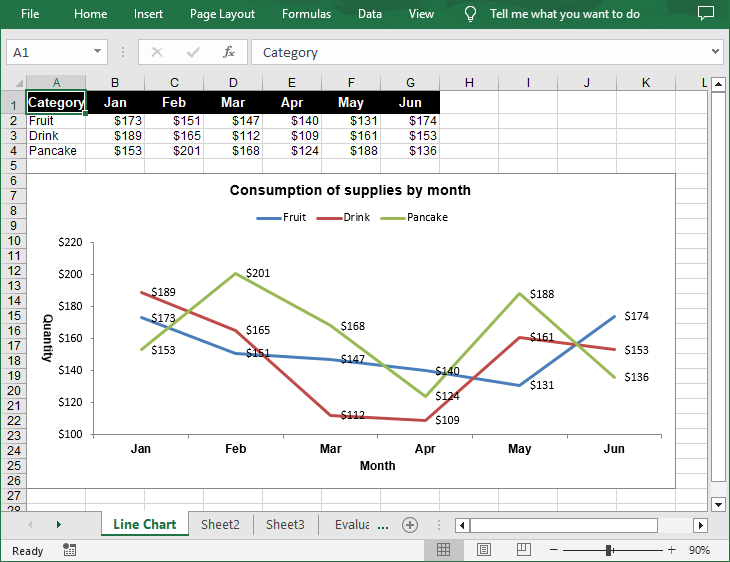
A line chart is a type of chart that displays information as a series of data points connected by straight line segments. It's particularly useful for showing changes over time. For example, if you're tracking monthly sales figures, a line chart can help you identify trends, peaks, and troughs. In this article, you will learn how to create a line chart in Excel in Python using Spire.XLS for Python.
Install Spire.XLS for Python
This scenario requires Spire.XLS for Python and plum-dispatch v1.7.4. They can be easily installed in your Windows through the following pip command.
pip install Spire.XLS
If you are unsure how to install, please refer to this tutorial: How to Install Spire.XLS for Python on Windows
Create a Simple Line Chart in Excel in Python
Spire.XLS for Python provides the Worksheet.Charts.Add(ExcelChartType.Line) method to add a simple line chart to an Excel worksheet. The following are the detailed steps:
- Create a Workbook instance.
- Get a specified worksheet using Workbook.Worksheets[] property.
- Add the chart data to specified cells and set the cell styles.
- Add a simple line chart to the worksheet using Worksheet.Charts.Add(ExcelChartType.Line) method.
- Set data range for the chart using Chart.DataRange property.
- Set the position, title, axis and other attributes of the chart.
- Save the result file using Workbook.SaveToFile() method.
- Python
from spire.xls import *
from spire.xls.common import *

# Create a Workbook instance
workbook = Workbook()

# Get the first sheet and set its name
sheet = workbook.Worksheets[0]
sheet.Name = "Line Chart"

# Add chart data to specified cells
sheet.Range["A1"].Value = "Category"
sheet.Range["A2"].Value = "Fruit"
sheet.Range["A3"].Value = "Drink"
sheet.Range["A4"].Value = "Pancake"

sheet.Range["B1"].Value = "Jan"
sheet.Range["B2"].NumberValue = 173
sheet.Range["B3"].NumberValue = 189
sheet.Range["B4"].NumberValue = 153

sheet.Range["C1"].Value = "Feb"
sheet.Range["C2"].NumberValue = 151
sheet.Range["C3"].NumberValue = 165
sheet.Range["C4"].NumberValue = 201

sheet.Range["D1"].Value = "Mar"
sheet.Range["D2"].NumberValue = 147
sheet.Range["D3"].NumberValue = 112
sheet.Range["D4"].NumberValue = 168

sheet.Range["E1"].Value = "Apr"
sheet.Range["E2"].NumberValue = 140
sheet.Range["E3"].NumberValue = 109
sheet.Range["E4"].NumberValue = 124

sheet.Range["F1"].Value = "May"
sheet.Range["F2"].NumberValue = 131
sheet.Range["F3"].NumberValue = 161
sheet.Range["F4"].NumberValue = 188

sheet.Range["G1"].Value = "Jun"
sheet.Range["G2"].NumberValue = 174
sheet.Range["G3"].NumberValue = 153
sheet.Range["G4"].NumberValue = 136

# Set cell styles
sheet.Range["A1:G1"].RowHeight = 20
sheet.Range["A1:G1"].Style.Color = Color.get_Black()
sheet.Range["A1:G1"].Style.Font.Color = Color.get_White()
sheet.Range["A1:G1"].Style.Font.IsBold = True
sheet.Range["A1:G1"].Style.Font.Size = 11
sheet.Range["A1:G1"].Style.VerticalAlignment = VerticalAlignType.Center
sheet.Range["A1:G1"].Style.HorizontalAlignment = HorizontalAlignType.Center
sheet.Range["B2:G4"].Style.NumberFormat = "\"$\"#,##0"

# Add a line chart to the worksheet
chart = sheet.Charts.Add(ExcelChartType.Line)

# Set data range for the chart
chart.DataRange = sheet.Range["A1:G4"]

# Set position of chart
chart.LeftColumn = 1
chart.TopRow = 6
chart.RightColumn = 12
chart.BottomRow = 27

# Set and format chart title
chart.ChartTitle = "Consumption of supplies by month"
chart.ChartTitleArea.IsBold = True
chart.ChartTitleArea.Size = 12

# Set the category axis of the chart
chart.PrimaryCategoryAxis.Title = "Month"
chart.PrimaryCategoryAxis.Font.IsBold = True
chart.PrimaryCategoryAxis.TitleArea.IsBold = True

# Set the value axis of the chart
chart.PrimaryValueAxis.Title = "Quantity"
chart.PrimaryValueAxis.HasMajorGridLines = False
chart.PrimaryValueAxis.TitleArea.TextRotationAngle = 90
chart.PrimaryValueAxis.MinValue = 100
chart.PrimaryValueAxis.TitleArea.IsBold = True

# Set series colors and data labels
for cs in chart.Series:
    cs.Format.Options.IsVaryColor = True
    cs.DataPoints.DefaultDataPoint.DataLabels.HasValue = True

# Set legend position
chart.Legend.Position = LegendPositionType.Top

# Save the document
workbook.SaveToFile("LineChart.xlsx", ExcelVersion.Version2016)
workbook.Dispose()
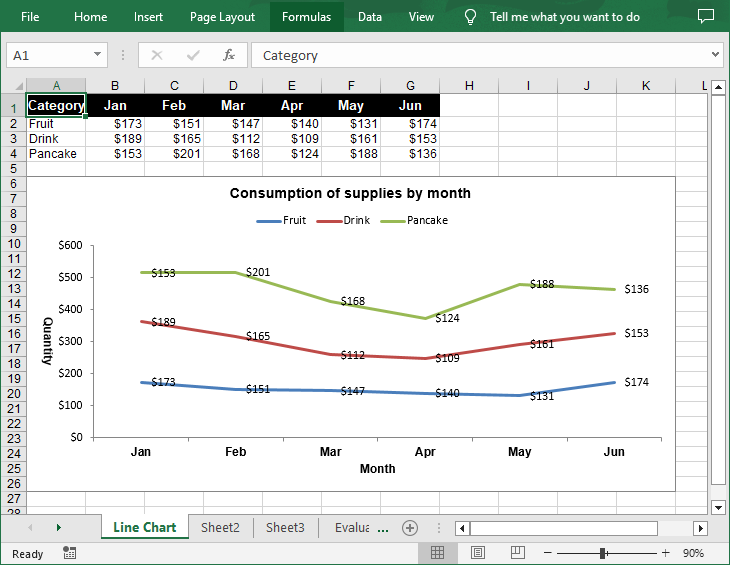
Create a Stacked Line Chart in Excel in Python
A stacked line chart stacks the values of each category on top of each other. This makes it easier to visualize how each data series contributes to the overall trend. The following are the steps to create a stacked line chart using Python:
- Create a Workbook instance.
- Get a specified worksheet using Workbook.Worksheets[] property.
- Add the chart data to specified cells and set the cell styles.
- Add a stacked line chart to the worksheet using Worksheet.Charts.Add(ExcelChartType.LineStacked) method.
- Set data range for the chart using Chart.DataRange property.
- Set the position, title, axis and other attributes of the chart.
- Save the result file using Workbook.SaveToFile() method.
- Python
from spire.xls import *
from spire.xls.common import *

# Create a Workbook instance
workbook = Workbook()

# Get the first sheet and set its name
sheet = workbook.Worksheets[0]
sheet.Name = "Line Chart"

# Add chart data to specified cells
sheet.Range["A1"].Value = "Category"
sheet.Range["A2"].Value = "Fruit"
sheet.Range["A3"].Value = "Drink"
sheet.Range["A4"].Value = "Pancake"

sheet.Range["B1"].Value = "Jan"
sheet.Range["B2"].NumberValue = 173
sheet.Range["B3"].NumberValue = 189
sheet.Range["B4"].NumberValue = 153

sheet.Range["C1"].Value = "Feb"
sheet.Range["C2"].NumberValue = 151
sheet.Range["C3"].NumberValue = 165
sheet.Range["C4"].NumberValue = 201

sheet.Range["D1"].Value = "Mar"
sheet.Range["D2"].NumberValue = 147
sheet.Range["D3"].NumberValue = 112
sheet.Range["D4"].NumberValue = 168

sheet.Range["E1"].Value = "Apr"
sheet.Range["E2"].NumberValue = 140
sheet.Range["E3"].NumberValue = 109
sheet.Range["E4"].NumberValue = 124

sheet.Range["F1"].Value = "May"
sheet.Range["F2"].NumberValue = 131
sheet.Range["F3"].NumberValue = 161
sheet.Range["F4"].NumberValue = 188

sheet.Range["G1"].Value = "Jun"
sheet.Range["G2"].NumberValue = 174
sheet.Range["G3"].NumberValue = 153
sheet.Range["G4"].NumberValue = 136

# Set cell styles
sheet.Range["A1:G1"].RowHeight = 20
sheet.Range["A1:G1"].Style.Color = Color.get_Black()
sheet.Range["A1:G1"].Style.Font.Color = Color.get_White()
sheet.Range["A1:G1"].Style.Font.IsBold = True
sheet.Range["A1:G1"].Style.Font.Size = 11
sheet.Range["A1:G1"].Style.VerticalAlignment = VerticalAlignType.Center
sheet.Range["A1:G1"].Style.HorizontalAlignment = HorizontalAlignType.Center
sheet.Range["B2:G4"].Style.NumberFormat = "\"$\"#,##0"

# Add a stacked line chart to the worksheet
chart = sheet.Charts.Add(ExcelChartType.LineStacked)

# Set data range for the chart
chart.DataRange = sheet.Range["A1:G4"]

# Set position of chart
chart.LeftColumn = 1
chart.TopRow = 6
chart.RightColumn = 12
chart.BottomRow = 27

# Set and format chart title
chart.ChartTitle = "Consumption of supplies by month"
chart.ChartTitleArea.IsBold = True
chart.ChartTitleArea.Size = 12

# Set the category axis of the chart
chart.PrimaryCategoryAxis.Title = "Month"
chart.PrimaryCategoryAxis.Font.IsBold = True
chart.PrimaryCategoryAxis.TitleArea.IsBold = True

# Set the value axis of the chart
chart.PrimaryValueAxis.Title = "Quantity"
chart.PrimaryValueAxis.HasMajorGridLines = False
chart.PrimaryValueAxis.TitleArea.TextRotationAngle = 90
chart.PrimaryValueAxis.TitleArea.IsBold = True

# Set series colors and data labels
for cs in chart.Series:
    cs.Format.Options.IsVaryColor = True
    cs.DataPoints.DefaultDataPoint.DataLabels.HasValue = True

# Set legend position
chart.Legend.Position = LegendPositionType.Top

# Save the document
workbook.SaveToFile("StackedLineChart.xlsx", ExcelVersion.Version2016)
workbook.Dispose()
Apply for a Temporary License
If you'd like to remove the evaluation message from the generated documents, or to get rid of the function limitations, please request a 30-day trial license for yourself.
Editing an Excel document involves a variety of actions, such as inputting and formatting text, applying formulas, generating visualizations, and organizing data for clarity and insight. Being able to edit Excel documents programmatically is a crucial skill that empowers developers to enhance their data management capabilities.
In this article, you will learn how to edit an existing Excel document in Python using Spire.XLS for Python.
- Read and Write Excel Files in Python
- Apply Formatting to Excel Cells in Python
- Find and Replace Text in Excel in Python
- Add Formulas and Charts to Excel in Python
Install Spire.XLS for Python
This scenario requires Spire.XLS for Python and plum-dispatch v1.7.4. They can be easily installed in your Windows through the following pip command.
pip install Spire.XLS
If you are unsure how to install, please refer to this tutorial: How to Install Spire.XLS for Python on Windows
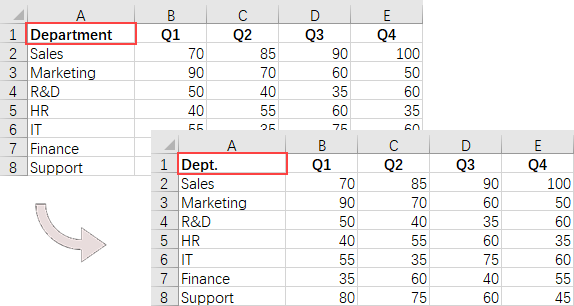
Read and Write Excel Files in Python
A key task when handling Excel files in Python is the efficient reading and writing of data, which is essential for numerous applications such as data analysis and report generation. Spire.XLS for Python simplifies this process by offering the CellRange.Value property. This feature allows developers to easily retrieve values from individual cells and reassign them as needed.
Here are the steps to read and write an Excel file using Python:
- Create a Workbook object.
- Load an Excel file from a given file path.
- Get a specific worksheet using the Workbook.Worksheets[index] property.
- Get a specific cell using the Worksheet.Range property
- Get or set the cell value using the CellRange.Value property.
- Save the workbook to a different Excel file.
- Python
from spire.xls import *
from spire.xls.common import *

# Create a Workbook object
workbook = Workbook()

# Load an Excel file
workbook.LoadFromFile("C:\\Users\\Administrator\\Desktop\\Input.xlsx")

# Get a specific worksheet
worksheet = workbook.Worksheets[0]

# Get a specific cell
cell = worksheet.Range["A1"]

# Read the cell value
cellValue = cell.Value

# Determine if the cell value is "Department"
if (cellValue  == "Department"):

    # Update the cell value
    cell.Value = "Dept."

# Save the workbook to a different
workbook.SaveToFile("ModifyExcel.xlsx", ExcelVersion.Version2016)

# Dispose resources
workbook.Dispose()
Apply Formatting to Excel Cells in Python
Formatting Excel documents is essential for producing professional-looking reports that effectively communicate information. Spire.XLS for Python offers a comprehensive suite of APIs within the CellRange class, empowering developers to manage various formatting options seamlessly. This includes adjusting font styles, selecting cell colors, aligning text, and modifying row heights and column widths.
Here are the steps to apply styles and formats to Excel cells using Python:
- Create a Workbook object.
- Load an Excel file from a given file path.
- Get a specific worksheet using the Workbook.Worksheets[index] property.
- Get all located range using the Worksheet.AllocatedRange property.
- Get a specific row using the CellRange.Rows[index] property, and set the cell color, text color, text alignment, and row height using the properties under the CellRange object.
- Get a specific column using the CellRange.Columns[index] property, and set the column width using the ColumnWidth property under the CellRange object.
- Save the workbook to a different Excel file.
- Python
from spire.xls import *
from spire.xls.common import *

# Create a Workbook object
workbook = Workbook()

# Load an Excel file
workbook.LoadFromFile("C:\\Users\\Administrator\\Desktop\\Input.xlsx")

# Get a specific worksheet
worksheet = workbook.Worksheets[0]

# Get all located range from the worksheet
allocatedRange = worksheet.AllocatedRange

#Iterate through the rows
for rowNum in range(0, allocatedRange.RowCount):
    if rowNum == 0:

        # Apply cell color to the header row
        allocatedRange.Rows[rowNum].Style.Color = Color.get_Black()

        # Change the font color of the header row
        allocatedRange.Rows[rowNum].Style.Font.Color = Color.get_White()
    else:
        # Apply alternate colors to other rows
        if rowNum % 2 == 1:
            allocatedRange.Rows[rowNum].Style.Color = Color.get_LightGray()
        else:
            allocatedRange.Rows[rowNum].Style.Color = Color.get_White()

    # Align text to center
    allocatedRange.Rows[rowNum].HorizontalAlignment = HorizontalAlignType.Center
    allocatedRange.Rows[rowNum].VerticalAlignment = VerticalAlignType.Center

    # Set the row height
    allocatedRange.Rows[rowNum].RowHeight = 20

# Iterate through the columns
for columnNum in range(0, allocatedRange.ColumnCount):
    if (columnNum > 0):

        # Set the column width
        allocatedRange.Columns[columnNum].ColumnWidth = 10

# Save the workbook to a different
workbook.SaveToFile("FormatExcel.xlsx", ExcelVersion.Version2016)

# Dispose resources
workbook.Dispose()

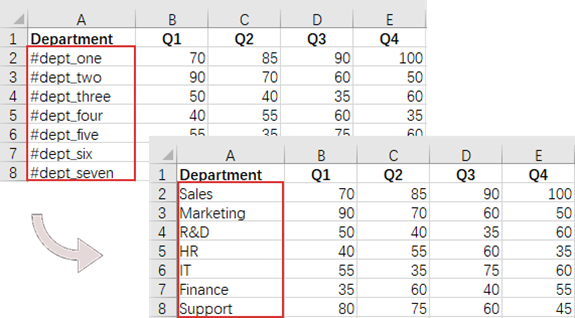
Find and Replace Text in Excel in Python
The find and replace functionality in Excel enables users to swiftly locate specific text within their spreadsheets and substitute it with new content, which is particularly useful for data corrections and updates. With Spire.XLS for Python, you can efficiently locate a cell containing a specific string using the Worksheet.FindString() method. Once identified, you can easily replace its value using the CellRange.Value property.
Here are the steps to find and replace text in Excel using Python:
- Create a Workbook object.
- Load an Excel file from a given file path.
- Get a specific worksheet using the Workbook.Worksheets[index] property.
- Find the cell that contains a specified string using the Worksheet.FindString() method.
- Update the cell value using the CellRange.Value property.
- Save the workbook to a different Excel file.
- Python
from spire.xls import *
from spire.xls.common import *

# Create a Workbook object
workbook = Workbook()

# Load an Excel file
workbook.LoadFromFile("C:\\Users\\Administrator\\Desktop\\Input.xlsx")

# Get a specific worksheet
worksheet = workbook.Worksheets[0]

# Define a list of department names for replacement
departments = ["Sales", "Marketing", "R&D", "HR", "IT", "Finance", "Support"]

# Define a list of placeholders that will be replaced in the Excel sheet
placeholders = ["#dept_one", "#dept_two", "#dept_three", "#dept_four", "#dept_five", "#dept_six", "#dept_seven"]

# Iterate through the placeholder strings
for i in range (0, len(placeholders)):

    # Find the cell containing the current placeholder string
    cell = worksheet.FindString(placeholders[i], False, False)

    # Replace the value in the found cell with the corresponding department name
    cell.Value = departments[i]


# Save the workbook to a different
workbook.SaveToFile("ReplaceText.xlsx", ExcelVersion.Version2016)

# Dispose resources
workbook.Dispose()
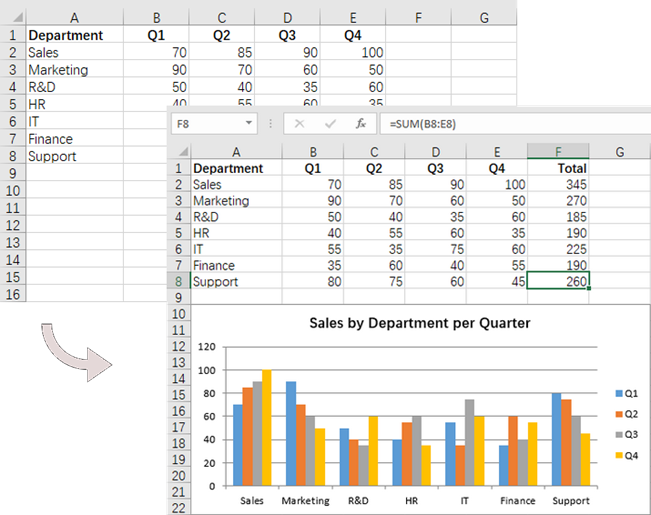
Add Formulas and Charts to Excel in Python
In addition to basic file operations, Spire.XLS for Python provides a variety of advanced techniques for working with Excel files. For example, you can insert formulas into cells using the CellRange.Formula property, which allows for real-time calculations and data analysis directly within your spreadsheet. Furthermore, it allows you to create visually appealing data presentations by adding charts to your worksheets using the Worksheet.Charts.Add() method.
Here are the steps to add formulas and charts to Excel using Python:
- Create a Workbook object.
- Load an Excel file from a given file path.
- Get a specific worksheet using the Workbook.Worksheets[index] property.
- Get a specific cell using the Worksheet.Range property.
- Add a formula to the cell using the CellRange.Formula property.
- Add a column chart to the worksheet using the Worksheet.Charts.Add() method.
- Set the chart data range, position, title and other attributes using the properties under the Chart object.
- Save the workbook to a different Excel file.
- Python
from spire.xls import *
from spire.xls.common import *

# Create a Workbook object
workbook = Workbook()

# Load an Excel file
workbook.LoadFromFile("C:\\Users\\Administrator\\Desktop\\Input.xlsx")

# Get a specific worksheet
worksheet = workbook.Worksheets[0]

# Get all located range
allocatedRange = worksheet.AllocatedRange

#Iterate through the rows
for rowNum in range(0, allocatedRange.RowCount):
    if (rowNum == 0):

        # Write text to cell G1
        worksheet.Range[rowNum + 1, 6].Text = "Total"

        # Apply style to the cell
        worksheet.Range[rowNum + 1, 6].Style.Font.IsBold = True
        worksheet.Range[rowNum + 1, 6].Style.HorizontalAlignment = HorizontalAlignType.Right
    else:

        # Add formulas to the cells from G2 to G8
        worksheet.Range[rowNum + 1, 6].Formula = f"=SUM(B{rowNum + 1}:E{rowNum + 1})"

# Add a clustered column chart
chart = worksheet.Charts.Add(ExcelChartType.ColumnClustered)

# Set data range for the chart
chart.DataRange = worksheet.Range["A1:E8"]
chart.SeriesDataFromRange = False

# Set position of the chart
chart.LeftColumn = 1
chart.TopRow = 10
chart.RightColumn = 8
chart.BottomRow = 23

# Set and format chart title
chart.ChartTitle = "Sales by Department per Quarter"
chart.ChartTitleArea.Size = 13
chart.ChartTitleArea.IsBold = True

# Save the workbook to a different
workbook.SaveToFile("AddFormulaAndChart.xlsx", ExcelVersion.Version2016)

# Dispose resources
workbook.Dispose()
Apply for a Temporary License
If you'd like to remove the evaluation message from the generated documents, or to get rid of the function limitations, please request a 30-day trial license for yourself.
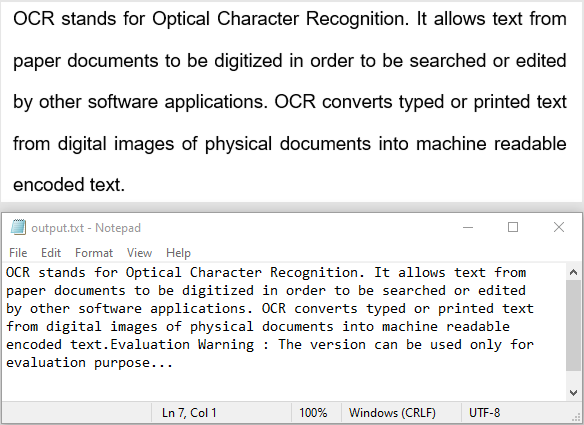
In today's digital world, extracting text from images has become essential for many fields, including business, education, and data analysis. OCR (Optical Character Recognition) technology makes this process effortless by converting text in images into editable and searchable formats quickly and accurately. Whether it's turning handwritten notes into digital files or pulling key information from scanned documents, OCR simplifies tasks and makes work more efficient. In this article, we will demonstrate how to recognize text from images in Python using Spire.OCR for Python.
Install Spire.OCR for Python
This scenario requires Spire.OCR for Python and plum-dispatch v1.7.4. They can be easily installed in your Windows through the following pip command.
pip install Spire.OCR
Download the Model of Spire.OCR for Python
Spire.OCR for Python provides different recognition models for different operating systems. Download the model suited to your system from one of the links below:
- Windows: win-x64.zip
- Linux: linux.zip
- macOS: mac.zip
- linux_aarch: linux_aarch.zip
After downloading, extract the package and save it to a specific directory on your system.
Recognize Text from Images in Python
Spire.OCR for Python offers the OcrScanner.Scan() method to recognize text from images. Once the recognition is complete, you can use the OcrScanner.Text property to retrieve the recognized text and then save it to a file for further use. The detailed steps are as follows.
- Create an instance of the OcrScanner class to handle OCR operations.
- Create an instance of the ConfigureOptions class to configure the OCR settings.
- Specify the file path to the model and the desired recognition language through the ConfigureOptions.ModelPath and ConfigureOptions.Language properties.
- Apply the configuration settings to the OcrScanner instance using the OcrScanner.ConfigureDependencies() method.
- Call the OcrScanner.Scan() method to perform text recognition on the image.
- Retrieve the recognized text using the OcrScanner.Text property.
- Save the extracted text to a file for further use.
- Python
from spire.ocr import *

# Create an instance of the OcrScanner class
scanner = OcrScanner()

# Configure OCR settings
configureOptions = ConfigureOptions()
# Set the file path to the model
configureOptions.ModelPath = r'D:\OCR\win-x64'
# Set the recognition language. Supported languages include English, Chinese, Chinesetraditional, French, German, Japanese, and Korean.
configureOptions.Language = 'English'
# Apply the settings to the OcrScanner instance
scanner.ConfigureDependencies(configureOptions)

# Recognize text from the image
scanner.Scan(r'Sample.png')

# Retrieve the recognized text and save it to a file
text = scanner.Text.ToString() + '\n'
with open('output.txt', 'a', encoding='utf-8') as file:
    file.write(text + '\n')
Recognize Text with Coordinates from Images in Python
In scenarios where you need the exact position of text in an image, such as for layout analysis or advanced data processing, extracting coordinate information is essential. With Spire.OCR for Python, you can retrieve recognized text block by block. Each text block includes detailed positional data such as the x and y coordinates, width, and height. The detailed steps are as follows.
- Create an instance of the OcrScanner class to handle OCR operations.
- Create an instance of the ConfigureOptions class to configure the OCR settings.
- Specify the file path to the model and the desired recognition language through the ConfigureOptions.ModelPath and ConfigureOptions.Language properties.
- Apply the configuration settings to the OcrScanner instance using the OcrScanner.ConfigureDependencies() method.
- Call the OcrScanner.Scan() method to perform text recognition on the image.
- Retrieve the recognized text using the OcrScanner.Text property.
- Iterate through the text blocks in the recognized text. For each block, use the IOCRTextBlock.Text property to get the text and the IOCRTextBlock.Box property to retrieve positional details (x, y, width, and height).
- Save the results to a text file for further analysis.
- Python
from spire.ocr import *

# Create an instance of the OcrScanner class
scanner = OcrScanner()

# Configure OCR settings
configureOptions = ConfigureOptions()
# Set the file path to the model
configureOptions.ModelPath = r'D:\OCR\win-x64'
# Set the recognition language. Supported languages include English, Chinese, Chinesetraditional, French, German, Japanese, and Korean.
configureOptions.Language = 'English'
# Apply the settings to the OcrScanner instance
scanner.ConfigureDependencies(configureOptions)

# Recognize text from the image
scanner.Scan(r'sample.png')
# Retrieve the recognized text
text = scanner.Text

# Iterate through the text blocks in the recognized text. For each text block, retrieve its text and positional data (x, y, width, and height)
block_text = ""
for block in text.Blocks:
    rectangle = block.Box
    block_info = f'{block.Text} -> x: {rectangle.X}, y: {rectangle.Y}, w: {rectangle.Width}, h: {rectangle.Height}'
    block_text += block_info + '\n'

# Save the results to a file
with open('output.txt', 'a', encoding='utf-8') as file:
    file.write(block_text + '\n')

Apply for a Temporary License
If you'd like to remove the evaluation message from the generated documents, or to get rid of the function limitations, please request a 30-day trial license for yourself.
Python: Dynamically Create, Read, and Modify Excel Files by Byte Streams
2025-01-07 01:19:20 Written by KoohjiIn Excel file processing, using byte streams in Python to create, read, and modify Excel files enables efficient data manipulation and automation. This approach eliminates reliance on physical storage or local filesystems, making it ideal for cloud-based or memory-constrained environments. It also supports real-time data exchange, system integration, and instant feedback in web applications, promoting rapid development and adaptable workflows. In this article, we will explore how to use Spire.XLS for Python to dynamically process Excel workbooks by byte streams with simple Python code.
- Create Excel Files and Save as Byte Streams in Python
- Read Excel Files from Byte Streams in Python
- Modify Excel Files from Byte Streams in Python
Install Spire.XLS for Python
This scenario requires Spire.XLS for Python and plum-dispatch v1.7.4. They can be easily installed in your Windows through the following pip commands.
pip install Spire.XLS
If you are unsure how to install, please refer to: How to Install Spire.XLS for Python on Windows
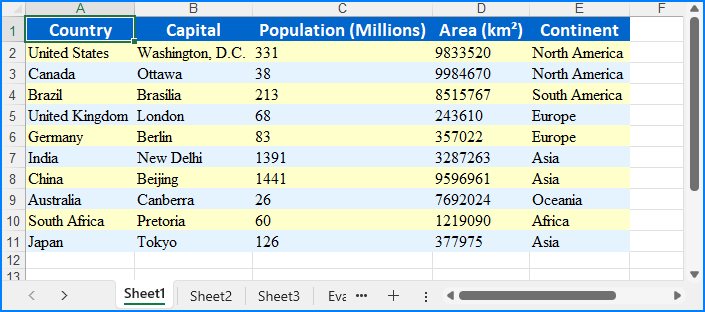
Create Excel Files and Save as Byte Streams in Python
With Spire.XLS for Python, we can create an Excel workbook by initializing a Workbook instance and populating it with data. Once the workbook is ready, we can save it to a Stream object and convert that stream into a bytes object for further use or storage. This method allows us to efficiently generate Excel files in memory without the need for disk storage.
Below are the steps for creating an Excel file and saving it as a byte stream with Python:
- Create an instance of the Workbook class to initialize a new Excel workbook. The new workbook includes three default worksheets.
- Retrieve a worksheet using the Workbook.Worksheets.get_Item() method.
- Create a data list or obtain it from another source.
- Iterate through rows and columns to populate the worksheet with data using the Worksheet.Range.get_Item().Value or NumberValue properties.
- Format cells using the properties available in CellRange.Style.
- Create a Stream object and save the workbook to it using the Workbook.SaveToStream() method.
- Convert the stream to a bytes object using the Stream.ToArray() method.
- Python
from spire.xls import Workbook, FileFormat, Stream, Color, HorizontalAlignType
# Create an instance of Workbook class
workbook = Workbook()
# Get the first worksheet
sheet = workbook.Worksheets.get_Item(0)
# Create a 2D list of data or read data from other sources
data = [
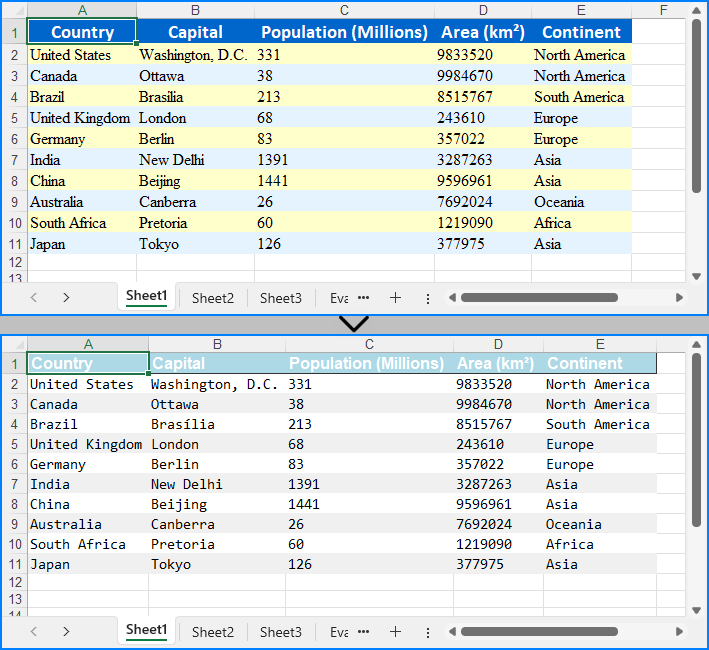
["Country", "Capital", "Population (Millions)", "Area (km²)", "Continent"],
["United States", "Washington, D.C.", 331, 9833520, "North America"],
["Canada", "Ottawa", 38, 9984670, "North America"],
["Brazil", "Brasília", 213, 8515767, "South America"],
["United Kingdom", "London", 68, 243610, "Europe"],
["Germany", "Berlin", 83, 357022, "Europe"],
["India", "New Delhi", 1391, 3287263, "Asia"],
["China", "Beijing", 1441, 9596961, "Asia"],
["Australia", "Canberra", 26, 7692024, "Oceania"],
["South Africa", "Pretoria", 60, 1219090, "Africa"],
["Japan", "Tokyo", 126, 377975, "Asia"]
]
# Insert the data into the worksheet
for i, row in enumerate(data):
for j, value in enumerate(row):
if isinstance(value, str):
sheet.Range.get_Item(i + 1, j + 1).Value = value
else:
sheet.Range.get_Item(i + 1, j + 1).NumberValue = value
# Format the header row with new colors
headerRow = sheet.AllocatedRange.Rows.get_Item(0)
headerRow.Style.Color = Color.FromRgb(0, 102, 204) # Blue color for the header
headerRow.Style.Font.FontName = "Calibri"
headerRow.Style.Font.Size = 14
headerRow.Style.Font.IsBold = True
headerRow.Style.Font.Color = Color.FromRgb(255, 255, 255) # White text
headerRow.Style.HorizontalAlignment = HorizontalAlignType.Center
# Format the data rows with new alternating colors
for i in range(1, sheet.AllocatedRange.Rows.Count):
row = sheet.AllocatedRange.Rows.get_Item(i)
row.Style.Font.FontName = "Times New Roman"
row.Style.Font.Size = 12
row.Style.HorizontalAlignment = HorizontalAlignType.Left
if i % 2 == 0:
row.Style.Color = Color.FromRgb(229, 243, 255) # Light blue for even rows
else:
row.Style.Color = Color.FromRgb(255, 255, 204) # Light yellow for odd rows
# Auto-fit the columns
for i in range(sheet.AllocatedRange.Columns.Count):
sheet.AutoFitColumn(i + 1)
# Create a Stream object
stream = Stream()
# Save the workbook to the stream
workbook.SaveToStream(stream, FileFormat.Version2016)
workbook.Dispose()
# Convert the stream to bytes
bytes_data = stream.ToArray()
# Write the bytes to a file or use them as needed
with open("output/CreateExcelByStream.xlsx", "wb") as file:
file.write(bytes_data)
Read Excel Files from Byte Streams in Python
To load an Excel workbook from a byte stream, we can convert the byte data into a Stream object and load it into a Workbook instance. Then, we can then access the worksheet data to extract and utilize the data within the Python application seamlessly.
The steps for reading Excel files from byte streams using Python are as follows:
- Create or convert to a bytes object for the Excel file, or use an existing one.
- Create a Stream object from the bytes.
- Instantiate the Workbook class and load the Excel file from the Stream object using the Workbook.LoadFromStream() method.
- Retrieve a worksheet using the Workbook.Worksheets.get_Item() method.
- Iterate through rows and columns to access cell values using the Worksheet.AllocatedRange.get_Item().Value property.
- Output the values or utilize them as needed.
- Python
from spire.xls import Workbook, Stream

# Create a bytes object or use an existing one
with open("output/CreateExcelByStream.xlsx", "rb") as file:
    bytes_data = file.read()

# Create an instance of the Workbook class
workbook = Workbook()

# Load the Excel file from the byte stream
workbook.LoadFromStream(Stream(bytes_data))

# Get the first worksheet
sheet = workbook.Worksheets.get_Item(0)

# Read data from the worksheet
# Create a list to store the data
data = []
for i in range(sheet.AllocatedRange.Rows.Count):
    # Retrieve a row of data
    row = sheet.AllocatedRange.Rows.get_Item(i)
    # Create a list to store the row's data
    row_data = []
    for j in range(row.Cells.Count):
        # Get the value of the cell
        cellValue = sheet.AllocatedRange.get_Item(i + 1, j + 1).Value
        row_data.append(cellValue)
    data.append(row_data)

# Display the data or use it as needed
for row in data:
    print(row)

# Release resources
workbook.Dispose()
Modify Excel Files from Byte Streams in Python
Modifying Excel files from byte streams enables us to update or enhance data dynamically without saving it to disk. This method involves loading the byte stream into a Workbook instance, making changes to its content or formatting, and saving the changes back to a byte stream for reuse.
The following steps show how to modify an Excel workbook from a byte stream using Python:
- Create or convert to a bytes object of the Excel file, or use an existing one.
- Initialize a Stream object from the bytes and load it into a Workbook using the Workbook.LoadFromStream() method.
- Access a worksheet using the Workbook.Worksheets.get_Item() method.
- Modify cell values with the Worksheet.AllocatedRange.get_Item().Value property.
- Format cells using properties in CellRange.Style and add borders with the CellRange.BorderAround() method or the CellRange.BorderInside() method.
- Auto-fit column widths using the Worksheet.AutoFitColumn() method.
- Save the workbook to a new Stream object using the Workbook.SaveToStream() method and convert it back to bytes or bytearray using Stream.ToArray() method.
- Python
from spire.xls import Workbook, Stream, HorizontalAlignType, Color, FileFormat

# Create a bytes object or use an existing one
with open("output/CreateExcelByStream.xlsx", "rb") as file:
    bytes_data = file.read()

# Create an instance of the Workbook class
workbook = Workbook()

# Load the Excel file from the byte stream
stream = Stream(bytes_data)
workbook.LoadFromStream(stream)
stream.Close()

# Remove unnecessary worksheets (commented out in this case)
#for i in range(1, workbook.Worksheets.Count):
#    workbook.Worksheets.RemoveAt(i)

# Get the first worksheet
sheet = workbook.Worksheets.get_Item(0)

# Modify the style of the header row
headerRow = sheet.AllocatedRange.Rows.get_Item(0)
headerRow.Style.Font.Bold = False
headerRow.Style.Font.FontName = "Arial"
headerRow.Style.Font.Size = 12
headerRow.Style.HorizontalAlignment = HorizontalAlignType.Left
headerRow.Style.Color = Color.FromRgb(173, 216, 230) # Light blue background color
# Add outline borders for the header row
headerRow.BorderAround()

# Modify the style of the data rows
for i in range(1, sheet.AllocatedRange.Rows.Count):
    row = sheet.AllocatedRange.Rows.get_Item(i)
    row.Style.Font.FontName = "Consolas"
    row.Style.Font.Size = 11
    if i % 2 == 0:
        row.Style.Color = Color.FromRgb(240, 240, 240)  # Light gray background color for even rows
    else:
        row.Style.Color = Color.FromRgb(255, 255, 255)  # White background color for odd rows

# Auto-adjust the column widths
for i in range(sheet.AllocatedRange.Columns.Count):
    sheet.AutoFitColumn(i + 1)

# Save the modified Excel file
streamTemp = Stream()
workbook.SaveToStream(streamTemp, FileFormat.Version2016)
workbook.Dispose()

# Convert the stream to bytes
bytes_data = streamTemp.ToArray()

# Write the bytes to a file or use them as needed
with open("output/ModifiedExcel.xlsx", "wb") as file:
    file.write(bytes_data)
Apply for a Temporary License
If you'd like to remove the evaluation message from the generated documents, or to get rid of the function limitations, please request a 30-day trial license for yourself.
Spire.OCR for Python is a robust and professional Optical Character Recognition (OCR) library that enables developers to extract text from images in various formats, including JPG, PNG, GIF, BMP, and TIFF. It provides an intuitive and straightforward solution for integrating OCR capabilities into Python applications, allowing users to extract text from popular image formats with just a few lines of code.
The library supports text recognition in commonly used fonts like Arial, Times New Roman, Courier New, Verdana, Tahoma, and Calibri, with regular, bold, and italic text styles. It also enables developers to recognize text in multiple languages, including English, Chinese, French, German, Japanese, and Korean, making it a versatile tool for global applications.
Python: Add, Extract and Remove Custom Document Properties in Word Documents
2024-12-23 01:00:11 Written by AdministratorCustom document properties are user-defined fields within a Word document that store specific metadata. Unlike standard properties, such as title, author, or subject, which are predefined by Microsoft Word, these custom properties provide users with the flexibility to define and manage additional metadata fields according to their specific requirements. In this article, we will demonstrate how to add, extract, and remove custom document properties in Word documents in Python using Spire.Doc for Python.
- Add Custom Document Properties to Word in Python
- Extract Custom Document Properties in Word in Python
- Remove Custom Document Properties from Word in Python
Install Spire.Doc for Python
This scenario requires Spire.Doc for Python and plum-dispatch v1.7.4. They can be easily installed in your Windows through the following pip command.
pip install Spire.Doc
If you are unsure how to install, please refer to this tutorial: How to Install Spire.Doc for Python on Windows
Add Custom Document Properties to Word in Python
Spire.Doc for Python provides the CustomDocumentProperties.Add() method, which enables developers to assign different types of values, such as text, time, numeric, or yes or no, to the custom properties of a Word document. The steps below demonstrate how to add custom document properties with different types of values to a Word document using Spire.Doc for Python.
- Initialize an instance of the Document class.
- Load a Word document using the Document.LoadFromFile() method.
- Get the custom document properties of the document through the Document.CustomDocumentProperties property.
- Add custom document properties with different data types to the document using the CustomDocumentProperties.Add(name, value) method.
- Save the result document using the Document.SaveToFile() method.
- Python
from spire.doc import *
from spire.doc.common import *

# Create a Document object
document = Document()
# Load a Word document
document.LoadFromFile("Example.docx")

# Add custom document properties with different types of values to the document
customProperties = document.CustomDocumentProperties
customProperties.Add("DocumentCategory", String("Technical Report"))
customProperties.Add("RevisionNumber", Int32(5))
customProperties.Add("LastReviewedDate", DateTime(2024, 12, 1, 0, 0, 0, 0))
customProperties.Add("RequiresFollowUp", Boolean(False))

# Save the result document
document.SaveToFile("AddCustomDocumentProperties.docx", FileFormat.Docx2016)
document.Close()

Extract Custom Document Properties in Word in Python
Extracting custom document properties allows developers to access metadata for further analysis, reporting, or integration into other applications. Spire.Doc for Python makes it simple to retrieve the details of these properties using the CustomDocumentProperty.Name and CustomDocumentProperty.Value properties. The detailed steps are as follows.
- Initialize an instance of the Document class.
- Load a Word document using the Document.LoadFromFile() method.
- Get the custom document properties of the document through the Document.CustomDocumentProperties property.
- Iterate through the custom document properties.
- Extract the name and value of each custom document property.
- Save the extracted data to a text file.
- Python
from spire.doc import *
from spire.doc.common import *
# Create a Document object
document = Document()
# Load a Word document
document.LoadFromFile("AddCustomDocumentProperties.docx")
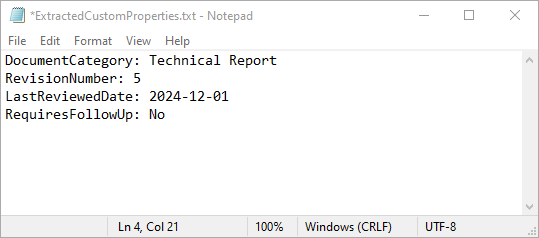
# Open a text file to save the extracted custom properties
with open("ExtractedCustomProperties.txt", "w") as output_file:
# Iterate through all custom document properties
for i in range(document.CustomDocumentProperties.Count):
# Extract the name and value of each custom property
property_name = document.CustomDocumentProperties.get_Item(i).Name
property_value = document.CustomDocumentProperties.get_Item(i).Value
# Write the property details to the text file
output_file.write(f"{property_name}: {property_value}\n")
document.Close()
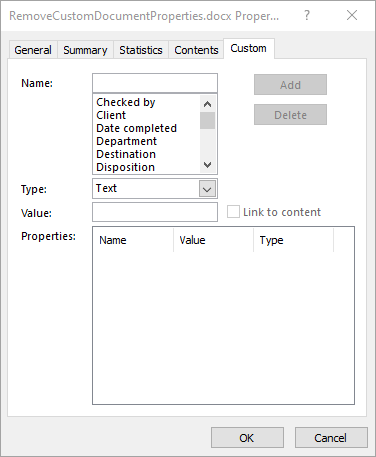
Remove Custom Document Properties from Word in Python
Cleaning up custom document properties is crucial for maintaining confidentiality, reducing file size, and ensuring metadata does not contain outdated or irrelevant information. Spire.Doc for Python allows developers to remove custom properties from a Word document using the DocumentProperties.Remove() method. The detailed steps are as follows.
- Initialize an instance of the Document class.
- Load a Word document using the Document.LoadFromFile() method.
- Get the custom document properties of the document through the Document.CustomDocumentProperties property.
- Iterate through the custom document properties.
- Remove each custom document property through its name using the DocumentProperties.Remove() method.
- Save the result document using the Document.SaveToFile() method.
- Python
from spire.doc import *
from spire.doc.common import *

# Create a Document object
document = Document()
# Load a Word document
document.LoadFromFile("AddCustomDocumentProperties.docx")

# Iterate through all custom document properties
customProperties = document.CustomDocumentProperties
for i in range(customProperties.Count - 1, -1, -1):
    # Remove each custom document property by its name
    customProperties.Remove(customProperties[i].Name)

# Save the result document
document.SaveToFile("RemoveCustomDocumentProperties.docx", FileFormat.Docx2016)
document.Close()
Apply for a Temporary License
If you'd like to remove the evaluation message from the generated documents, or to get rid of the function limitations, please request a 30-day trial license for yourself.
While Word is a powerful tool for creating and formatting documents, it is not optimized for advanced data management and analysis. In contrast, Excel excels at handling data in tabular form, allowing users to perform calculations, create charts, and conduct thorough data analysis.
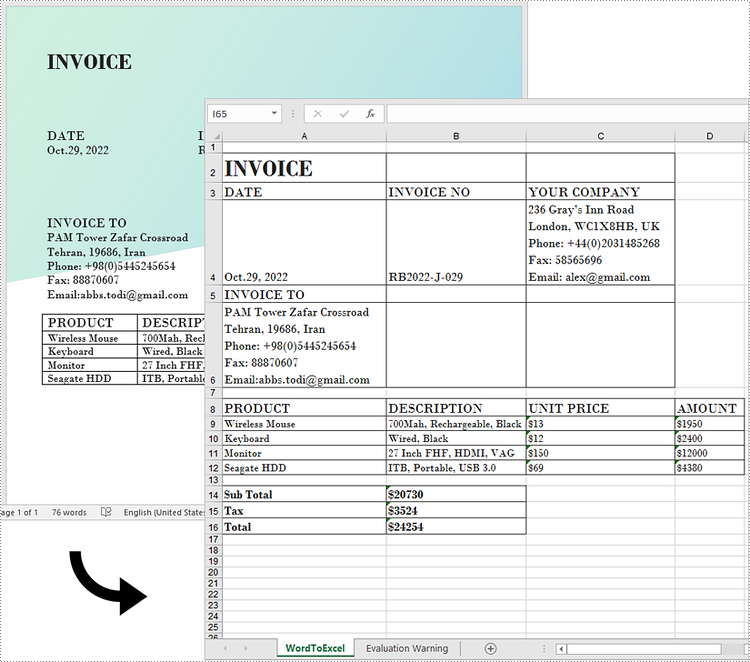
Generally, converting complex Word documents into Excel spreadsheets is not advisable, as Excel may struggle to preserve the original layout. However, if your Word document primarily consists of tables, converting it to Excel can be highly beneficial. This transformation unlocks Excel's advanced functions, formulas, and visualization tools, enabling you to organize your data more effectively and improve your reporting and decision-making capabilities. In this article, we will focus specifically on how to convert this kind of Word documents to Excel in Python using Spire.Office for Python.
Install Spire.Office for Python
This scenario requires Spire.Office for Python and plum-dispatch v1.7.4. They can be easily installed in your Windows through the following pip command.
pip install Spire.Office
Convert Word to Excel in Python
This process uses two libraries in the Spire.Office for Python package. They're Spire.XLS for Python and Spire.Doc for Python. The former is used to read and extract content from a Word document, and the latter is used to create an Excel document and write data in specific cells. To make this code example easy to understand, we have defined the following three custom methods that handle specific tasks:
- ExportTableInExcel() - Export data from a Word table to specified Excel cells.
- CopyContentInTable() - Copy content from a table cell in Word to an Excel cell.
- CopyTextAndStyle() - Copy text with formatting from a Word paragraph to an Excel cell.
The following steps demonstrate how to export data from an entire Word document to an Excel worksheet using Spire.Office for Python.
- Create a Document object to load a Word file.
- Create a Worbbook object and add a worksheet named "WordToExcel" to it.
- Traverse through all the sections in the Word document and all the document objects under a certain section, and then determine if a document object is a paragraph or a table.
- If the document object is a paragraph, write the paragraph in a specified cell in Excel using CoypTextAndStyle() method.
- If the document object is a table, export the table data from Word to Excel cells using ExportTableInExcel() method.
- Auto fit the row height and column width in Excel so that the data within a cell will not exceed the bound of the cell.
- Save the workbook to an Excel file using Workbook.SaveToFile() method.
- Python
from spire.xls import *
from spire.doc import *

# Export data from Word table to Excel cells
def ExportTableInExcel(worksheet, row, table):
    for rowIndex in range(len(table.Rows)):
        tbRow = table.Rows[rowIndex]
        column = 1
        for cellIndex in range(len(tbRow.Cells)):
            tbCell = tbRow.Cells[cellIndex]
            cell = worksheet.Range[row, column]
            cell.BorderAround()
            CopyContentInTable(worksheet, tbCell, cell)
            column += 1
        row += 1
    return row

# Copy content from a Word table cell to an Excel cell
def CopyContentInTable(worksheet, tbCell, cell):
    newPara = Paragraph(tbCell.Document)
    for i in range(len(tbCell.ChildObjects)):
        documentObject = tbCell.ChildObjects[i]
        if isinstance(documentObject, Paragraph):
            paragraph = documentObject
            for cObj in range(len(paragraph.ChildObjects)):
                newPara.ChildObjects.Add(paragraph.ChildObjects[cObj].Clone())
            if i < len(tbCell.ChildObjects) - 1:
                newPara.AppendText("\n")
    CopyTextAndStyle(worksheet, cell, newPara)

# Copy text and style of a paragraph to a cell
def CopyTextAndStyle(worksheet, cell, paragraph):
    richText = cell.RichText
    richText.Text = paragraph.Text
    startIndex = 0
    for documentObject in range(len(paragraph.ChildObjects)):
        documentObject = paragraph.ChildObjects[documentObject]
        if isinstance(documentObject, TextRange):
            textRange = documentObject
            fontName = textRange.CharacterFormat.FontName
            isBold = textRange.CharacterFormat.Bold
            textColor = textRange.CharacterFormat.TextColor
            fontSize = textRange.CharacterFormat.FontSize
            textRangeText = textRange.Text
            strLength = len(textRangeText)
            font = worksheet.Workbook.CreateFont()
            font.Color = textColor
            font.IsBold = isBold
            font.Size = fontSize
            font.FontName = fontName
            endIndex = startIndex + strLength
            richText.SetFont(startIndex, endIndex, font)
            startIndex += strLength
        if isinstance(documentObject, DocPicture):
            picture = documentObject
            worksheet.Pictures.Add(cell.Row, cell.Column, picture.Image)
            worksheet.SetRowHeightInPixels(cell.Row, 1, picture.Image.Height)

    if paragraph.Format.HorizontalAlignment == HorizontalAlignment.Left:
        cell.Style.HorizontalAlignment = HorizontalAlignType.Left
    elif paragraph.Format.HorizontalAlignment == HorizontalAlignment.Center:
        cell.Style.HorizontalAlignment = HorizontalAlignType.Center
    elif paragraph.Format.HorizontalAlignment == HorizontalAlignment.Right:
        cell.Style.HorizontalAlignment = HorizontalAlignType.Right

# Create a Document object
doc = Document()
# Load a Word file
doc.LoadFromFile("C:/Users/Administrator/Desktop/Invoice.docx")

# Create a Workbook object
wb = Workbook()
# Remove the default worksheets
wb.Worksheets.Clear()

# Create a worksheet named "WordToExcel"
worksheet = wb.CreateEmptySheet("WordToExcel")
row = 1
column = 1

# Loop through the sections in the Word document
for sec_index in range(doc.Sections.Count):
    section = doc.Sections[sec_index]
    # Loop through the document object under a certain section
    for obj_index in range(section.Body.ChildObjects.Count):
        documentObject = section.Body.ChildObjects[obj_index]
        # Determine if the object is a paragraph
        if isinstance(documentObject, Paragraph):
            cell = worksheet.Range[row, column]
            paragraph = documentObject
            # Copy paragraph from Word to a specific cell
            CopyTextAndStyle(worksheet, cell, paragraph)
            row += 1

        # Determine if the object is a table
        if isinstance(documentObject, Table):
            table = documentObject
            # Export table data from Word to Excel
            currentRow = ExportTableInExcel(worksheet, row, table)
            row = currentRow

# Auto fit row height and column width
worksheet.AllocatedRange.AutoFitRows()
worksheet.AllocatedRange.AutoFitColumns()

# Wrap text in cells
worksheet.AllocatedRange.IsWrapText = True

# Save the workbook to an Excel file
wb.SaveToFile("WordToExcel.xlsx", ExcelVersion.Version2013)
wb.Dispose()
doc.Dispose()
Get a Free License
To fully experience the capabilities of Spire.Doc for Python without any evaluation limitations, you can request a free 30-day trial license.
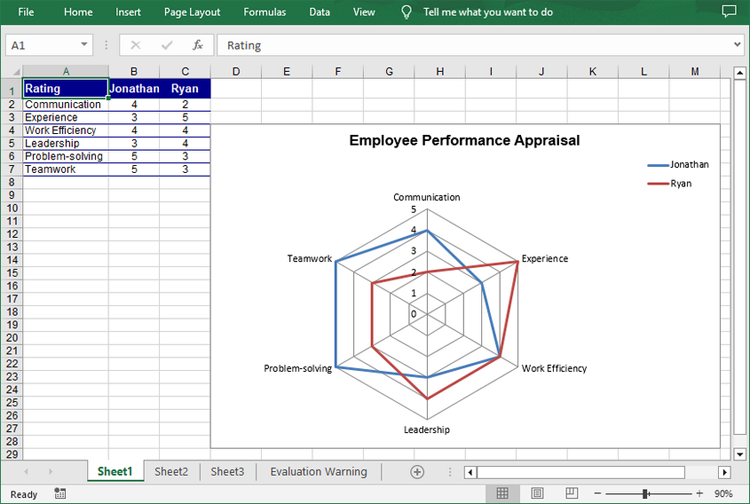
A radar chart, also known as a spider chart, is a graphical method of displaying multivariate data in two dimensions. Each spoke on the chart represents a different variable, and data points are plotted along these spokes. Radar charts are particularly useful for comparing the performance of different entities across several criteria. This article will demonstrate how to create a radar chart in Excel in Python using Spire.XLS for Python.
Install Spire.XLS for Python
This scenario requires Spire.XLS for Python and plum-dispatch v1.7.4. They can be easily installed in your Windows through the following pip command.
pip install Spire.XLS
If you are unsure how to install, please refer to this tutorial: How to Install Spire.XLS for Python on Windows
Create a Simple Radar Chart in Excel in Python
Spire.XLS for Python provides the Worksheet.Charts.Add(ExcelChartType.Radar) method to add a standard radar chart to an Excel worksheet. The following are the detailed steps:
- Create a Workbook instance.
- Get a specified worksheet using Workbook.Worksheets[] property.
- Add the chart data to specified cells and set the cell styles.
- Add a simple radar chart to the worksheet using Worksheet.Charts.Add(ExcelChartType.Radar) method.
- Set data range for the chart using Chart.DataRange property.
- Set the position, legend and title of the chart.
- Save the result file using Workbook.SaveToFile() method.
- Python
*from spire.xls import *
from spire.xls.common import *

# Create a Workbook instance
workbook = Workbook()

# Get the first worksheet
sheet = workbook.Worksheets[0]

# Add chart data to specified cells
sheet.Range["A1"].Value = "Rating"
sheet.Range["A2"].Value = "Communication"
sheet.Range["A3"].Value = "Experience"
sheet.Range["A4"].Value = "Work Efficiency"
sheet.Range["A5"].Value = "Leadership"
sheet.Range["A6"].Value = "Problem-solving"
sheet.Range["A7"].Value = "Teamwork"

sheet.Range["B1"].Value = "Jonathan"
sheet.Range["B2"].NumberValue = 4
sheet.Range["B3"].NumberValue = 3
sheet.Range["B4"].NumberValue = 4
sheet.Range["B5"].NumberValue = 3
sheet.Range["B6"].NumberValue = 5
sheet.Range["B7"].NumberValue = 5

sheet.Range["C1"].Value = "Ryan"
sheet.Range["C2"].NumberValue = 2
sheet.Range["C3"].NumberValue = 5
sheet.Range["C4"].NumberValue = 4
sheet.Range["C5"].NumberValue = 4
sheet.Range["C6"].NumberValue = 3
sheet.Range["C7"].NumberValue = 3

# Set font styles
sheet.Range["A1:C1"].Style.Font.IsBold = True
sheet.Range["A1:C1"].Style.Font.Size = 11
sheet.Range["A1:C1"].Style.Font.Color = Color.get_White()

# Set row height and column width
sheet.Rows[0].RowHeight = 20
sheet.Range["A1:C7"].Columns[0].ColumnWidth = 15

# Set cell styles
sheet.Range["A1:C1"].Style.Color = Color.get_DarkBlue()
sheet.Range["A2:C7"].Borders[BordersLineType.EdgeBottom].LineStyle = LineStyleType.Thin
sheet.Range["A2:C7"].Style.Borders[BordersLineType.EdgeBottom].Color = Color.get_DarkBlue()
sheet.Range["B1:C7"].HorizontalAlignment = HorizontalAlignType.Center
sheet.Range["A1:C7"].VerticalAlignment = VerticalAlignType.Center

# Add a radar chart to the worksheet
chart = sheet.Charts.Add(ExcelChartType.Radar)

# Set position of chart
chart.LeftColumn = 4
chart.TopRow = 4
chart.RightColumn = 14
chart.BottomRow = 29

# Set data range for the chart
chart.DataRange = sheet.Range["A1:C7"]
chart.SeriesDataFromRange = False

# Set and format chart title
chart.ChartTitle = "Employee Performance Appraisal"
chart.ChartTitleArea.IsBold = True
chart.ChartTitleArea.Size = 14
chart.PlotArea.Fill.Visible = False
chart.Legend.Position = LegendPositionType.Corner

# Save the result file
workbook.SaveToFile("CreateRadarChart.xlsx", ExcelVersion.Version2016)
workbook.Dispose()
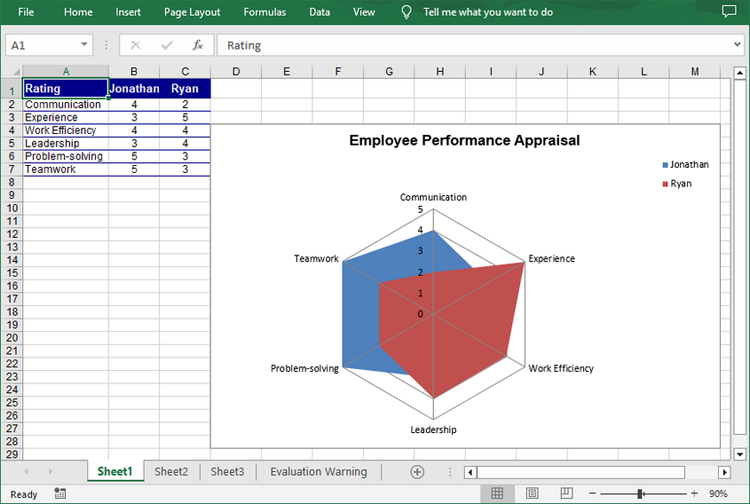
Create a Filled Radar Chart in Excel in Python
A filled radar chart is a variation of a standard radar chart, with the difference that the area between each data point is filled with color. The following are the steps to create a filled radar chart using Python:
- Create a Workbook instance.
- Get a specified worksheet using Workbook.Worksheets[] property.
- Add the chart data to specified cells and set the cell styles.
- Add a filled radar chart to the worksheet using Worksheet.Charts.Add(ExcelChartType.RadarFilled) method.
- Set data range for the chart using Chart.DataRange property.
- Set the position, legend and title of the chart.
- Save the result file using Workbook.SaveToFile() method.
- Python
from spire.xls import *
from spire.xls.common import *

# Create a Workbook instance
workbook = Workbook()

# Get the first worksheet
sheet = workbook.Worksheets[0]

# Add chart data to specified cells
sheet.Range["A1"].Value = "Rating"
sheet.Range["A2"].Value = "Communication"
sheet.Range["A3"].Value = "Experience"
sheet.Range["A4"].Value = "Work Efficiency"
sheet.Range["A5"].Value = "Leadership"
sheet.Range["A6"].Value = "Problem-solving"
sheet.Range["A7"].Value = "Teamwork"

sheet.Range["B1"].Value = "Jonathan"
sheet.Range["B2"].NumberValue = 4
sheet.Range["B3"].NumberValue = 3
sheet.Range["B4"].NumberValue = 4
sheet.Range["B5"].NumberValue = 3
sheet.Range["B6"].NumberValue = 5
sheet.Range["B7"].NumberValue = 5

sheet.Range["C1"].Value = "Ryan"
sheet.Range["C2"].NumberValue = 2
sheet.Range["C3"].NumberValue = 5
sheet.Range["C4"].NumberValue = 4
sheet.Range["C5"].NumberValue = 4
sheet.Range["C6"].NumberValue = 3
sheet.Range["C7"].NumberValue = 3

# Set font styles
sheet.Range["A1:C1"].Style.Font.IsBold = True
sheet.Range["A1:C1"].Style.Font.Size = 11
sheet.Range["A1:C1"].Style.Font.Color = Color.get_White()

# Set row height and column width
sheet.Rows[0].RowHeight = 20
sheet.Range["A1:C7"].Columns[0].ColumnWidth = 15

# Set cell styles
sheet.Range["A1:C1"].Style.Color = Color.get_DarkBlue()
sheet.Range["A2:C7"].Borders[BordersLineType.EdgeBottom].LineStyle = LineStyleType.Thin
sheet.Range["A2:C7"].Style.Borders[BordersLineType.EdgeBottom].Color = Color.get_DarkBlue()
sheet.Range["B1:C7"].HorizontalAlignment = HorizontalAlignType.Center
sheet.Range["A1:C7"].VerticalAlignment = VerticalAlignType.Center

# Add a filled radar chart to the worksheet
chart = sheet.Charts.Add(ExcelChartType.RadarFilled)

# Set position of chart
chart.LeftColumn = 4
chart.TopRow = 4
chart.RightColumn = 14
chart.BottomRow = 29

# Set data range for the chart
chart.DataRange = sheet.Range["A1:C7"]
chart.SeriesDataFromRange = False

# Set and format chart title
chart.ChartTitle = "Employee Performance Appraisal"
chart.ChartTitleArea.IsBold = True
chart.ChartTitleArea.Size = 14
chart.PlotArea.Fill.Visible = False
chart.Legend.Position = LegendPositionType.Corner

# Save the result file
workbook.SaveToFile("FilledRadarChart.xlsx", ExcelVersion.Version2016)
workbook.Dispose()
Apply for a Temporary License
If you'd like to remove the evaluation message from the generated documents, or to get rid of the function limitations, please request a 30-day trial license for yourself.
Python: Insert, Extract, or Remove OLE Objects in PowerPoint Presentations
2024-12-06 01:03:43 Written by KoohjiIncorporating external content into PowerPoint presentations can significantly enhance their impact and relevance. OLE (Object Linking and Embedding) objects provide an efficient way to embed or link various types of external files, such as Excel spreadsheets, Word documents, and PDF files, directly into PowerPoint slides. This functionality not only allows for seamless integration of dynamic data but also enables users to maintain a live connection to the original files. In this article, we will introduce how to insert, extract, or remove OLE objects in PowerPoint presentations in Python using Spire.Presentation for Python.
- Insert OLE Objects into a PowerPoint Presentation
- Extract OLE Objects from a PowerPoint Presentation
- Remove OLE Objects from a PowerPoint Presentation
Install Spire.Presentation for Python
This scenario requires Spire.Presentation for Python and plum-dispatch v1.7.4. They can be easily installed in your Windows through the following pip command.
pip install Spire.Presentation
If you are unsure how to install, please refer to this tutorial: How to Install Spire.Presentation for Python on Windows
Insert OLE Objects into a PowerPoint Presentation in Python
Spire.Presentation for Python provides the ISlide.Shapes.AppendOleObject() method, which allows you to insert various external files (such as Word documents, Excel spreadsheets, PDF files, PowerPoint presentations, and ZIP archives) as OLE objects into PowerPoint slides. The detailed steps are as follows.
- Create an object of the Presentation class.
- Access the desired slide using the Presentation.Slides[index] property.
- Add an OLE object to the slide using the ISlide.Shapes.AppendOleObject() method.
- Set the icon for the OLE object using the IOleObject.SubstituteImagePictureFillFormat.Picture.EmbedImage property.
- Specify the object type using the IOleObject.ProgId property.
- Save the presentation using the Presentation.SaveToFile() method.
- Python
from spire.presentation.common import *
from spire.presentation import *

# Create an object of the Presentation class
ppt = Presentation()

try:
    # Get the first slide
    slide = ppt.Slides[0]

    # Initialize the top position for the first object
    currentTop = 60
    # Spacing between OLE objects
    verticalSpacing = 20

    # Add an Excel icon to the presentation
    excelImageStream = Stream("icons/excel-icon.png")
    oleImage = ppt.Images.AppendStream(excelImageStream)
    # Define the position of the Excel OLE object
    excelRec = RectangleF.FromLTRB(100, currentTop, oleImage.Width + 100, currentTop + oleImage.Height)
    # Add an Excel file to the slide as an OLE object
    oleStream = Stream("Budget.xlsx")
    oleObject = slide.Shapes.AppendOleObject("excel", oleStream, excelRec)
    oleObject.SubstituteImagePictureFillFormat.Picture.EmbedImage = oleImage
    oleObject.ProgId = "Excel.Sheet.12"

    # Update the top position for the next object
    currentTop += oleImage.Height + verticalSpacing

    # Add a Word icon to the presentation
    wordImageStream = Stream("icons/word-icon.png")
    wordOleImage = ppt.Images.AppendStream(wordImageStream)
    # Define the position of the Word OLE object
    wordRec = RectangleF.FromLTRB(100, currentTop, wordOleImage.Width + 100, currentTop + wordOleImage.Height)
    # Add a Word file to the slide as an OLE object
    wordStream = Stream("Document.docx")
    wordOleObject = slide.Shapes.AppendOleObject("word", wordStream, wordRec)
    wordOleObject.SubstituteImagePictureFillFormat.Picture.EmbedImage = wordOleImage
    wordOleObject.ProgId = "Word.Document.12"

    # Update the top position for the next object
    currentTop += wordOleImage.Height + verticalSpacing

    # Add a PDF icon to the presentation
    pdfImageStream = Stream("icons/pdf-icon.png")
    pdfOleImage = ppt.Images.AppendStream(pdfImageStream)
    # Define the position of the PDF OLE object
    pdfRec = RectangleF.FromLTRB(100, currentTop, pdfOleImage.Width + 100, currentTop + pdfOleImage.Height)
    # Add a PDF file to the slide as an OLE object
    pdfStream = Stream("Report.pdf")
    pdfOleObject = slide.Shapes.AppendOleObject("pdf", pdfStream, pdfRec)
    pdfOleObject.SubstituteImagePictureFillFormat.Picture.EmbedImage = pdfOleImage
    pdfOleObject.ProgId = "Acrobat.Document"

    # Update the top position for the next object
    currentTop += pdfOleImage.Height + verticalSpacing

    # Add a zip package icon to the presentation
    zipImageStream = Stream("icons/zip-icon.png")
    zipOleImage = ppt.Images.AppendStream(zipImageStream)
    # Define the position of the zip package OLE object
    zipRec = RectangleF.FromLTRB(100, currentTop, zipOleImage.Width + 100, currentTop + zipOleImage.Height)
    # Add a zip file to the slide as an OLE object
    zipOleStream = Stream("Example.zip")
    zipOleObject = slide.Shapes.AppendOleObject("zip", zipOleStream, zipRec)
    zipOleObject.ProgId = "Package"
    zipOleObject.SubstituteImagePictureFillFormat.Picture.EmbedImage = zipOleImage

    # Save the PowerPoint presentation
    ppt.SaveToFile("AddOLEObjects.pptx", FileFormat.Pptx2010)

finally:
    excelImageStream.Close()
    oleStream.Close()
    wordImageStream.Close()
    wordStream.Close()
    pdfImageStream.Close()
    pdfStream.Close()
    zipImageStream.Close()
    zipOleStream.Close()
    ppt.Dispose()

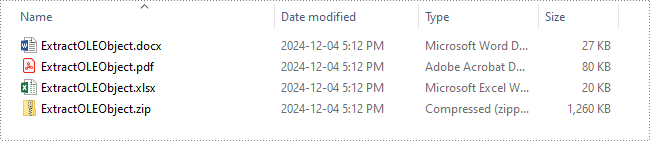
Extract OLE Objects from a PowerPoint Presentation in Python
Spire.Presentation for Python enables you to extract the embedded OLE objects from a PowerPoint presentation and save them for further use. The detailed steps are as follows.
- Create an object of the Presentation class.
- Load a PowerPoint presentation using the Presentation.LoadFromFile() method.
- Iterate through all slides in the presentation and all shapes on each slide.
- Check if the shape is an OLE object.
- Get the data of the OLE object using the IOleObject.Data property.
- Identify the type of the OLE object using the IOleObject.ProgId property and save the OLE object data to its original format.
- Python
from spire.presentation.common import *
from spire.presentation import *

# Create an object of the Presentation class
presentation = Presentation()

try:
    # Load the PowerPoint presentation
    presentation.LoadFromFile("AddOLEObjects.pptx")

    # Define output file paths for different types of OLE objects
    output_files = {
        "Acrobat.Document": "ExtractedOLEs/ExtractOLEObject.pdf",
        "Excel.Sheet.12": "ExtractedOLEs/ExtractOLEObject.xlsx",
        "Word.Document.12": "ExtractedOLEs/ExtractOLEObject.docx",
        "Package": "ExtractedOLEs/ExtractOLEObject.zip"
    }

    # Iterate through each slide in the presentation
    for slide in presentation.Slides:
        # Iterate through each shape in the slide
        for shape in slide.Shapes:
            # Check if the shape is an OLE object
            if isinstance(shape, IOleObject):
                ole_object = shape
                # Retrieve the data of the OLE object
                ole_data_stream = ole_object.Data

                # Determine the appropriate output file based on the OLE object's ProgId
                output_file = output_files.get(ole_object.ProgId)
                if output_file:
                    # Save the OLE object data to the corresponding output file
                    ole_data_stream.Save(output_file)
                    # Close stream
                    ole_data_stream.Close()

finally:
    presentation.Dispose()
Remove OLE Objects from a PowerPoint Presentation in Python
If you need to remove unwanted OLE objects from a PowerPoint presentation to streamline your slides, you can use the ISlide.Shapes.Remove() method. The detailed steps are as follows.
- Create an object of the Presentation class.
- Load a PowerPoint presentation using the Presentation.LoadFromFile() method.
- Iterate through all slides in the presentation and all shapes on each slide.
- Check if the shape is an OLE object.
- Store the OLE objects in a list and then remove them from the slide using the ISlide.Shapes.Remove() method.
- Save the presentation using the Presentation.SaveToFile() method.
- Python
from spire.presentation.common import *
from spire.presentation import *

# Create an object of the Presentation class
presentation = Presentation()

try:
    # Load the PowerPoint presentation
    presentation.LoadFromFile("AddOLEObjects.pptx")

    # Iterate through each slide in the presentation
    for slide in presentation.Slides:
        # Create a list to store shapes that are OLE objects
        ole_shapes = []

        # Iterate through each shape in the slide
        for shape in slide.Shapes:
            # Check if the shape is an OLE object
            if isinstance(shape, IOleObject):
                ole_shapes.append(shape)

        # Remove all OLE objects from the slide
        for ole_object in ole_shapes:
            slide.Shapes.Remove(ole_object)

    # Save the modified PowerPoint presentation
    presentation.SaveToFile("RemoveOLEObjects.pptx", FileFormat.Pptx2010)

finally:
    presentation.Dispose()
Apply for a Temporary License
If you'd like to remove the evaluation message from the generated documents, or to get rid of the function limitations, please request a 30-day trial license for yourself.
Charts in Excel are powerful tools that transform raw data into visual insights, making it easier to identify trends and patterns. Often, you may need to manage or adjust these charts to better suit your needs. For instance, you might need to extract the data behind a chart for further analysis, resize a chart to fit your layout, move a chart to a more strategic location, or remove outdated charts to keep your workbook organized and clutter-free. In this article, you will learn how to extract, resize, move, and remove charts in Excel in Python using Spire.XLS for Python.
- Extract the Data Source of a Chart in Excel
- Resize a Chart in Excel
- Move a Chart in Excel
- Remove a Chart from Excel
Install Spire.XLS for Python
This scenario requires Spire.XLS for Python and plum-dispatch v1.7.4. They can be easily installed in your Windows through the following pip command.
pip install Spire.XLS
If you are unsure how to install, please refer to this tutorial: How to Install Spire.XLS for Python on Windows
Extract the Data Source of a Chart in Excel in Python
Spire.XLS for Python provides the Chart.DataRange property, which allows you to define or retrieve the cell range used as the data source for a chart. After retrieving this range, you can access the data it contains for further processing or analysis. The detailed steps are as follows.
- Create an object of the Workbook class.
- Load an Excel file using the Workbook.LoadFromFile() method.
- Access the worksheet containing the chart using the Workbook.Worksheets[index] property.
- Get the chart using the Worksheet.Charts[index] property.
- Get the cell range that is used as the data source of the chart using the Chart.DataRange property.
- Loop through the rows and columns in the cell range and get the data of each cell.
- Python
from spire.xls import *
from spire.xls.common import *

# Create a Workbook object
workbook = Workbook()
# Load an Excel file
workbook.LoadFromFile("ChartSample.xlsx")

# Get the worksheet containing the chart
sheet = workbook.Worksheets[0]

# Get the chart
chart = sheet.Charts[0]

# Get the cell range that the chart uses
cellRange = chart.DataRange

# Iterate through the rows and columns in the cell range
for i in range(len(cellRange.Rows)):
    for j in range(len(cellRange.Rows[i].Columns)):
        # Get the data of each cell
        print(cellRange[i + 1, j + 1].Value + "  ", end='')

    print("")

workbook.Dispose()
Resize a Chart in Excel in Python
Resizing a chart allows you to adjust its dimensions to fit specific areas of your worksheet or enhance its readability. With Spire.XLS for Python, you can adjust the chart's dimensions using the Chart.Width and Chart.Height properties. The detailed steps are as follows.
- Create an object of the Workbook class.
- Load an Excel file using the Workbook.LoadFromFile() method.
- Access the worksheet containing the chart using the Workbook.Worksheets[index] property.
- Get the chart using the Worksheet.Charts[index] property.
- Adjust the chart’s dimensions using the Chart.Width and Chart.Height properties.
- Save the result file using the Workbook.SaveToFile() method.
- Python
from spire.xls import *
from spire.xls.common import *

# Create a Workbook object
workbook = Workbook()
# Load an Excel file
workbook.LoadFromFile("ChartSample.xlsx")

# Get the worksheet containing the chart
sheet = workbook.Worksheets[0]

# Get the chart
chart = sheet.Charts[0]

# Resize the chart
chart.Width = 450
chart.Height = 300

# Save the result file
workbook.SaveToFile("ResizeChart.xlsx", ExcelVersion.Version2013)
workbook.Dispose()
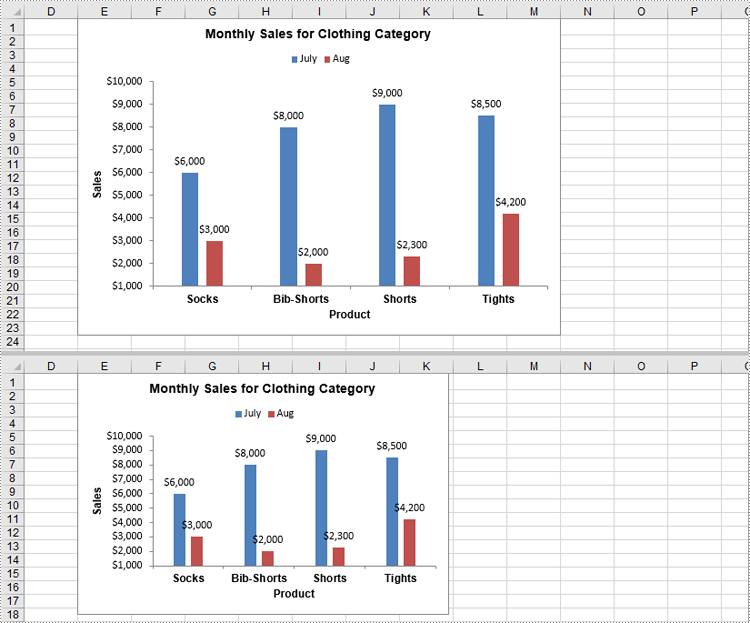
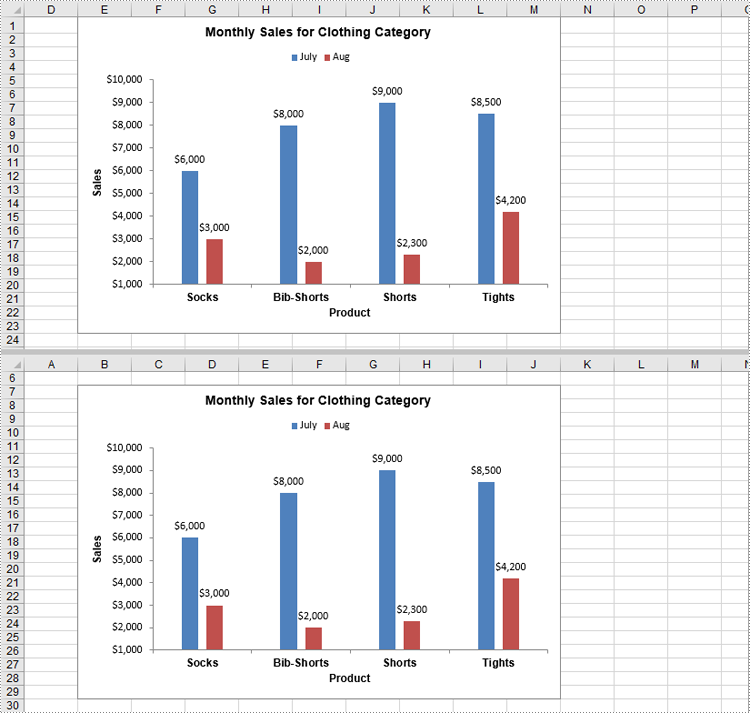
Move a Chart in Excel in Python
Moving a chart lets you reposition it for better alignment or to relocate it to another sheet. You can use the Chart.LeftColumn, Chart.TopRow, Chart.RightColumn, and Chart.BottomRow properties to specify the new position of the chart. The detailed steps are as follows.
- Create an object of the Workbook class.
- Load an Excel file using the Workbook.LoadFromFile() method.
- Access the worksheet containing the chart using the Workbook.Worksheets[index] property.
- Get the chart using the Worksheet.Charts[index] property.
- Set the new position of the chart using the Chart.LeftColumn, Chart.TopRow, Chart.RightColumn, and Chart.BottomRow properties.
- Save the result file using the Workbook.SaveToFile() method.
- Python
from spire.xls import *
from spire.xls.common import *

# Create a Workbook object
workbook = Workbook()
# Load an Excel file
workbook.LoadFromFile("ChartSample.xlsx")

# Get the worksheet containing the chart
sheet = workbook.Worksheets[0]

# Get the chart
chart = sheet.Charts[0]

# Set the new position of the chart
chart.LeftColumn = 1
chart.TopRow = 7
chart.RightColumn = 9
chart.BottomRow = 30

# Save the result file
workbook.SaveToFile("MoveChart.xlsx", ExcelVersion.Version2013)
workbook.Dispose()
Remove a Chart from Excel in Python
Removing unnecessary or outdated charts from your worksheet helps keep your document clean and organized. In Spire.XLS for Python, you can use the Chart.Remove() method to delete a chart from an Excel worksheet. The detailed steps are as follows.
- Create an object of the Workbook class.
- Load an Excel file using the Workbook.LoadFromFile() method.
- Access the worksheet containing the chart using the Workbook.Worksheets[index] property.
- Get the chart using the Worksheet.Charts[index] property.
- Remove the chart using the Chart.Remove() method.
- Save the result file using the Workbook.SaveToFile() method.
- Python
from spire.xls import *
from spire.xls.common import *

# Create a Workbook object
workbook = Workbook()
# Load an Excel file
workbook.LoadFromFile("ChartSample.xlsx")

# Get the worksheet containing the chart
sheet = workbook.Worksheets[0]

# Get the chart
chart = sheet.Charts[0]

# Remove the chart
chart.Remove()

# Save the result file
workbook.SaveToFile("RemoveChart.xlsx", ExcelVersion.Version2013)
workbook.Dispose()
Apply for a Temporary License
If you'd like to remove the evaluation message from the generated documents, or to get rid of the function limitations, please request a 30-day trial license for yourself.