C#: Add, Modify, or Remove Word Table Borders
Adding, modifying, and removing Word table borders can enhance the readability, aesthetics, and organization of data. Adding borders makes the content of the table clearer, distinguishing between different cells, which helps readers quickly identify information. Modifying border styles (such as line thickness, color, or pattern) can emphasize key data, guide visual flow, or conform to specific document styles and design requirements. Removing borders, in some cases, reduces visual clutter, making the content more compact and minimalist, especially suitable for data presentation where strict divisions are not needed or when you wish to downplay structural visibility. This article will introduce how to add, modify, or remove Word table borders in C# projects using Spire.Doc for .NET.
Install Spire.Doc for .NET
To begin with, you need to add the DLL files included in the Spire.Doc for .NET package as references in your .NET project. The DLL files can be either downloaded from this link or installed via NuGet.
PM> Install-Package Spire.Doc
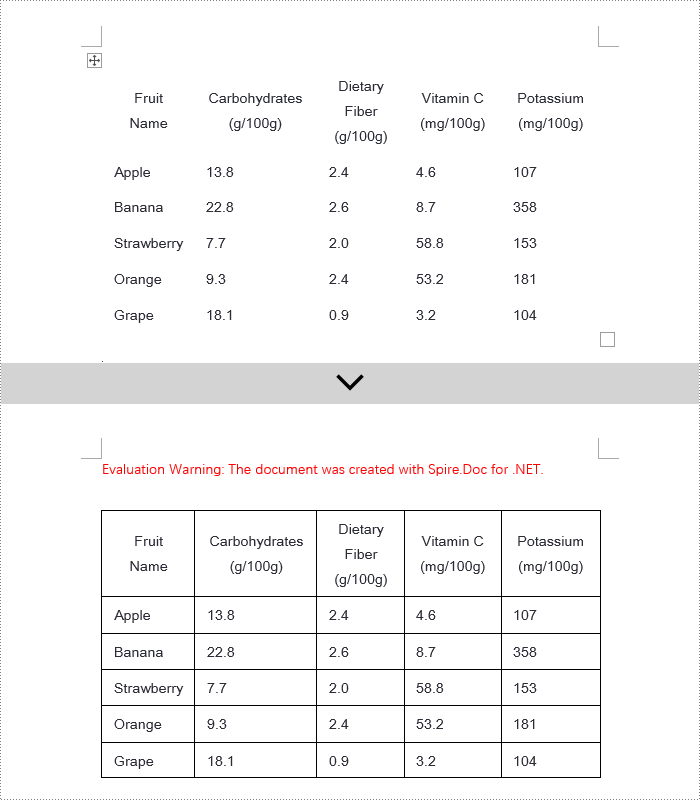
C# Add Word Table Borders
To set borders for all cells in an entire Word table, you need to iterate over each cell and set its visual border properties. Here are the detailed steps:
- Create a Document object.
- Use the Document.LoadFromFile() method to load a document.
- Retrieve the first section of the document using Document.Sections[0].
- Get the first table in that section by using Section.Tables[0].
- Use a for loop to iterate through all the cells in the table.
- Set TableCell.CellFormat.Borders.BorderType to BorderStyle.Single, which sets the cell border to a single line style.
- Set TableCell.CellFormat.Borders.LineWidth to 1.5, defining the border width to be 1.5 points.
- Set TableCell.CellFormat.Borders.Color to Color.Black, setting the border color to black.
- Save the changes to the Word document using the Document.SaveToFile() method.
- C#
using Spire.Doc;

namespace SpireDocDemo
{
    internal class Program
    {
        static void Main(string[] args)
        {
            // Create a new Document object
            Document doc = new Document();

            // Load the document from a file
            doc.LoadFromFile("TableExample1.docx");

            // Get the first section of the document
            Section section = doc.Sections[0];

            // Get the first table in that section
            Table table = (Table)section.Tables[0];

            // Declare TableRow and TableCell variables for use within loops
            TableRow tableRow;
            TableCell tableCell;

            // Iterate through all rows in the table
            for (int i = 0; i < table.Rows.Count; i++)
            {
                // Get the current row
                tableRow = table.Rows[i];

                // Iterate through all cells in the current row
                for (int j = 0; j < tableRow.Cells.Count; j++)
                {
                    // Get the current cell
                    tableCell = tableRow.Cells[j];

                    // Set the border style of the current cell to single line
                    tableCell.CellFormat.Borders.BorderType = Spire.Doc.Documents.BorderStyle.Single;
                }
            }

            // Save the modified document as a new file
            doc.SaveToFile("AddBorders.docx", FileFormat.Docx2016);

            // Close the document to release resources
            doc.Close();
        }
    }
}
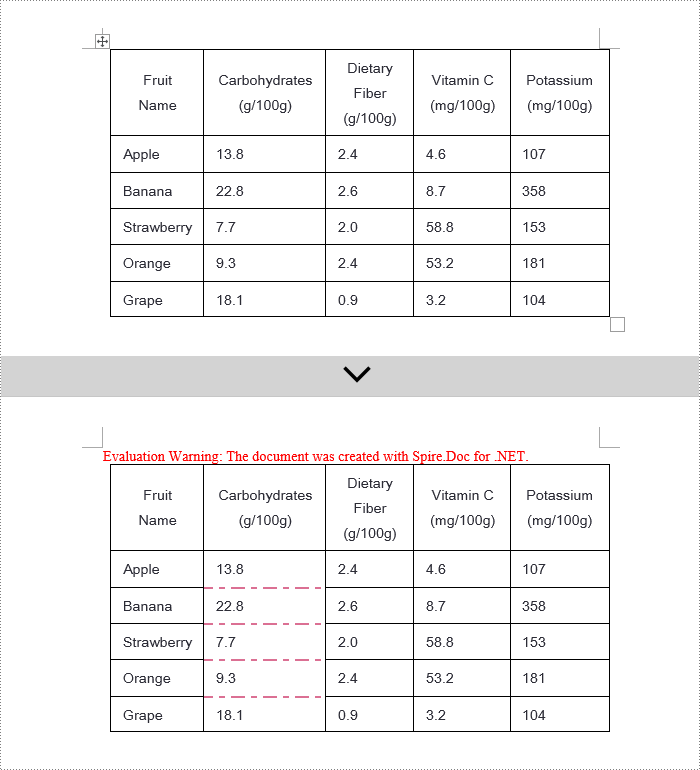
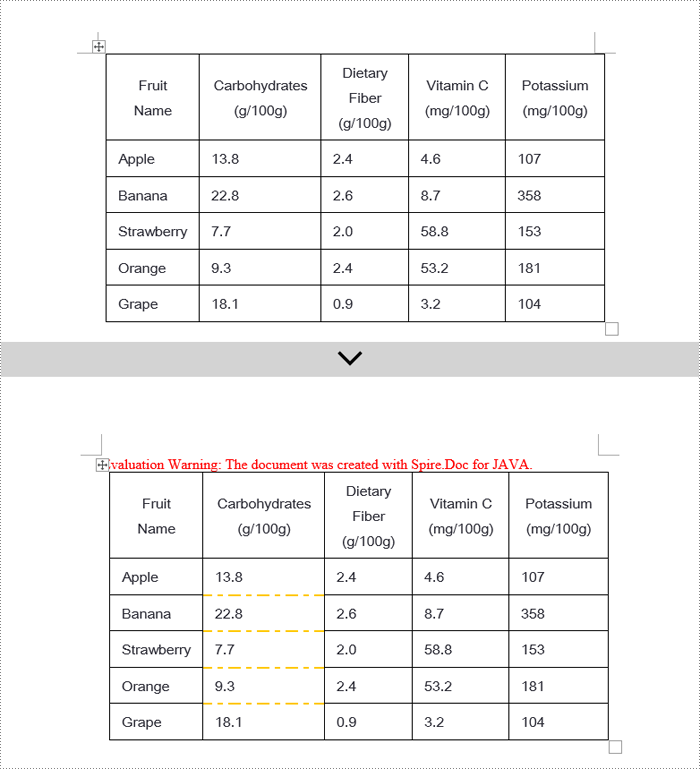
C# Modify Word Table Borders
Spire.Doc offers a range of border properties such as the border style TableCell.CellFormat.Borders.BorderType, border width TableCell.CellFormat.Borders.LineWidth, and border color TableCell.CellFormat.Borders.Color, among others. You can customize these properties to achieve the desired effects. Below are the detailed steps:
- Create a Document object.
- Load a document using the Document.LoadFromFile() method.
- Retrieve the first section of the document using Document.Sections[0].
- Get the first table in the section using Section.Tables[0].
- Use a for loop to iterate over the cells in the table whose border styles you wish to change.
- Change the bottom border color of the cell by setting TableCell.CellFormat.Borders.Bottom.Color to Color.PaleVioletRed.
- Change the bottom border style of the cell by setting TableCell.CellFormat.Borders.Bottom.BorderType to BorderStyle.DotDash.
- Change the bottom border width of the cell by setting TableCell.CellFormat.Borders.Bottom.LineWidth to 2 points.
- Save the changes to the document using the Document.SaveToFile() method.
- C#
using Spire.Doc;
using Spire.Doc.Documents;
using System.Drawing;

namespace SpireDocDemo
{
    internal class Program
    {
        static void Main(string[] args)
        {
            // Create a new Document object
            Document doc = new Document();

            // Load the document from a file
            doc.LoadFromFile("TableExample2.docx");

            // Get the first section of the document
            Section section = doc.Sections[0];

            // Get the first table in that section
            Table table = (Table)section.Tables[0];

            // Declare a TableRow to use within the loop
            TableRow tableRow;

            // Iterate through all rows of the table
            for (int i = 1; i < table.Rows.Count - 1; i++)
            {
                tableRow = table.Rows[i];

                // Set the border color of the current cell
                tableRow.Cells[1].CellFormat.Borders.Bottom.Color = Color.PaleVioletRed;

                // Set the border style of the current cell to DotDash
                tableRow.Cells[1].CellFormat.Borders.Bottom.BorderType = Spire.Doc.Documents.BorderStyle.DotDash;

                // Set the width of the border
                tableRow.Cells[1].CellFormat.Borders.Bottom.LineWidth = 2;
            }

            // Save the modified document as a new file
            doc.SaveToFile("ModifiedBorders.docx", FileFormat.Docx2016);

            // Close the document and release resources
            doc.Close();
        }
    }
}
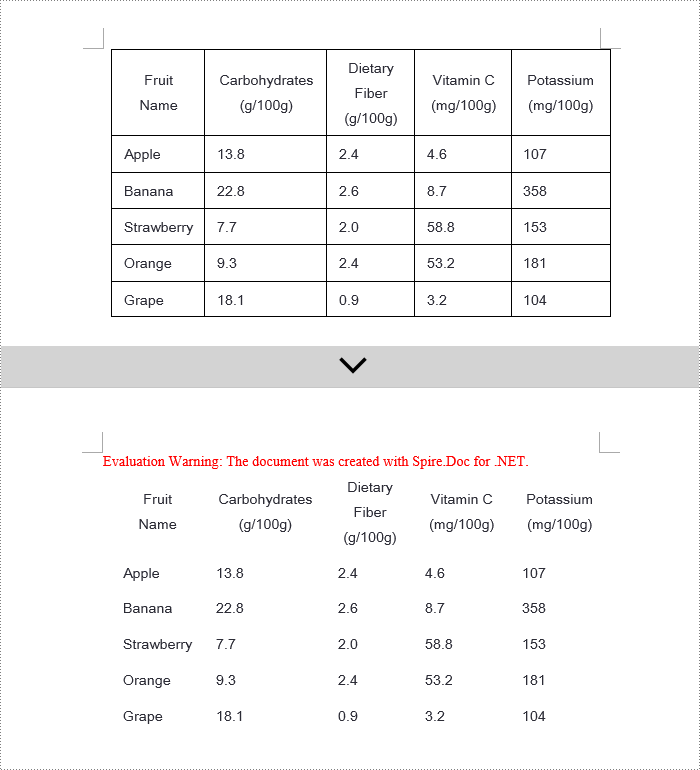
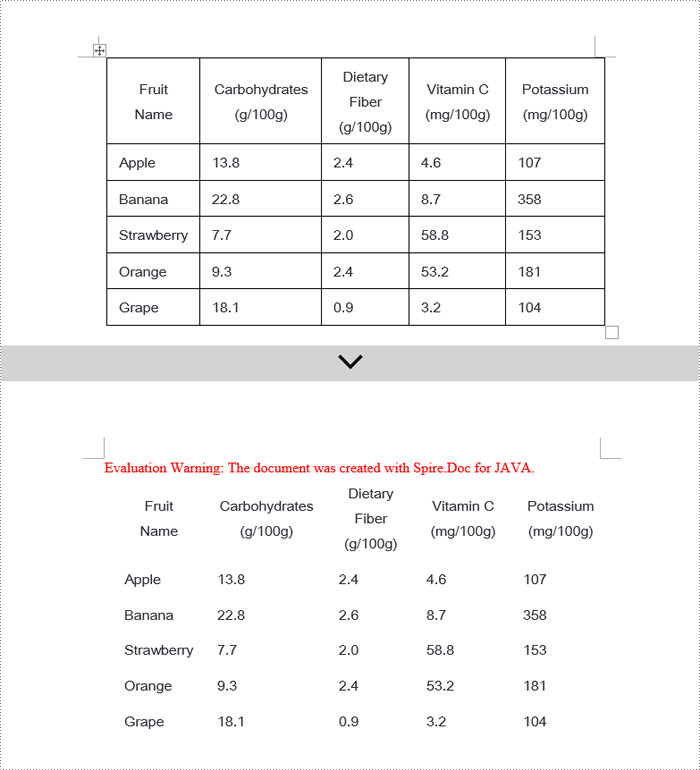
C# Remove Word Table Borders
During the process of handling Word documents, not only can border styles be applied to entire tables, but customization can also be extended to individual cells. To completely remove all borders from a table, it is recommended to follow a two-step strategy: First, apply border removal settings to the table itself; second, visit each cell within the table individually to clear their border styles. Here are the detailed steps:
- Create a Document object.
- Load a document using the Document.LoadFromFile() method.
- Retrieve the first table in the section using Section.Tables[0].
- Use a for loop to iterate over all cells in the table.
- Set Table.TableFormat.Borders.BorderType = BorderStyle.None to remove borders from the table.
- Set TableCell.CellFormat.Borders.BorderType = BorderStyle.None to remove borders from each cell.
- Save the changes to the Word document using the Document.SaveToFile() method.
- C#
using Spire.Doc;
using Spire.Doc.Documents;
using System.Drawing;

namespace SpireDocDemo
{
    internal class Program
    {
        static void Main(string[] args)
        {
            // Create a new Document object
            Document doc = new Document();

            // Load the document from file
            doc.LoadFromFile("TableExample2.docx");

            // Get the first section of the document
            Section section = doc.Sections[0];

            // Get the first table in that section
            Table table = (Table)section.Tables[0];

            // Remove the borders set on the table
            table.TableFormat.Borders.BorderType = BorderStyle.None;

            // Declare a TableRow to use in the loop
            TableRow tableRow;

            // Iterate through all rows in the table
            for (int i = 0; i < table.Rows.Count; i++)
            {
                tableRow = table.Rows[i];
                for (int j = 0; j < tableRow.Cells.Count; j++)
                {
                    // Remove all borders set on the cell
                    tableRow.Cells[j].CellFormat.Borders.BorderType = BorderStyle.None;
                }
            }

            // Save the modified document as a new file
            doc.SaveToFile("RemoveBorders.docx", FileFormat.Docx2016);

            // Close the document to release resources
            doc.Close();
        }
    }
}
Apply for a Temporary License
If you'd like to remove the evaluation message from the generated documents, or to get rid of the function limitations, please request a 30-day trial license for yourself.
Java: Add, Modify, or Remove Word Table Borders
In Word documents, the ability to add, modify, and remove table borders flexibly can significantly enhance readability and professionalism. Firstly, customizing border styles highlights important information, helping readers quickly locate key data or paragraphs and enhancing visual impact. Secondly, by adjusting the thickness, color, and style of border lines, finer design control can be achieved, ensuring a uniform and aesthetically pleasing document style. Lastly, removing unnecessary borders helps reduce visual clutter, making page layouts cleaner and more comprehensible, improving the reading experience. This article will introduce how to add, modify, or remove Word table borders in Java projects using Spire.Doc for Java.
Install Spire.Doc for Java
First, you're required to add the Spire.Doc.jar file as a dependency in your Java program. The JAR file can be downloaded from this link. If you use Maven, you can easily import the JAR file in your application by adding the following code to your project's pom.xml file.
<repositories>
    <repository>
        <id>com.e-iceblue</id>
        <name>e-iceblue</name>
        <url>https://repo.e-iceblue.com/nexus/content/groups/public/</url>
    </repository>
</repositories>
<dependencies>
    <dependency>
        <groupId>e-iceblue</groupId>
        <artifactId>spire.doc</artifactId>
        <version>12.7.6</version>
    </dependency>
</dependencies>
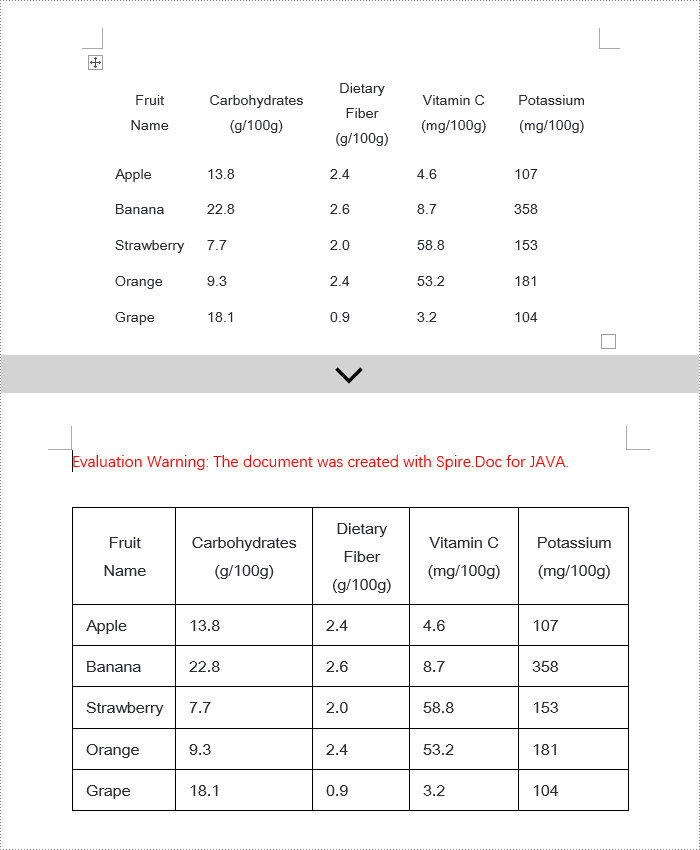
Java Add Word Table Borders
To uniformly add borders to all cells in a table, you need to visit each cell individually and visually set its border properties. Here are the detailed steps:
- Create a Document object.
- Load a document using the Document.loadFromFile() method.
- Retrieve the first section of the document using Document.getSections().get(0).
- Get the first table within the section using Section.getTables().get(0).
- Use a for loop to iterate through all cells in the table.
- Set the cell border to a single line style by using TableCell.getCellFormat().getBorders().setBorderType(BorderStyle.Single).
- Define the border width to 1 point by using TableCell.getCellFormat().getBorders().setLineWidth(1f).
- Set the border color to black by using TableCell.getCellFormat().getBorders().setColor(Color.black).
- Save the changes to the document using the Document.saveToFile() method.
- Java
import com.spire.doc.*;
import com.spire.doc.documents.*;
import java.awt.*;

public class AddBorder {
    public static void main(String[] args) throws Exception{
        // Create a new Document object
        Document doc = new Document();

        // Load the document from file
        doc.loadFromFile("TableExample1.docx");

        // Get the first section of the document
        Section section = doc.getSections().get(0);

        // Get the first table in the section
        Table table = section.getTables().get(0);

        // Declare TableRow and TableCell variables for use in the loop
        TableRow tableRow;
        TableCell tableCell;

        // Iterate through all rows of the table
        for (int i = 0; i < table.getRows().getCount(); i++) {
            // Get the current row
            tableRow = table.getRows().get(i);

            // Iterate through all cells in the current row
            for (int j = 0; j < tableRow.getCells().getCount(); j++) {
                // Get the current cell
                tableCell = tableRow.getCells().get(j);

                // Set the border style of the current cell to single line
                tableCell.getCellFormat().getBorders().setBorderType(BorderStyle.Single);

                // Set the width of the border
                tableCell.getCellFormat().getBorders().setLineWidth(1f);

                // Set the color of the border
                tableCell.getCellFormat().getBorders().setColor(Color.black);
            }
        }

        // Save the modified document as a new file
        doc.saveToFile("AddBorders.docx", FileFormat.Docx);

        // Close the document to release resources
        doc.close();
    }
}
Java Modify Word Table Borders
Spire.Doc empowers users with extensive customization options for borders, allowing adjustments such as selecting border styles through TableCell.getCellFormat().getBorders().getBottom().setBorderType(), setting border thickness via TableCell.getCellFormat().getBorders().getBottom().setLineWidth(), and specifying border colors with TableCell.getCellFormat().getBorders().getBottom().setColor(). This enables fine-tuned design of table borders within documents according to personal or project needs. Below are the detailed steps:
- Instantiate a Document object.
- Load a document using the Document.loadFromFile() method.
- Retrieve the first section of the document by calling Document.getSections().get(0).
- Get the first table within the section using Section.getTables().get(0).
- Iterate over the cells in the table that require border style changes using a for loop.
- Change the color of the bottom border to orange by invoking TableCell.getCellFormat().getBorders().getBottom ().setColor(Color.ORANGE).
- Alter the style of the bottom border to a dashed line by calling TableCell.getCellFormat().getBorders().getBottom ().setBorderType(BorderStyle.Dot_Dash).
- Modify the width of the bottom border to 2 points by executing TableCell.getCellFormat().getBorders().getBottom ().setLineWidth(2).
- Save the document using the Document.saveToFile() method.
- Java
import com.spire.doc.*;
import com.spire.doc.documents.*;
import java.awt.*;

public class ModifyBorder {
    public static void main(String[] args) {
        // Create a new Document object
        Document doc = new Document();

        // Load the document from a file
        doc.loadFromFile("TableExample2.docx");

        // Get the first section of the document
        Section section = doc.getSections().get(0);

        // Get the first table in that section
        Table table = section.getTables().get(0);

        // Declare a TableRow to use within the loop
        TableRow tableRow;

        // Iterate through all rows of the table
        for (int i = 1; i < table.getRows().getCount() - 1; i++) {
            tableRow = table.getRows().get(i);

            // Set the border color of the current cell     tableRow.getCells().get(1).getCellFormat().getBorders().getBottom().setColor(Color.ORANGE);
            // Set the border style of the current cell to dotted line
tableRow.getCells().get(1).getCellFormat().getBorders().getBottom().setBorderType(BorderStyle.Dot_Dash);

            // Set the width of the border
tableRow.getCells().get(1).getCellFormat().getBorders().getBottom().setLineWidth(2);
        }

        // Save the modified document as a new file
        doc.saveToFile("ModifyBorder.docx", FileFormat.Docx);

        // Close the document to release resources
        doc.close();
    }
}
Java Remove Word Table Borders
When editing Word documents, the flexibility of border design extends beyond the entire table level, allowing for meticulous personalized adjustments at the individual cell level. To comprehensively remove all traces of borders both inside and outside of tables, a phased approach is recommended: Firstly, address the macro-level by clearing the overall border style of the table; subsequently, enter the micro-adjustment phase where each cell within the table is iterated over to revoke its unique border settings. Below are the detailed steps:
- Instantiate a Document object.
- Load a document using the Document.loadFromFile() method.
- Retrieve the first section of the document by calling Document.getSections().get(0).
- Access the first table within the section using Section.getTables().get(0).
- Iterate over all cells in the table using a for loop.
- Remove the border of the table by invoking Table.getTableFormat().getBorders().setBorderType(BorderStyle.None).
- Eliminate the borders of each cell individually by applying TableCell.getCellFormat().getBorders().setBorderType(BorderStyle.None).
- Save the modified document using the Document.saveToFile() method.
- Java
import com.spire.doc.*;
import com.spire.doc.documents.BorderStyle;

public class RemoveBorder {
    public static void main(String[] args) {
        // Create a new Document object
        Document doc = new Document();

        // Load the document from a file
        doc.loadFromFile("TableExample2.docx");

        // Get the first section of the document
        Section section = doc.getSections().get(0);

        // Get the first table in the section
        Table table = section.getTables().get(0);

        // Remove the borders set on the table
        table.getTableFormat().getBorders().setBorderType(BorderStyle.None);

        // Declare a TableRow to use in the loop
        TableRow tableRow;

        // Iterate through all rows of the table
        for (int i = 0; i < table.getRows().getCount(); i++) {
            tableRow = table.getRows().get(i);
            for (int j = 0; j < tableRow.getCells().getCount(); j++) {
                // Remove all borders set on the cell          tableRow.getCells().get(j).getCellFormat().getBorders().setBorderType(BorderStyle.None);
            }
        }

        // Save the modified document as a new file
        doc.saveToFile("RemoveBorder.docx", FileFormat.Docx);

        // Close the document and release resources
        doc.close();
    }
}
Apply for a Temporary License
If you'd like to remove the evaluation message from the generated documents, or to get rid of the function limitations, please request a 30-day trial license for yourself.
Python: Copy Rows, Columns and Cells in Excel
Copying data in Excel is a fundamental feature that allows you to quickly and efficiently reproduce data. It can be especially valuable when building spreadsheets with similar structures, or needing to propagate the same information across multiple areas of your workbook. By mastering the art of copying in Excel, you can boost your productivity and reduce the risk of manual data entry errors. In this article, we will explain how to copy rows, columns and cells in Excel in Python using Spire.XLS for Python.
Install Spire.XLS for Python
This scenario requires Spire.XLS for Python and plum-dispatch v1.7.4. They can be easily installed in your Windows through the following pip command.
pip install Spire.XLS
If you are unsure how to install, please refer to this tutorial: How to Install Spire.XLS for Python on Windows
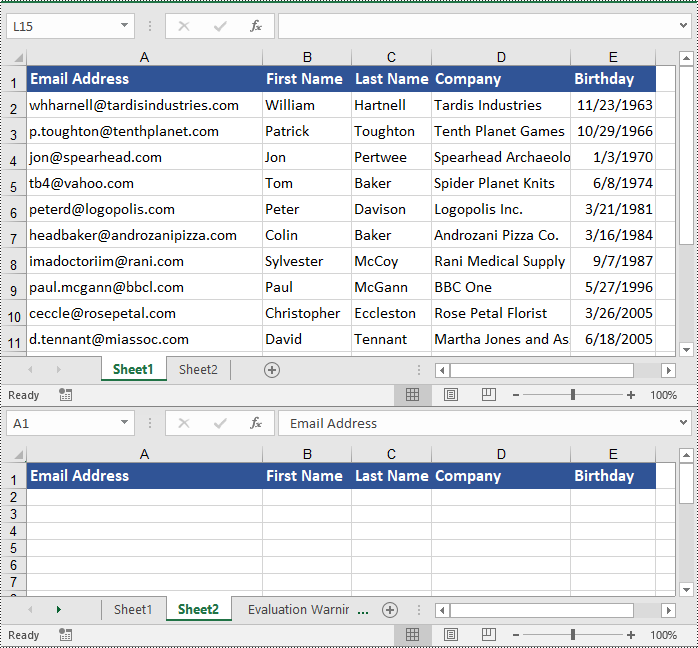
Copy Rows in Excel in Python
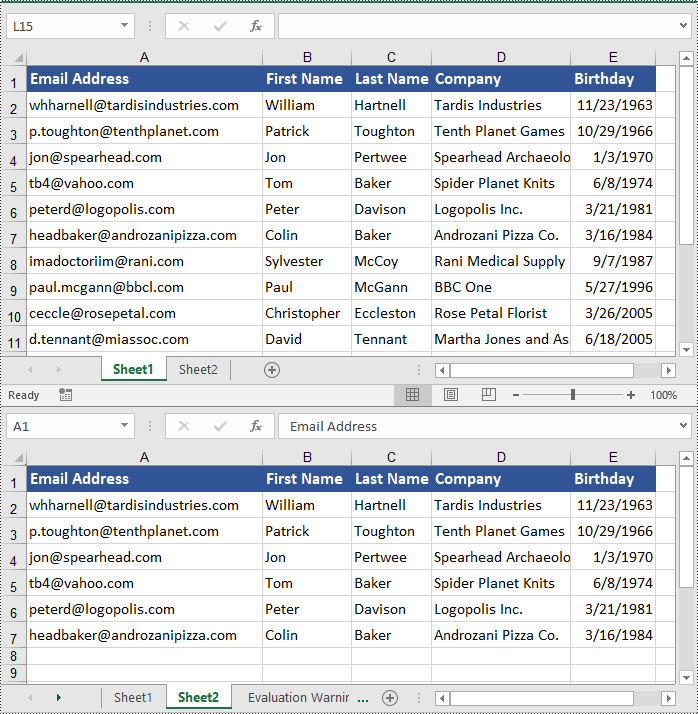
You can use the Worksheet.CopyRow(sourceRow, destSheet, destRowIndex, copyOptions) method provided by Spire.XLS for Python to easily copy a row in the same or between different worksheets in Excel. The detailed steps are as follows.
- Create an object of the Workbook class.
- Load an Excel file using the Workbook.LoadFromFile() method.
- Get the source worksheet and the destination worksheet using the Workbook.Worksheets[index] property.
- Get the desired row that you want to copy using the Worksheet.Rows[index] property.
- Copy the row and its format from the source worksheet to the destination worksheet using the Worksheet.CopyRow(sourceRow, destSheet, destRowIndex, copyOptions) method.
- Copy the column widths of cells in the source row to the corresponding cells in the destination row.
- Save the workbook to a file using the Workbook.SaveToFile() method.
- Python
from spire.xls import *
from spire.xls.common import *

# Create a Workbook object
workbook = Workbook()
# Load an Excel file
workbook.LoadFromFile("ContactList.xlsx")

# Get the source worksheet
sheet1 = workbook.Worksheets[0]
# Get the destination worksheet
sheet2 = workbook.Worksheets[1]

# Get the desired row that you want to copy
row = sheet1.Rows[0]

# Copy the row from the source worksheet to the first row of the destination worksheet
sheet1.CopyRow(row, sheet2, 1, CopyRangeOptions.All)

columns = sheet1.Columns.Length
# Copy the column widths of the cells in the source row to the corresponding cells in the destination row
for i in range(columns):
    column_width = row.Columns[i].ColumnWidth
    sheet2.Rows[0].Columns[i].ColumnWidth = column_width

# Save the workbook to a file
workbook.SaveToFile("CopyRow.xlsx", ExcelVersion.Version2016)
workbook.Dispose()
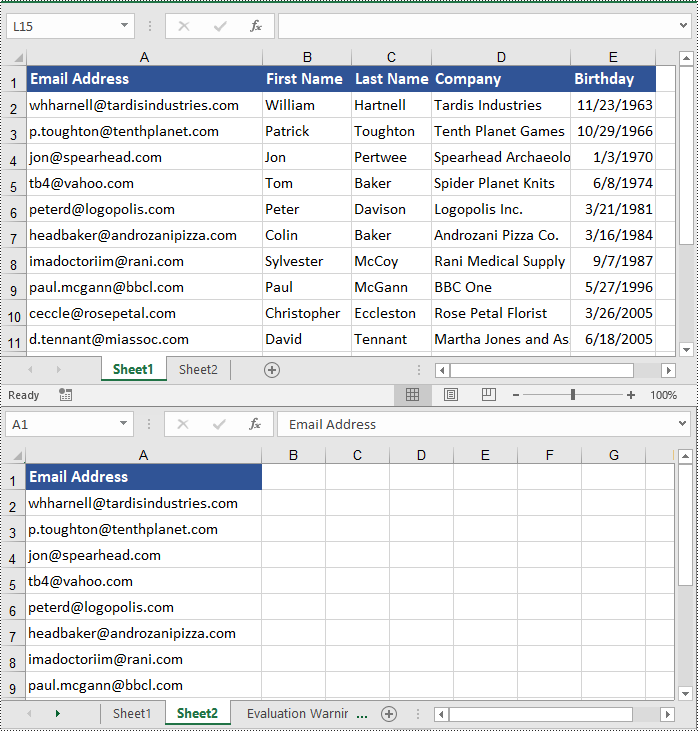
Copy Columns in Excel in Python
To copy a column in an Excel worksheet, you can use the Worksheet.CopyColumn(sourceColumn, destSheet, destColIndex, copyOptions) method. The detailed steps are as follows.
- Create an object of the Workbook class.
- Load an Excel file using the Workbook.LoadFromFile() method.
- Get the source worksheet and the destination worksheet using the Workbook.Worksheets[index] property.
- Get the desired column that you want to copy using the Worksheet.Columns[index] property.
- Copy the column and its format from the source worksheet to the destination worksheet using the Worksheet.CopyColumn(sourceColumn, destSheet, destColIndex, copyOptions) method.
- Copy the row heights of cells in the source column to the corresponding cells in the destination column.
- Save the workbook to a file using the Workbook.SaveToFile() method.
- Python
from spire.xls import *
from spire.xls.common import *

# Create a Workbook object
workbook = Workbook()
# Load an Excel file
workbook.LoadFromFile("ContactList.xlsx")

# Get the source worksheet
sheet1 = workbook.Worksheets[0]
# Get the destination worksheet
sheet2 = workbook.Worksheets[1]

# Get the desired column that you want to copy
column = sheet1.Columns[0]

# Copy the column from the source worksheet to the first column of the destination worksheet
sheet1.CopyColumn(column, sheet2, 1, CopyRangeOptions.All)

rows = column.Rows.Length
# Copy the row heights of cells in the source column to the corresponding cells in the destination column
for i in range(rows):
    row_height = column.Rows[i].RowHeight
    sheet2.Columns[0].Rows[i].RowHeight = row_height

# Save the workbook to a file
workbook.SaveToFile("CopyColumn.xlsx", ExcelVersion.Version2016)
workbook.Dispose()
Copy Cells in Excel in Python
In addition to copying entire rows and columns, you are also able to copy an individual cell or a range of cells using the CellRange.Copy(destRange, copyOptions) method. The detailed steps are as follows.
- Create an object of the Workbook class.
- Load an Excel file using the Workbook.LoadFromFile() method.
- Get the source worksheet and the destination worksheet using the Workbook.Worksheets[index] property.
- Get the source cell range and the destination cell range using the Worksheet.Range[] property.
- Copy the source cell range and its format from the source worksheet to the destination cell range in the destination worksheet using the CellRange.Copy(destRange, copyOptions) method.
- Copy the row heights and column widths of the source cell range to the destination cell range.
- Save the workbook to a file using the Workbook.SaveToFile() method.
- Python
from spire.xls import *
from spire.xls.common import *

# Create a Workbook object
workbook = Workbook()
# Load an Excel file
workbook.LoadFromFile("ContactList.xlsx")

# Get the source worksheet
sheet1 = workbook.Worksheets[0]
# Get the destination worksheet
sheet2 = workbook.Worksheets[1]

# Get the source cell range
range1 = sheet1.Range["A1:E7"]
# Get the destination cell range
range2 = sheet2.Range["A1:E7"]

# Copy the source cell range from the source worksheet to the destination cell range in the destination worksheet
range1.Copy(range2, CopyRangeOptions.All)

# Copy the row heights and column widths of the source cell range to the destination cell range
for i, row in enumerate(range1.Rows):
    for j, column in enumerate(row.Columns):
        range2.Rows[i].Columns[j].ColumnWidth = column.ColumnWidth
        range2.Rows[i].RowHeight = row.RowHeight

# Save the workbook to a file
workbook.SaveToFile("CopyCells.xlsx", ExcelVersion.Version2016)
workbook.Dispose()
Apply for a Temporary License
If you'd like to remove the evaluation message from the generated documents, or to get rid of the function limitations, please request a 30-day trial license for yourself.
Spire.Doc for Java 12.6.2 supports displaying a prompt message when a corresponding font is not found during conversion
We're pleased to announce the release of Spire.Doc for Java 12.6.2. This version supports displaying a prompt message when a corresponding font is not found during Word conversion. Meanwhile, it also fixes some issues that occurred when converting Word to PDF, and HTML to Word. More details are listed below.
Here is a list of changes made in this release
| Category | ID | Description |
| New feature | SPIREDOC-10465 | Supports displaying a prompt message when a corresponding font is not found during Word conversion.
Document doc = ConvertUtil.GetNewEngineDocument();
doc.loadFromFile(input);
HandleDocumentSubstitutionWarnings substitutionWarningHandler = new HandleDocumentSubstitutionWarnings();
doc.setWarningCallback(substitutionWarningHandler);
doc.saveToFile(output_1);
StringBuilder sb = new StringBuilder();
Iterator iterator = substitutionWarningHandler.FontWarnings.iterator();
while(iterator.hasNext()){
    System.out.println(((WarningInfo)iterator.next()).getDescription());
}
String s = substitutionWarningHandler.FontWarnings.get(0).getDescription();
WarningSource warningSource = substitutionWarningHandler.FontWarnings.get(0).getSource();
substitutionWarningHandler.FontWarnings.clear();
class HandleDocumentSubstitutionWarnings implements IWarningCallback
{
    public void warning(WarningInfo info) {
        if(info.getWarningType() == WarningType.Font_Substitution)
            FontWarnings.warning(info);
    }
    public WarningInfoCollection FontWarnings = new WarningInfoCollection();
}
|
| Bug | SPIREDOC-10413 | Fixes the issue that the text shifted upwards when converting a Word document to PDF. |
| Bug | SPIREDOC-10486 | Fixes the issue that the content layout was inconsistent when converting a Word document to PDF. |
| Bug | SPIREDOC-10504 | Fixes the issue that the application threw a "'td' is expected" error when converting an HTML to Word. |
| Bug | SPIREDOC-10589 | Fixes the issue that text content was partially lost when converting a Word document to an image. |
| Bug | SPIREDOC-10592 | Fixes the issue that the application threw a "String index out of range: -1" error when converting a Word document to PDF |
Spire.XLS for Java 14.6.2 enhances the conversion from Excel to images
We are delighted to announce the release of Spire.XLS for Java 14.6.2. This version enhances the conversion from Excel to images. Besides, some known issues are fixed in this version, such as the issue that the effect of setting "autoFitColumns()" was incorrect. More details are listed below.
Here is a list of changes made in this release
| Category | ID | Description |
| Bug | SPIREXLS-5223 | Fixes the issue that the formula values were calculated incorrectly when transferring Excel to images. |
| Bug | SPIREXLS-5238 | Fixes the issue that the effect of setting "autoFitColumns()" was incorrect. |
| Bug | SPIREXLS-5256 | Fixes the issue that an exception "com.spire.xls.packages.spramg: Invalid cell name" was thrown when loading an Excel document. |
| Bug | SPIREXLS-5263 | Fixes the issue that annotations added by Microsoft 365 in Excel documents were lost after loading and saving. |
Python: Change or Remove Borders for Tables in Word
Tables are a powerful formatting tool in Word, allowing you to organize and present data effectively. However, the default table borders may not always align with your document's style and purpose. By selectively changing or removing the borders, you can achieve a variety of visual effects to suit your requirements. In this article, we will explore how to change and remove borders for tables in Word documents in Python using Spire.Doc for Python.
Install Spire.Doc for Python
This scenario requires Spire.Doc for Python. It can be easily installed in your Windows through the following pip command.
pip install Spire.Doc
If you are unsure how to install, please refer to this tutorial: How to Install Spire.Doc for Python on Windows
Change Borders for a Table in Word in Python
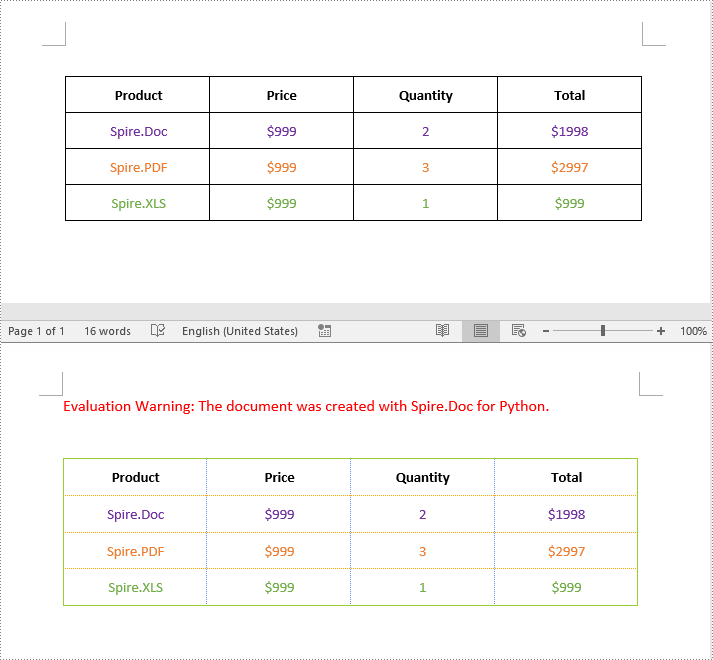
Spire.Doc for Python empowers you to retrieve the borders collection of a table by using the Table.TableFormat.Borders property. Once retrieved, you can access individual borders (like top border, bottom border, left border, right border, horizontal border, and vertical border) from the collection and then modify them by adjusting their line style, width, and color. The detailed steps are as follows.
- Create an object of the Document class.
- Load a Word document using Document.LoadFromFile() method.
- Get a specific section using Document.Sections[index] property.
- Get a specific table using Section.Tables[index] property.
- Get the borders collection of the table using Table.TableFormat.Borders property.
- Get an individual border, such as the top border from the borders collection using Borders.Top property, and then change its line style, width and color.
- Refer to the above step to get other individual borders from the borders collection, and then change their line style, width and color.
- Save the resulting document using Document.SaveToFile() method.
- Python
from spire.doc import *
from spire.doc.common import *

# Create an object of the Document class
document = Document()
# Load a Word document
document.LoadFromFile("Table.docx")

# Add a section to the document
section = document.Sections[0]

# Get the first table in the section
table = section.Tables[0] if isinstance(section.Tables[0], Table) else None

# Get the collection of the borders
borders = table.TableFormat.Borders

# Get the top border and change border style, line width, and color
topBorder = borders.Top
topBorder.BorderType = BorderStyle.Single
topBorder.LineWidth = 1.0
topBorder.Color = Color.get_YellowGreen()

# Get the left border and change border style, line width, and color
leftBorder = borders.Left
leftBorder.BorderType = BorderStyle.Single
leftBorder.LineWidth = 1.0
leftBorder.Color = Color.get_YellowGreen()

# Get the right border and change border style, line width, and color
rightBorder = borders.Right
rightBorder.BorderType = BorderStyle.Single
rightBorder.LineWidth = 1.0
rightBorder.Color = Color.get_YellowGreen()

# Get the bottom border and change border style, line width, and color
bottomBorder = borders.Bottom
bottomBorder.BorderType = BorderStyle.Single
bottomBorder.LineWidth = 1.0
bottomBorder.Color = Color.get_YellowGreen()

# Get the horizontal border and change border style, line width, and color
horizontalBorder = borders.Horizontal
horizontalBorder.BorderType = BorderStyle.Dot
horizontalBorder.LineWidth = 1.0
horizontalBorder.Color = Color.get_Orange()

# Get the vertical border and change border style, line width, and color
verticalBorder = borders.Vertical
verticalBorder.BorderType = BorderStyle.Dot
verticalBorder.LineWidth = 1.0
verticalBorder.Color = Color.get_CornflowerBlue()

# Save the resulting document
document.SaveToFile("ChangeBorders.docx", FileFormat.Docx2013)
document.Close()
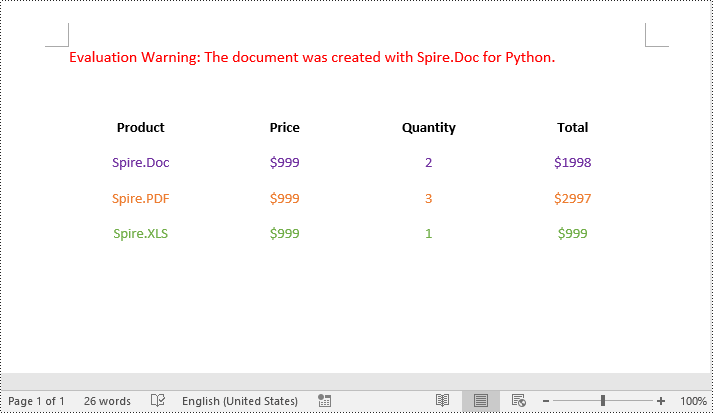
Remove Borders from a Table in Word in Python
To remove borders from a table, you need to set the BorderType property of the borders to BorderStyle.none. The detailed steps are as follows.
- Create an object of the Document class.
- Load a Word document using Document.LoadFromFile() method.
- Get a specific section using Document.Sections[index] property.
- Get a specific table using Section.Tables[index] property.
- Get the borders collection of the table using Table.TableFormat.Borders property.
- Get an individual border, such as the top border from the borders collection using Borders.Top property. Then set the BorderType property of the top border to BorderStyle.none.
- Refer to the above step to get other individual borders from the borders collection and then set the BorderType property of the borders to BorderStyle.none.
- Save the resulting document using Document.SaveToFile() method.
- Python
from spire.doc import *
from spire.doc.common import *

# Initialize an instance of the Document class
document = Document()
document.LoadFromFile("ChangeBorders.docx")

# Add a section to the document
section = document.Sections[0]

# Get the first table in the section
table = section.Tables[0] if isinstance(section.Tables[0], Table) else None

# Get the borders collection of the table
borders = table.TableFormat.Borders

# Remove top border
topBorder = borders.Top
topBorder.BorderType = BorderStyle.none

# Remove left border
leftBorder = borders.Left
leftBorder.BorderType = BorderStyle.none

# Remove right border
rightBorder = borders.Right
rightBorder.BorderType = BorderStyle.none

# Remove bottom border
bottomBorder = borders.Bottom
bottomBorder.BorderType = BorderStyle.none

# remove inside horizontal border
horizontalBorder = borders.Horizontal
horizontalBorder.BorderType = BorderStyle.none

# Remove inside vertical border
verticalBorder = borders.Vertical
verticalBorder.BorderType = BorderStyle.none

# Save the resulting document
document.SaveToFile("RemoveBorders.docx", FileFormat.Docx2013)
document.Close()
Apply for a Temporary License
If you'd like to remove the evaluation message from the generated documents, or to get rid of the function limitations, please request a 30-day trial license for yourself.
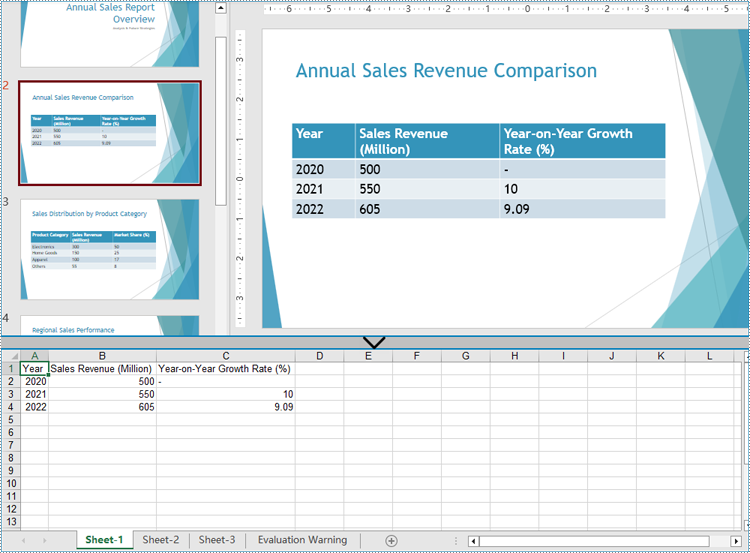
Python: Extract Tables from PowerPoint Presentations
PowerPoint presentations often serve as repositories of essential data and information shared during meetings, lectures, and conferences. They frequently include tables for data presentation and basic analysis. However, to further analyze the data or integrate it into reports and spreadsheets, it becomes necessary to extract these tables and save them in other formats. By leveraging Python, users can efficiently extract tables from PowerPoint presentations, transforming static slides into dynamic data sets ready for processing.
This article aims to demonstrate how to extract tables from PowerPoint presentations and write them to text and Excel worksheets using Spire.Presentation for Python, thereby enhancing the utilization of data in presentations and streamlining the data extraction process.
- Extract Table Data from PowerPoint Presentations to Text Files
- Extract Table Data from PowerPoint Presentations to Excel Worksheets
Install Spire.Presentation for Python
This scenario requires Spire.Presentation for Python and plum-dispatch v1.7.4. They can be easily installed in your Windows through the following pip command.
pip install Spire.Presentation
If you are unsure how to install, please refer to: How to Install Spire.Presentation for Python on Windows
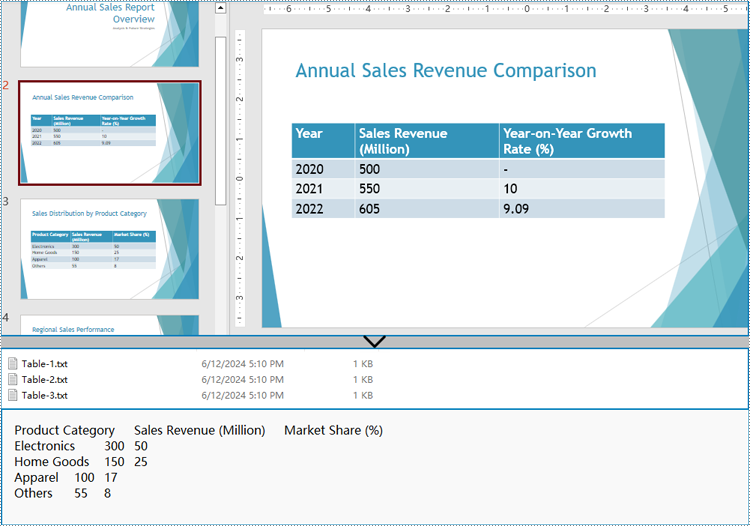
Extract Table Data from PowerPoint Presentations to Text Files
Spire.Presentation for Python provides the ITable class which represents a table in a presentation slide. By iterating through the shapes in each slide to check if it’s an instance of ITable class, developers can retrieve all the tables in the presentation file and get the data in the tables.
The detailed steps for extracting tables from PowerPoint presentations and writing them to text files are as follows:
- Create an instance of Presentation class and load a PowerPoint file using Presentation.LoadFromFile() method.
- Iterate through all the slides in the file and then all the shapes in the slides.
- Check if a shape is an instance of ITable class. If it is, iterate through the rows and then the cells in each row. Get the cell values using TableRow[].TextFrame.Text property and append them to strings.
- Write the table data to text files.
- Python
from spire.presentation import *
from spire.presentation.common import *

# Create an instance of Presentation
presentation = Presentation()

# Load a PowerPoint file
presentation.LoadFromFile("Sample.pptx")

tables = []
# Iterate through all the slides
for slide in presentation.Slides:
    # Iterate through all the shapes
    for shape in slide.Shapes:
        # Check whether the shape is a table
        if isinstance(shape, ITable):
            tableData = ""
            # Iterate through all the rows
            for row in shape.TableRows:
                rowData = ""
                # Iterate through all the cells in the row
                for i in range(0, row.Count):
                    # Get the cell value
                    cellValue = row[i].TextFrame.Text
                    rowData += (cellValue + "\t" if i < row.Count - 1 else cellValue)
                tableData += (rowData + "\n")
            tables.append(tableData)

# Write the tables to text files
for idx, table in enumerate(tables, start=1):
    fileName = f"output/Tables/Table-{idx}.txt"
    with open(fileName, "w") as f:
        f.write(table)
presentation.Dispose()
Extract Table Data from PowerPoint Presentations to Excel Worksheets
After extracting table data from presentations using Spire.Presentation for Python, developers can further utilize Spire.XLS for Python to write this data into Excel worksheets, facilitating further analysis, referencing, and format conversion.
Install Spire.XLS for Python via PyPI:
pip install Spire.XLS
The detailed steps for extracting tables from PowerPoint presentations and writing them to Excel worksheets are as follows:
- Create an instance of Presentation class and load a PowerPoint file using Presentation.LoadFromFile() method.
- Create an instance of Workbook class and clear the default worksheets.
- Iterate through the slides in the presentation and then the shapes in the slides to check if the shapes are instances of ITable class. Append all the ITable instances to a list.
- Iterate through the tables in the list and add a worksheet to the workbook for each table using Workbook.Worksheets.Add() method.
- Iterate through the rows of each table and then the cells in the rows to get the cell values through TableRow.TextFrame.Text property. Write the values to the corresponding cells in the worksheet through Worksheet.Range[].Value property.
- Save the workbook using Workbook.SaveToFile() method.
- Python
from spire.presentation import *
from spire.presentation.common import *
from spire.xls import *
from spire.xls.common import *

# Create an instance of Presentation
presentation = Presentation()

# Load a PowerPoint file
presentation.LoadFromFile("Sample.pptx")

# Create an Excel file and clear the default worksheets
workbook = Workbook()
workbook.Worksheets.Clear()

tables = []
# Iterate through all the slides
for slide in presentation.Slides:
    # Iterate through all the shapes
    for shape in slide.Shapes:
        # Check whether the shape is a table
        if isinstance(shape, ITable):
            tables.append(shape)

# Iterate through all the tables
for t in range(len(tables)):
    table = tables[t]
    sheet = workbook.Worksheets.Add(f"Sheet-{t+1}")
    for i in range(0, table.TableRows.Count):
        row = table.TableRows[i]
        for j in range(0, row.Count):
            sheet.Range[i + 1, j + 1].Value = row[j].TextFrame.Text
    # Autofit rows and columns
    sheet.AllocatedRange.AutoFitColumns()
    sheet.AllocatedRange.AutoFitRows()

# Save the Excel file
workbook.SaveToFile("output/PresentationTables.xlsx", FileFormat.Version2016)

presentation.Dispose()
workbook.Dispose()
Apply for a Temporary License
If you'd like to remove the evaluation message from the generated documents, or to get rid of the function limitations, please request a 30-day trial license for yourself.
Python: Count Words, Pages, Characters, Paragraphs and Lines in Word
Various written documents, such as academic papers, reports, and legal materials, often have specific formatting guidelines that encompass word count, page count, and other essential metrics. Accurately measuring these elements is crucial as it ensures that your document adheres to the required standards and meets the expected quality benchmarks. In this article, we will explain how to count words, pages, characters, paragraphs, and lines in a Word document in Python using Spire.Doc for Python.
- Count Words, Pages, Characters, Paragraphs, and Lines in a Word Document in Python
- Count Words and Characters in a Specific Paragraph of a Word Document in Python
Install Spire.Doc for Python
This scenario requires Spire.Doc for Python. It can be easily installed in your Windows through the following pip commands.
pip install Spire.Doc
If you are unsure how to install, please refer to: How to Install Spire.Doc for Python on Windows
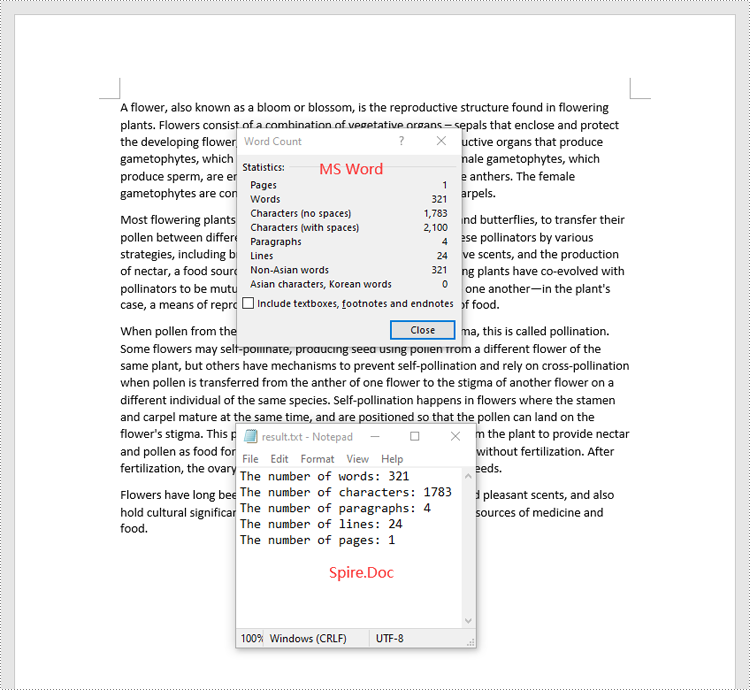
Count Words, Pages, Characters, Paragraphs, and Lines in a Word Document in Python
Spire.Doc for Python offers the BuiltinDocumentProperties class that empowers you to retrieve crucial information from your Word document. By utilizing this class, you can access a wealth of details, including the built-in document properties, as well as the number of words, pages, characters, paragraphs, and lines contained within the document.
The steps below explain how to get the number of words, pages, characters, paragraphs, and lines in a Word document in Python using Spire.Doc for Python:
- Create an object of the Document class.
- Load a Word document using the Document.LoadFromFile() method.
- Get the BuiltinDocumentProperties object using the Document.BuiltinDocumentProperties property.
- Get the number of words, characters, paragraphs, lines, and pages in the document using the WordCount, CharCount, ParagraphCount, LinesCount, PageCount properties of the BuiltinDocumentProperties class, and append the result to a list.
- Write the content of the list into a text file.
- Python
from spire.doc import *
from spire.doc.common import *

# Create an object of the Document class
doc = Document()
# Load a Word document
doc = Document("Input.docx")

# Create a list
sb = []

# Get the built-in properties of the document
properties = doc.BuiltinDocumentProperties

# Get the number of words, characters, paragraphs, lines, and pages and append the result to the list
sb.append("The number of words: " + str(properties.WordCount))
sb.append("The number of characters: " + str(properties.CharCount))
sb.append("The number of paragraphs: " + str(properties.ParagraphCount))
sb.append("The number of lines: " + str(properties.LinesCount))
sb.append("The number of pages: " + str(properties.PageCount))

# Save the data in the list to a text file
with open("result.txt", "w") as file:
file.write("\n".join(sb))

doc.Close()
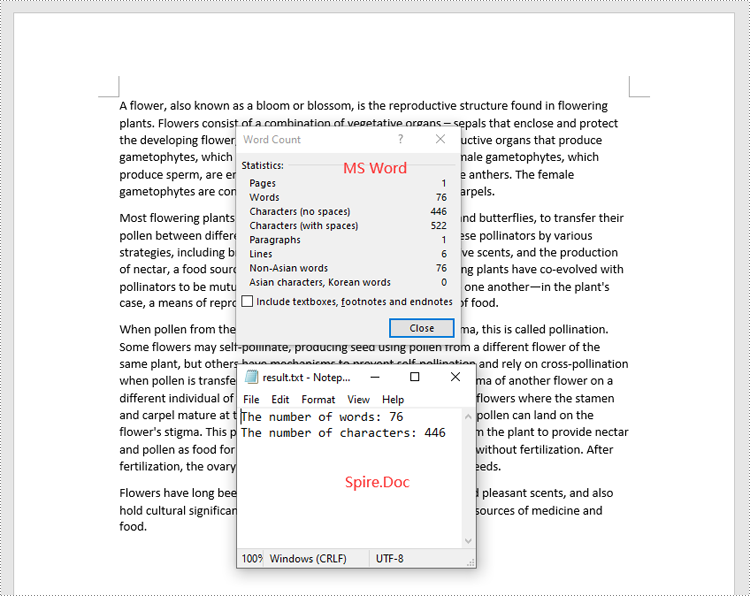
Count Words and Characters in a Specific Paragraph of a Word Document in Python
In addition to retrieving the overall word count, page count, and other metrics for an entire Word document, you are also able to get the word count and character count for a specific paragraph by using the Paragraph.WordCount and Paragraph.CharCount properties.
The steps below explain how to get the number of words and characters of a paragraph in a Word document in Python using Spire.Doc for Python:
- Create an object of the Document class.
- Load a Word document using the Document.LoadFromFile() method.
- Get a specific paragraph using the Document.Sections[sectionIndex].Paragraphs[paragraphIndex] property.
- Get the number of words and characters in the paragraph using the Paragraph.WordCount and Paragraph.CharCount properties, and append the result to a list.
- Write the content of the list into a text file.
- Python
from spire.doc import *
from spire.doc.common import *

# Create an object of the Document class
doc = Document()
# Load a Word document
doc = Document("Input.docx")

# Get a specific paragraph
paragraph = doc.Sections[0].Paragraphs[0]

# Create a list
sb = []

# Get the number of words and characters in the paragraph and append the result to the list
sb.append("The number of words: " + str(paragraph.WordCount))
sb.append("The number of characters: " + str(paragraph.CharCount))

# Save the data in the list to a text file
with open("result.txt", "w") as file:
file.write("\n".join(sb))

doc.Close()
Apply for a Temporary License
If you'd like to remove the evaluation message from the generated documents, or to get rid of the function limitations, please request a 30-day trial license for yourself.
Spire.PDF for Python 10.6.1 supports comparing PDF documents
We're pleased to announce the release of Spire.PDF for Python 10.6.1. This version supports comparing PDF documents and fixes some known issues, such as the application throwing an exception when obtaining image coordinates. More details are listed below.
Here is a list of changes made in this release
| Category | ID | Description |
| New feature | SPIREPDF-6784 | Supports comparing PDF documents.
pdf1 = PdfDocument() pdf1.LoadFromFile(inputFile_1) pdf2 = PdfDocument() pdf2.LoadFromFile(inputFile_2) comparer = PdfComparer(pdf1, pdf2) comparer.Compare(outputFile) |
| Bug | SPIREPDF-6764 | Fixes the issue that the application threw an exception when obtaining image coordinates. |
| Bug | SPIREPDF-6795 | Fixes the issue that the application threw an exception when getting images using the PdfImageHelper.GetImagesInfo() method. |
| Bug | SPIREPDF-6809 | Fixes the issue that the application threw an exception when setting the markup color using the PdfTextMarkupAnnotation.TextMarkupColor property. |
Spire.PDF 10.6.7 supports converting PDF to Markdown
We are delighted to announce the release of Spire.PDF 10.6.7. This version supports converting PDF documents to Markdown files. More details are listed below.
Here is a list of changes made in this release
| Category | ID | Description |
| New feature | - | Supports converting PDF documents to Markdown files.
PdfDocument doc = new PdfDocument("input.pdf");
doc.SaveToFile("output.md", FileFormat.Markdown);
|