When creating charts from scratch in PowerPoint slide, an Excel sheet with some dummy data will automatically be generated. The dummy data can be overwritten with the data from data source as well as from an existing Excel file. This article demonstrates how we can create chart in PowerPoint using the data in Excel file.
This solution requires Spire.Presneation.dll and Spire.Xls.dll to be added as references in project. Please download Spire.Office and reference the corresponding DLLs from it.
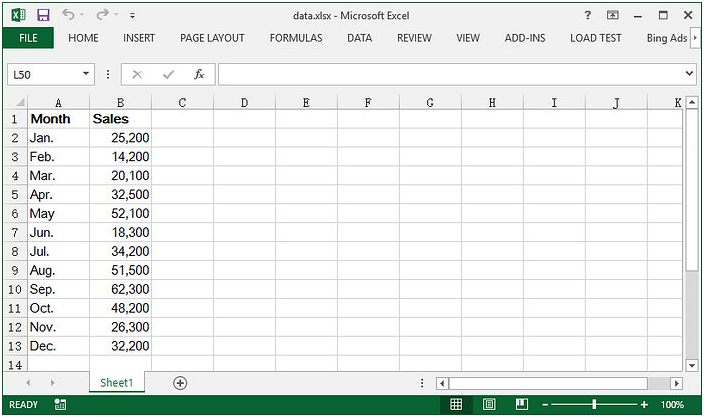
Here is the Excel sheet containing our sample data.
Step 1: Create a Presentation document.
Presentation ppt = new Presentation();
Step 2: Append a column chart in the first slide.
RectangleF rect = new RectangleF(40, 100, 550, 320);
IChart chart = ppt.Slides[0].Shapes.AppendChart(ChartType.ColumnClustered, rect);
Step 3: Clear the default dummy data.
chart.ChartData.Clear(0, 0, 5, 5);
Step 4: Load an existing Excel file to Workbook instance and get the first worksheet.
Workbook wb = new Workbook();
wb.LoadFromFile("data.xlsx");
Worksheet sheet = wb.Worksheets[0];
Step 5: Import data from the worksheet to chart table.
for (int r = 0; r < sheet.AllocatedRange.RowCount; r++)
{
    for (int c = 0; c < sheet.AllocatedRange.ColumnCount; c++)
    {
        chart.ChartData[r, c].Value = sheet.Range[r + 1, c + 1].Value2;
    }
}
Step 6: Set the series label and categories labels.
chart.Series.SeriesLabel = chart.ChartData["B1", "B1"];
chart.Categories.CategoryLabels = chart.ChartData["A2","A13"];
Step 7: Set the series values.
chart.Series[0].Values = chart.ChartData["B2","B13"];
Step 8: Save the file.
ppt.SaveToFile("chart.pptx",Spire.Presentation.FileFormat.Pptx2013);
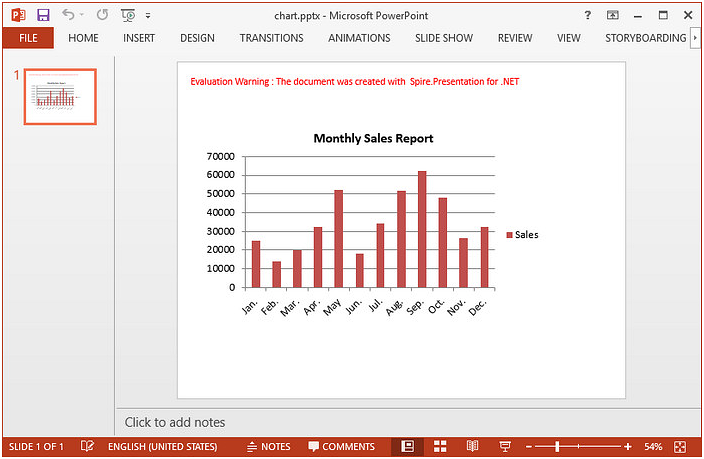
Output:
Full Code:
using System;
using Spire.Presentation;
using System.Drawing;
using Spire.Presentation.Charts;
using Spire.Xls;

namespace CreateChartFromExcelData
{
    class Program
    {
        static void Main(string[] args)
        {
            //initialize an instance of Presentation class
            Presentation ppt = new Presentation();
            RectangleF rect = new RectangleF(40, 100, 550, 320);
            IChart chart = ppt.Slides[0].Shapes.AppendChart(ChartType.ColumnClustered, rect);

            //clear the default dummy data
            chart.ChartData.Clear(0, 0, 5, 5);

            //load an existing Excel file to Workbook object
            Workbook wb = new Workbook();
            wb.LoadFromFile("data.xlsx");
            Worksheet sheet = wb.Worksheets[0];

            //import data from the sheet to chart table
            for (int r = 0; r < sheet.AllocatedRange.RowCount; r++)
            {
                for (int c = 0; c < sheet.AllocatedRange.ColumnCount; c++)
                {
                    chart.ChartData[r, c].Value = sheet.Range[r + 1, c + 1].Value2;
                }
            }

            //add chart title
            chart.ChartTitle.TextProperties.Text = "Monthly Sales Report";
            chart.ChartTitle.TextProperties.IsCentered = true;
            chart.ChartTitle.Height = 30;
            chart.HasTitle = true;

            //set the series label
            chart.Series.SeriesLabel = chart.ChartData["B1", "B1"];

            //set the category labels
            chart.Categories.CategoryLabels = chart.ChartData["A2","A13"];

            //set the series values
            chart.Series[0].Values = chart.ChartData["B2","B13"];

            //save the file
            ppt.SaveToFile("chart.pptx",Spire.Presentation.FileFormat.Pptx2013);
        }
    }
}
Imports Spire.Presentation
Imports System.Drawing
Imports Spire.Presentation.Charts
Imports Spire.Xls

Namespace CreateChartFromExcelData
    Class Program
        Private Shared Sub Main(args As String())
			'initialize an instance of Presentation class
			Dim ppt As New Presentation()

            Dim rect As New RectangleF(40, 100, 550, 320)

            Dim chart As IChart = ppt.Slides(0).Shapes.AppendChart(ChartType.ColumnClustered, rect)

			'clear the default dummy data
			chart.ChartData.Clear(0, 0, 5, 5)

			'load an existing Excel file to Workbook object
			Dim wb As New Workbook()

            wb.LoadFromFile("data.xlsx")
			Dim sheet As Worksheet = wb.Worksheets(0)

			'import data from the sheet to chart table
			For r As Integer = 0 To sheet.AllocatedRange.RowCount - 1
				For c As Integer = 0 To sheet.AllocatedRange.ColumnCount - 1

                    chart.ChartData(r, c).Value = sheet.Range(r + 1, c + 1).Value2
                Next

            Next

			'add chart title
			chart.ChartTitle.TextProperties.Text = "Monthly Sales Report"
			chart.ChartTitle.TextProperties.IsCentered = True
            chart.ChartTitle.Height = 30
			chart.HasTitle = True

			'set the series label

            chart.Series.SeriesLabel = chart.ChartData("B1", "B1")

			'set the category labels

            chart.Categories.CategoryLabels = chart.ChartData("A2", "A13")

			'set the series values

            chart.Series(0).Values = chart.ChartData("B2", "B13")

			'save the file
			ppt.SaveToFile("chart.pptx", Spire.Presentation.FileFormat.Pptx2013)
		End Sub

    End Class
End Namespace