If you have a line, (xy) scatter, or radar chart, you can change the look of the data markers to make them easier to distinguish. In this article, you will learn how to set different colors for different data markers, by using Spire.Presentation with C# and VB.NET.
Step 1: Load a sample PowerPoint file.
Presentation ppt = new Presentation();
ppt.LoadFromFile("ScatterChart.pptx");
Step 2: Get the chart from the presentation.
IChart chart = ppt.Slides[0].Shapes[0] as IChart;
Step 3: Create a ChartDataPoint object and specify the index.
ChartDataPoint dataPoint = new ChartDataPoint(chart.Series[0]);
dataPoint.Index = 0;
Step 4: Set the fill color of the data marker.
dataPoint.MarkerFill.Fill.FillType = FillFormatType.Solid;
dataPoint.MarkerFill.Fill.SolidColor.Color = Color.Red;
Step 5: Set the line color of the data marker.
dataPoint.MarkerFill.Line.FillType = FillFormatType.Solid;
dataPoint.MarkerFill.Line.SolidFillColor.Color = Color.Red;
Step 6: Add the data point to the point collection of a series.
chart.Series[0].DataPoints.Add(dataPoint);
Step 7: Save to file.
ppt.SaveToFile("result.pptx", FileFormat.Pptx2010);
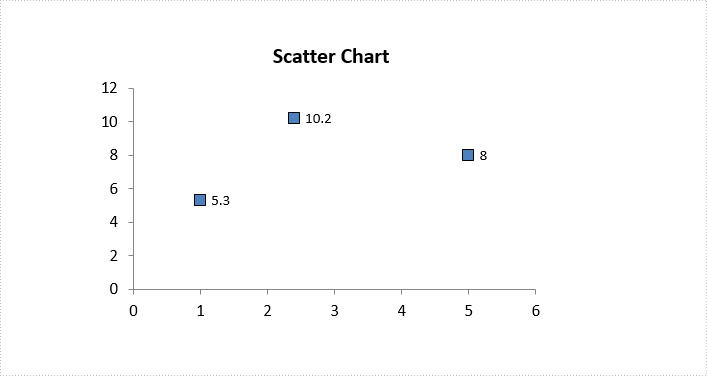
Source File:
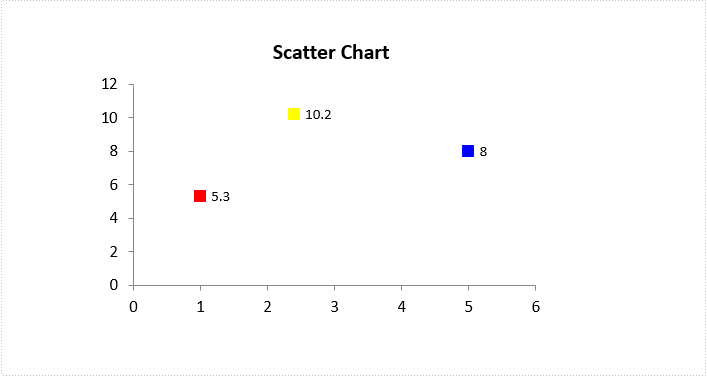
Result:
Full Code:
[C#]
Presentation ppt = new Presentation();
ppt.LoadFromFile("ScatterChart.pptx");
IChart chart = ppt.Slides[0].Shapes[0] as IChart;

ChartDataPoint dataPoint = new ChartDataPoint(chart.Series[0]);
dataPoint.Index = 0;
dataPoint.MarkerFill.Fill.FillType = FillFormatType.Solid;
dataPoint.MarkerFill.Fill.SolidColor.Color = Color.Red;
dataPoint.MarkerFill.Line.FillType = FillFormatType.Solid;
dataPoint.MarkerFill.Line.SolidFillColor.Color = Color.Red;
chart.Series[0].DataPoints.Add(dataPoint);

dataPoint = new ChartDataPoint(chart.Series[0]);
dataPoint.Index = 1;
dataPoint.MarkerFill.Fill.FillType = FillFormatType.Solid;
dataPoint.MarkerFill.Fill.SolidColor.Color = Color.Yellow;
dataPoint.MarkerFill.Line.FillType = FillFormatType.Solid;
dataPoint.MarkerFill.Line.SolidFillColor.Color = Color.Yellow;
chart.Series[0].DataPoints.Add(dataPoint);

dataPoint = new ChartDataPoint(chart.Series[0]);
dataPoint.Index = 2;
dataPoint.MarkerFill.Fill.FillType = FillFormatType.Solid;
dataPoint.MarkerFill.Fill.SolidColor.Color = Color.Blue;
dataPoint.MarkerFill.Line.FillType = FillFormatType.Solid;
dataPoint.MarkerFill.Line.SolidFillColor.Color = Color.Blue;
chart.Series[0].DataPoints.Add(dataPoint);

ppt.SaveToFile("result.pptx", FileFormat.Pptx2010);
[VB.NET]
using Spire.Presentation;
using Spire.Presentation.Charts;
using Spire.Presentation.Drawing;
using System.Drawing;

namespace VaryColor
{
    class Program
    {
        static void Main(string[] args)
        {
            Presentation ppt = new Presentation();
            ppt.LoadFromFile("ScatterChart.pptx");
            IChart chart = ppt.Slides[0].Shapes[0] as IChart;

            ChartDataPoint dataPoint = new ChartDataPoint(chart.Series[0]);
            dataPoint.Index = 0;
            dataPoint.MarkerFill.Fill.FillType = FillFormatType.Solid;
            dataPoint.MarkerFill.Fill.SolidColor.Color = Color.Red;
            dataPoint.MarkerFill.Line.FillType = FillFormatType.Solid;
            dataPoint.MarkerFill.Line.SolidFillColor.Color = Color.Red;
            chart.Series[0].DataPoints.Add(dataPoint);

            dataPoint = new ChartDataPoint(chart.Series[0]);
            dataPoint.Index = 1;
            dataPoint.MarkerFill.Fill.FillType = FillFormatType.Solid;
            dataPoint.MarkerFill.Fill.SolidColor.Color = Color.Yellow;
            dataPoint.MarkerFill.Line.FillType = FillFormatType.Solid;
            dataPoint.MarkerFill.Line.SolidFillColor.Color = Color.Yellow;
            chart.Series[0].DataPoints.Add(dataPoint);

            dataPoint = new ChartDataPoint(chart.Series[0]);
            dataPoint.Index = 2;
            dataPoint.MarkerFill.Fill.FillType = FillFormatType.Solid;
            dataPoint.MarkerFill.Fill.SolidColor.Color = Color.Blue;
            dataPoint.MarkerFill.Line.FillType = FillFormatType.Solid;
            dataPoint.MarkerFill.Line.SolidFillColor.Color = Color.Blue;
            chart.Series[0].DataPoints.Add(dataPoint);

            ppt.SaveToFile("result.pptx", FileFormat.Pptx2010);
        }
    }
}