Error bars in charts can help us to see margins of error and standard deviations at a glance. We can use error bars in area, bar, column, line, and XY charts. In XY charts i.e. scatter and bubble charts, we can show X (Horizontal) and Y (Vertical) error bars. However if the chart type is not XY, the error bars for X values are disabled.
This article demonstrates how to add and format error bars for non-XY and XY charts in a PowerPoint document using Spire.Presentation and C#.
Detail steps:
Step 1: Initialize an object of Presentation class and load the PowerPoint document.
Presentation ppt = new Presentation();
ppt.LoadFromFile("Input.pptx");
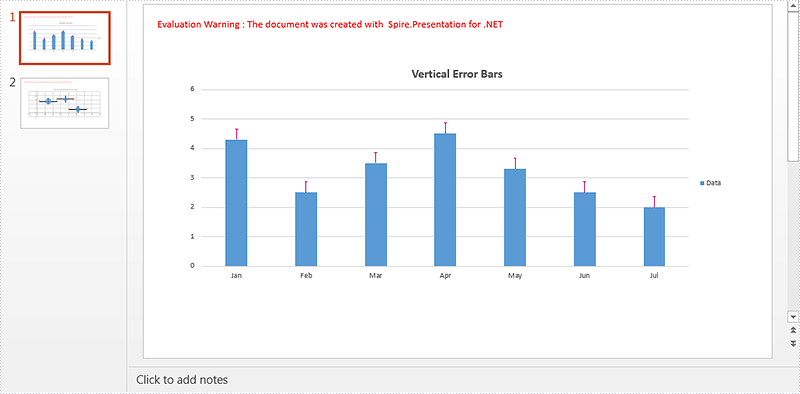
Step 2: Get the column chart on the first slide and set chart title.
IChart columnChart = ppt.Slides[0].Shapes[0] as IChart;
columnChart.ChartTitle.TextProperties.Text = "Vertical Error Bars";
Step 3: Add Y (Vertical) error bars to the first chart series and format the error bars.
//Get Y error bars of the first chart series
IErrorBarsFormat errorBarsYFormat1 = columnChart.Series[0].ErrorBarsYFormat;
//Set end cap
errorBarsYFormat1.ErrorBarNoEndCap = false;
//Specify direction
errorBarsYFormat1.ErrorBarSimType = ErrorBarSimpleType.Plus;
//Specify error amount type
errorBarsYFormat1.ErrorBarvType = ErrorValueType.StandardError;
//Set value
errorBarsYFormat1.ErrorBarVal = 0.3f;
//Set line format
errorBarsYFormat1.Line.FillType = FillFormatType.Solid;
errorBarsYFormat1.Line.SolidFillColor.Color = Color.MediumVioletRed;
errorBarsYFormat1.Line.Width = 1;
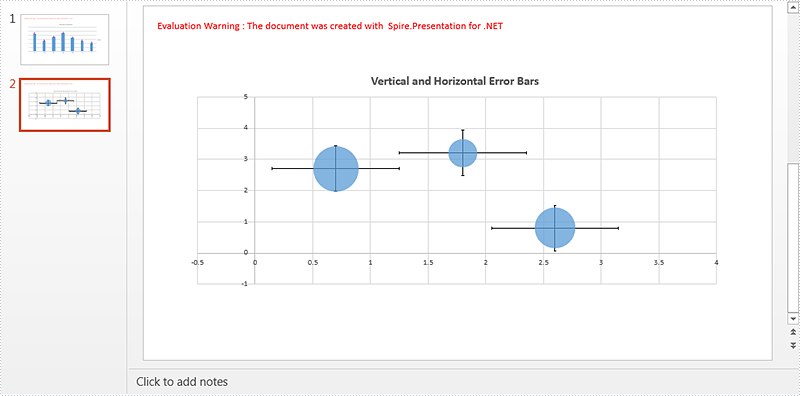
Step 4: Get the bubble chart on the second slide and set chart title.
IChart chart2 = ppt.Slides[1].Shapes[0] as IChart;
chart2.ChartTitle.TextProperties.Text = "Vertical and Horizontal Error Bars";
Step 5: Add x (Horizontal) and Y (Vertical) error bars to the first chart series and format the error bars.
//Get X error bars of the first chart series
IErrorBarsFormat errorBarsXFormat = bubbleChart.Series[0].ErrorBarsXFormat;
//Set end cap
errorBarsXFormat.ErrorBarNoEndCap = false;
//Specify direction
errorBarsXFormat.ErrorBarSimType = ErrorBarSimpleType.Both;

//Specify error amount type
errorBarsXFormat.ErrorBarvType = ErrorValueType.StandardError;
//Set value
errorBarsXFormat.ErrorBarVal = 0.3f;

//Get Y error bars of the first chart series
IErrorBarsFormat errorBarsYFormat2 = bubbleChart.Series[0].ErrorBarsYFormat;
//Set end cap
errorBarsYFormat2.ErrorBarNoEndCap = false;
//Specify direction
errorBarsYFormat2.ErrorBarSimType = ErrorBarSimpleType.Both;
//Specify error amount type
errorBarsYFormat2.ErrorBarvType = ErrorValueType.StandardError;
//Set value
errorBarsYFormat2.ErrorBarVal = 0.3f;
Step 6: Save the document.
ppt.SaveToFile("ErrorBars.pptx", FileFormat.Pptx2013);
Screenshot:
Full code:
using System.Drawing;
using Spire.Presentation;
using Spire.Presentation.Charts;
using Spire.Presentation.Drawing;

namespace Add_error_bars_to_chart_in_PPT
{
    class Program
    {
        static void Main(string[] args)
        {
            //Load the PowerPoint document
            Presentation ppt = new Presentation();
            ppt.LoadFromFile("Input.pptx");

            //Get the column chart on the first slide and set chart title
            IChart columnChart = ppt.Slides[0].Shapes[0] as IChart;
            columnChart.ChartTitle.TextProperties.Text = "Vertical Error Bars";

            //Add Y (Vertical) Error Bars

            //Get Y error bars of the first chart series
            IErrorBarsFormat errorBarsYFormat1 = columnChart.Series[0].ErrorBarsYFormat;
            //Set end cap
            errorBarsYFormat1.ErrorBarNoEndCap = false;
            //Specify direction
            errorBarsYFormat1.ErrorBarSimType = ErrorBarSimpleType.Plus;
            //Specify error amount type
            errorBarsYFormat1.ErrorBarvType = ErrorValueType.StandardError;
            //Set value
            errorBarsYFormat1.ErrorBarVal = 0.3f;
            //Set line format
            errorBarsYFormat1.Line.FillType = FillFormatType.Solid;
            errorBarsYFormat1.Line.SolidFillColor.Color = Color.MediumVioletRed;
            errorBarsYFormat1.Line.Width = 1;

            //Get the bubble chart on the second slide and set chart title
            IChart bubbleChart = ppt.Slides[1].Shapes[0] as IChart;
            bubbleChart.ChartTitle.TextProperties.Text = "Vertical and Horizontal Error Bars";

            //Add X (Horizontal) and Y (Vertical) Error Bars

            //Get X error bars of the first chart series
            IErrorBarsFormat errorBarsXFormat = bubbleChart.Series[0].ErrorBarsXFormat;
            //Set end cap
            errorBarsXFormat.ErrorBarNoEndCap = false;
            //Specify direction
            errorBarsXFormat.ErrorBarSimType = ErrorBarSimpleType.Both;
            //Specify error amount type
            errorBarsXFormat.ErrorBarvType = ErrorValueType.StandardError;
            //Set value
            errorBarsXFormat.ErrorBarVal = 0.3f;

            //Get Y error bars of the first chart series
            IErrorBarsFormat errorBarsYFormat2 = bubbleChart.Series[0].ErrorBarsYFormat;
            //Set end cap
            errorBarsYFormat2.ErrorBarNoEndCap = false;
            //Specify direction
            errorBarsYFormat2.ErrorBarSimType = ErrorBarSimpleType.Both;
            //Specify error amount type
            errorBarsYFormat2.ErrorBarvType = ErrorValueType.StandardError;
            //Set value
            errorBarsYFormat2.ErrorBarVal = 0.3f;

            //Save the document
            ppt.SaveToFile("ErrorBars.pptx", FileFormat.Pptx2013);
        }
    }
}