This article demonstrates how to add data labels to a chart and set the appearance (border style and fill style) for the data labels in PowerPoint using Spire.Presentation for Java. Note some chart types like Surface3D, Surface3DNoColor, Contour and ContourNoColor do not support data labels.
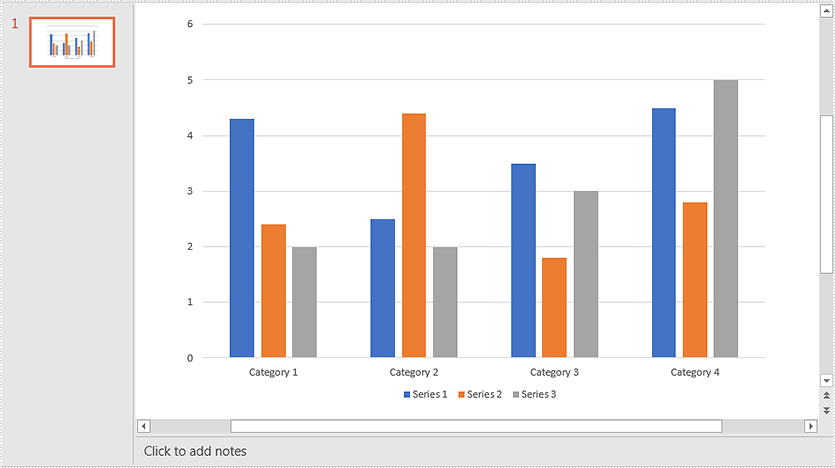
Below screenshot shows the original chart before adding data labels:
import com.spire.presentation.FileFormat;
import com.spire.presentation.ISlide;
import com.spire.presentation.Presentation;
import com.spire.presentation.charts.IChart;
import com.spire.presentation.charts.entity.ChartDataLabel;
import com.spire.presentation.charts.entity.ChartSeriesDataFormat;
import com.spire.presentation.drawing.FillFormatType;

import java.awt.*;

public class AddDataLabelsToChart {
    public static void main(String[] args) throws Exception {
        //Load the PowerPoint document
        Presentation ppt = new Presentation();
        ppt.loadFromFile("Chart.pptx");

        //Get the first slide
        ISlide slide = ppt.getSlides().get(0);
        //Get the chart in the slide
        IChart chart = (IChart)slide.getShapes().get(0);

        //Loop through the series in the chart
        for (ChartSeriesDataFormat series:(Iterable<ChartSeriesDataFormat>)chart.getSeries()) {
             ) {
            //Add data labels for the data points in each series
            for(int i = 0; i < 4; i++){
                ChartDataLabel dataLabel = series.getDataLabels().add();
                //Show label value
                dataLabel.setLabelValueVisible(true);
                //Show series name
                dataLabel.setSeriesNameVisible(true);
                //Set border line style
                dataLabel.getLine().setFillType(FillFormatType.SOLID);
                dataLabel.getLine().getSolidFillColor().setColor(Color.RED);
                //Set fill style
                dataLabel.getFill().setFillType(FillFormatType.SOLID);
                dataLabel.getFill().getSolidColor().setColor(Color.YELLOW);
            }
        }

        //Save the resultant document
        ppt.saveToFile("DataLabels.pptx", FileFormat.PPTX_2013);
    }
}
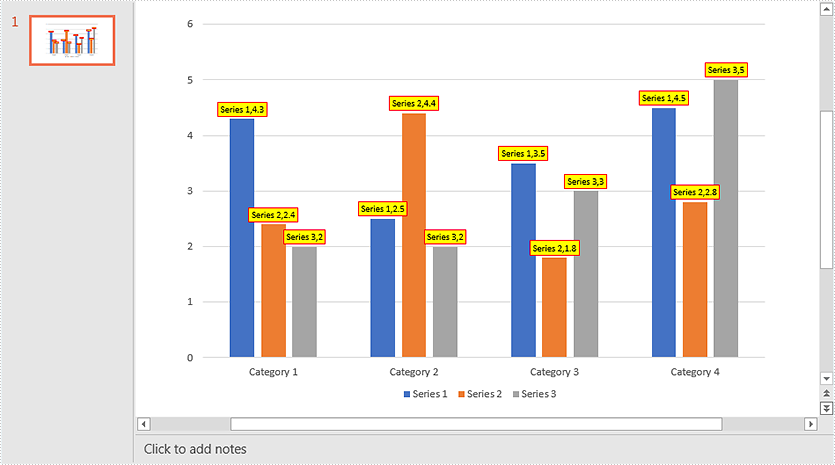
Output: