Adicionar Conectores de Seta no Excel em JavaScript (React)
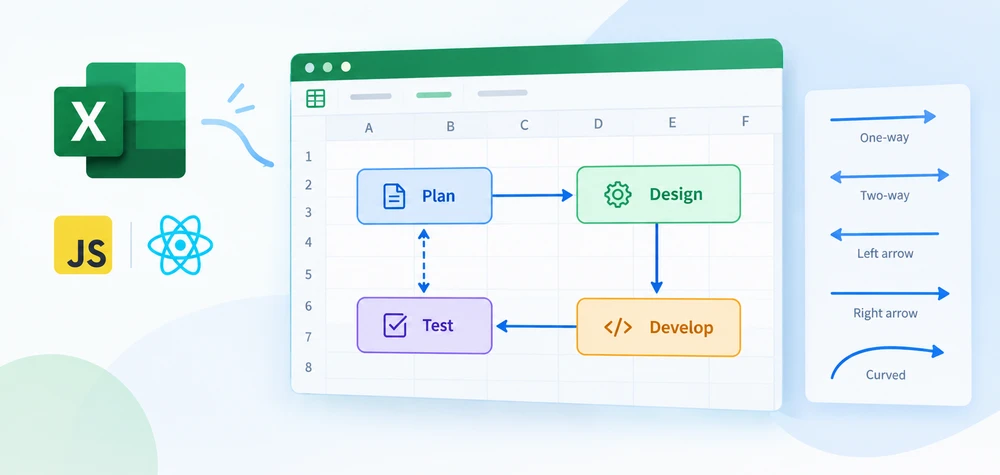
Uma linha entre duas caixas em um fluxograma diz "estas estão relacionadas". Uma seta de uma para a outra diz "esta vem primeiro". Essa distinção — direção — é o que separa um conector de uma decoração, e é justamente o que a API básica Lines.AddLine() não consegue fazer nas duas extremidades. Um fluxo de processo precisa de uma seta saindo de cada etapa; um diagrama de causa e efeito precisa de setas apontando para dentro; uma comparação às vezes precisa de setas de ponta dupla para mostrar um vínculo bidirecional. Nenhum desses casos é possível com um único EndArrowHeadStyle.
O Spire.XLS for JavaScript fornece sheet.TypedLines.AddLine() exatamente para esse caso. Ele posiciona linhas por coordenadas em pixels em vez de linha e coluna, e aceita BeginArrowHeadStyle e EndArrowHeadStyle de forma independente — então uma linha pode ter uma seta em uma extremidade, em ambas ou em nenhuma. O mecanismo é executado no navegador em WebAssembly, com arquivos trafegando por um sistema de arquivos virtual (VFS) e sem envolvimento de backend.
Para a configuração do projeto, consulte Integrando o Spire.XLS for JavaScript em um Projeto React. Os exemplos abaixo pressupõem que o pacote está instalado e que o módulo WebAssembly foi inicializado.
A direção muda tudo
Três diagramas, três requisitos direcionais diferentes, e a mesma API de linha dá conta de todos eles:
| Tipo de diagrama | Configuração de setas | O que comunica |
|---|---|---|
| Fluxo de processo | Seta apenas na extremidade final | Execução sequencial — a etapa A leva à etapa B |
| Cadeia causal | Seta apenas na extremidade final, várias linhas em sequência | A causa produz o efeito, que produz o próximo efeito |
| Vínculo bidirecional | Seta em ambas as extremidades | Relação mútua — A afeta B e B afeta A |
| Indicador de anotação | Seta na extremidade final, sem seta no início | Um rótulo aponta para a célula que descreve |
O estilo da ponta da seta também carrega significado. Uma seta preenchida sólida (LineArrow) é lida como uma conexão definida e comprometida. Uma seta aberta (LineArrowOpen) é lida como uma conexão mais solta e menos certa — comum em diagramas de fluxo de dados, em que a direção é conhecida, mas o mecanismo não é especificado.
Pré-requisitos
Você precisa de um projeto React com o Spire.XLS for JavaScript instalado e o módulo WebAssembly inicializado, acessível em window.wasmModule.spirexls. O exemplo carrega uma fonte no VFS e salva com o sinalizador de versão do Excel 2010.
TypedLines vs Lines: qual é a diferença
sheet.Lines.AddLine() e sheet.TypedLines.AddLine() são duas APIs separadas para duas necessidades separadas. As diferenças são estruturais, não cosméticas:
Lines.AddLine() |
TypedLines.AddLine() |
|
|---|---|---|
| Posicionamento | Coordenadas de linha e coluna | Coordenadas em pixels (Top, Left) |
| Tamanho | width e height no construtor |
Width e Height como propriedades |
| Seta na extremidade final | EndArrowHeadStyle |
EndArrowHeadStyle |
| Seta no início | Não suportado | BeginArrowHeadStyle |
| Tipo de linha | Definido via lineShapeType no construtor |
Definido pela propriedade LineShapeType |
| Melhor para | Formas de linha simples alinhadas às células | Conectores direcionais com posicionamento preciso |
O suporte a seta no início é a diferença mais significativa. Com Lines.AddLine(), uma linha pode ter uma ponta de seta na extremidade final, mas não no início — o que é suficiente para um fluxo unidirecional, mas não para um vínculo bidirecional. TypedLines.AddLine() elimina essa restrição.
Para formas de linha básicas sem setas, Inserir Formas de Linha no Excel em JavaScript (React) aborda a API Lines.AddLine().
Posicionamento preciso em pixels
TypedLines.AddLine() posiciona linhas usando Top e Left em pixels, com Width e Height controlando a extensão:
let line = sheet.TypedLines.AddLine();
line.Top = 10;     // 10 pixels from the top of the sheet
line.Left = 20;    // 20 pixels from the left
line.Width = 100;  // 100 pixels wide
line.Height = 0;   // 0 height — a horizontal line
Um Height de 0 produz uma linha horizontal; um Width de 0 produz uma linha vertical. Definir ambos com valores diferentes de zero produz uma diagonal ou um conector dobrado, dependendo do LineShapeType.
A mudança de coordenadas de linha e coluna para coordenadas em pixels é mais importante quando as linhas precisam conectar pontos específicos dentro das células — o meio de um intervalo mesclado, a borda de uma borda — em vez de se alinharem aos limites das células. O posicionamento em pixels permite calcular o início e o fim exatos a partir do layout que você conhece, em vez de estimar qual linha e coluna chega mais perto.
Combinações de setas
Com BeginArrowHeadStyle e EndArrowHeadStyle definidos de forma independente, quatro combinações cobrem os casos comuns:
| Início | Fim | Visual | Significado |
|---|---|---|---|
LineNoArrow |
LineArrow |
→ | Direção unidirecional: A leva a B |
LineArrow |
LineArrow |
↔ | Bidirecional: A e B se afetam mutuamente |
LineArrow |
LineNoArrow |
← | Unidirecional reversa: B leva a A (raro, mas útil para layouts da direita para a esquerda) |
LineNoArrow |
LineNoArrow |
— | Sem direção: um conector simples (use Lines.AddLine() em vez disso para simplificar) |
O estilo da seta também pode ser LineArrowOpen — um formato de V aberto em vez de um triângulo preenchido — em qualquer uma das extremidades. Misturar estilos nas duas extremidades é válido: uma seta preenchida em uma extremidade e uma seta aberta na outra comunicam que uma direção é definida e a outra é incerta.
Inserir linhas com setas
O exemplo insere seis linhas com setas em uma nova planilha, cobrindo as combinações comuns: uma linha de seta dupla, uma linha de seta simples, um conector de seta em cotovelo, um conector de seta dupla em cotovelo, um conector de seta curvo e um conector de seta dupla curvo. As etapas são:
- Crie um objeto
Workbooke obtenha a primeira planilha. - Chame
Worksheet.TypedLines.AddLine()para criar cada linha. - Defina a posição da linha por meio de
Top,Left,WidtheHeight(em pixels). - Defina os estilos de seta nas duas extremidades por meio de
BeginArrowHeadStyleeEndArrowHeadStyle. - Especifique o tipo de linha por meio de
LineShapeType(reta, cotovelo, curva, etc.). - Salve a pasta de trabalho com
Workbook.SaveToFile().
function App() {
  const addArrowLines = async () => {
    // Get the Spire.XLS WASM module
    const xlsModule = window.wasmModule?.spirexls;

    // Check whether the module is ready
    if (!xlsModule) {
      alert('Spire.Xls is not ready yet');
      return;
    }

    // Load the font into the VFS for text measurement and column auto-fit
    await window.spire.FetchFileToVFS('ARIAL.TTF', '/Library/Fonts/', `${process.env.PUBLIC_URL}/font/`);

    // Create a new workbook and get the first worksheet
    const workbook = new xlsModule.Workbook();
    const sheet = workbook.Worksheets.get(0);

    // Add a double-arrow line - solid blue
    let line = sheet.TypedLines.AddLine();
    line.Top = 10;
    line.Left = 20;
    line.Width = 100;
    line.Height = 0;
    line.Color = xlsModule.Color.get_Blue();
    line.BeginArrowHeadStyle = xlsModule.ShapeArrowStyleType.LineArrow;
    line.EndArrowHeadStyle = xlsModule.ShapeArrowStyleType.LineArrow;

    // Add a single-arrow line - solid red
    let line_1 = sheet.TypedLines.AddLine();
    line_1.Top = 50;
    line_1.Left = 30;
    line_1.Width = 100;
    line_1.Height = 100;
    line_1.Color = xlsModule.Color.get_Red();
    line_1.BeginArrowHeadStyle = xlsModule.ShapeArrowStyleType.LineNoArrow;
    line_1.EndArrowHeadStyle = xlsModule.ShapeArrowStyleType.LineArrow;

    // Add an elbow arrow connector
    let line3 = sheet.TypedLines.AddLine();
    line3.LineShapeType = xlsModule.LineShapeType.ElbowLine;
    line3.Width = 30;
    line3.Height = 50;
    line3.EndArrowHeadStyle = xlsModule.ShapeArrowStyleType.LineArrow;
    line3.Top = 100;
    line3.Left = 50;

    // Add an elbow double-arrow connector
    let line2 = sheet.TypedLines.AddLine();
    line2.LineShapeType = xlsModule.LineShapeType.ElbowLine;
    line2.Width = 50;
    line2.Height = 50;
    line2.EndArrowHeadStyle = xlsModule.ShapeArrowStyleType.LineArrow;
    line2.BeginArrowHeadStyle = xlsModule.ShapeArrowStyleType.LineArrow;
    line2.Left = 120;
    line2.Top = 100;

    // Add a curved arrow connector
    line3 = sheet.TypedLines.AddLine();
    line3.LineShapeType = xlsModule.LineShapeType.CurveLine;
    line3.Width = 30;
    line3.Height = 50;
    line3.EndArrowHeadStyle = xlsModule.ShapeArrowStyleType.LineArrowOpen;
    line3.Top = 100;
    line3.Left = 200;

    // Add a curved double-arrow connector
    line2 = sheet.TypedLines.AddLine();
    line2.LineShapeType = xlsModule.LineShapeType.CurveLine;
    line2.Width = 30;
    line2.Height = 50;
    line2.EndArrowHeadStyle = xlsModule.ShapeArrowStyleType.LineArrowOpen;
    line2.BeginArrowHeadStyle = xlsModule.ShapeArrowStyleType.LineArrowOpen;
    line2.Left = 250;
    line2.Top = 100;

    // Save the workbook
    const outputFileName = 'AddArrowLines.xlsx';
    workbook.SaveToFile({ fileName: outputFileName, version: xlsModule.ExcelVersion.Version2010 });

    // Release resources
    workbook.Dispose();

    // Read the saved file from the VFS and trigger the download
    const fileArray = window.dotnetRuntime.Module.FS.readFile(outputFileName);
    const blob = new Blob([fileArray], { type: 'application/vnd.openxmlformats-officedocument.spreadsheetml.sheet' });
    const url = URL.createObjectURL(blob);
    const a = document.createElement('a');
    a.href = url;
    a.download = outputFileName;
    a.click();
    URL.revokeObjectURL(url);
  };

  return (
    <div style={{ textAlign: 'center', height: '300px' }}>
      <h1>Add Arrow Lines</h1>
      <button onClick={addArrowLines}>Start</button>
    </div>
  );
}

export default App;
Seis linhas com setas: seta dupla, seta simples, seta em cotovelo, seta dupla em cotovelo, seta curva e seta dupla curva

Observe a reutilização das variáveis line3 e line2 na segunda metade da função. Cada chamada a TypedLines.AddLine() retorna um novo objeto de linha que já foi adicionado à planilha — a variável é um identificador para definir propriedades, não um contêiner que precisa ser preservado. Reutilizar o nome da variável para a próxima linha é seguro porque a linha anterior já está comprometida na coleção de formas da planilha.
Gerenciar linhas existentes
Uma planilha que já contém linhas — sejam adicionadas pelo seu código, importadas de um arquivo ou desenhadas por um usuário — as expõe por meio da coleção sheet.Shapes. Cada forma pode ser recuperada por índice e modificada por meio de suas propriedades:
// Get the first shape in the worksheet
let shape = sheet.Shapes.get(0);
// Modify its properties — color, dash style, etc.
shape.Color = xlsModule.Color.get_Red();
Para exclusão, sheet.Shapes.Remove(index) remove a forma no índice especificado. Para remover linhas seletivamente — por nome, por tipo ou por posição — itere a coleção e remova as formas correspondentes. Remova do último índice para baixo ao excluir em um loop, pois remover um elemento desloca os índices de todos os elementos após ele.
Problemas comuns
A ponta da seta não aparece.
BeginArrowHeadStyle ou EndArrowHeadStyle não foi definido, ou foi definido como LineNoArrow. Verifique em qual extremidade você espera a seta e atribua a propriedade correspondente. Uma linha sem nenhuma das duas propriedades definidas não tem setas em nenhuma extremidade.
A linha aparece na posição errada.
Top e Left estão em pixels, não em linhas e colunas. Um valor de Top = 10 coloca a linha a 10 pixels do topo da planilha, não na linha 10. Se você está acostumado com a API Lines.AddLine(), esta é a fonte mais comum de posicionamento incorreto.
O conector em cotovelo dobra na direção errada.
A direção da dobra depende dos sinais e das magnitudes relativas de Width e Height. Um Width positivo com um Height positivo dobra para baixo e para a direita. Inverta o sinal ou troque os dois valores para mudar a dobra. Teste com valores pequenos primeiro.
A linha curva não curva como eu esperava.
Uma CurveLine por meio de TypedLines desenha um arco suave entre os pontos inicial e final, e a forma do arco é influenciada por Width e Height. Ao contrário de um conector em cotovelo, que tem uma única dobra em ângulo reto, uma curva é contínua — mas seu caminho exato depende das dimensões, então verifique a saída antes de confiar nela para um layout preciso.
Perguntas frequentes
Qual é a diferença entre LineArrow e LineArrowOpen?
LineArrow desenha uma ponta de seta triangular preenchida. LineArrowOpen desenha uma ponta de seta aberta em forma de V — dois traços sem preenchimento. O estilo aberto é comum em diagramas de fluxo de dados e de entidade-relacionamento, em que a seta indica direção sem implicar um mecanismo específico.
Posso definir estilos de seta diferentes nas duas extremidades?
Sim. BeginArrowHeadStyle e EndArrowHeadStyle são propriedades independentes. Uma linha com LineArrow em uma extremidade e LineArrowOpen na outra é válida e comunica que uma direção é definida enquanto a outra é incerta.
Como as coordenadas em pixels se relacionam com o layout da planilha?
As coordenadas em pixels são medidas a partir do canto superior esquerdo da planilha. As alturas das linhas e as larguras das colunas no Excel são medidas em pontos e caracteres, respectivamente, portanto converter entre posições de células e coordenadas em pixels exige considerar as alturas de linha e larguras de coluna atuais. Para linhas que precisam se alinhar aos limites das células, Lines.AddLine() com parâmetros de linha e coluna pode ser mais simples.
Posso misturar Lines.AddLine() e TypedLines.AddLine() na mesma planilha?
Sim. As duas APIs adicionam formas à mesma coleção de formas da planilha. Uma planilha pode conter formas de linha básicas e linhas com setas simultaneamente.
Isso exige que o Excel esteja instalado?
Não. O mecanismo é executado como WebAssembly no navegador. As linhas e setas são gravadas como objetos de forma padrão no XML da planilha, e o Excel as renderiza nativamente quando o arquivo é aberto.
Veja também
JavaScript(React)에서 Excel에 화살표 연결선 추가하기
순서도에서 두 상자 사이의 선은 "이 둘은 관련이 있다"는 의미입니다. 한쪽에서 다른 쪽으로 향하는 화살표는 "이쪽이 먼저다"라는 의미입니다. 바로 이 구분 — 방향 — 이 연결선과 장식을 나누는 기준이며, 기본 Lines.AddLine() API가 양쪽 끝에서 할 수 없는 유일한 것입니다. 프로세스 흐름은 각 단계에서 나가는 화살표가 필요하고, 인과 관계도는 화살표가 안쪽을 향해야 하며, 비교할 때는 양방향 연결을 나타내기 위해 양쪽 화살표가 필요한 경우도 있습니다. 이러한 것들은 단일 EndArrowHeadStyle로는 불가능합니다.
Spire.XLS for JavaScript는 바로 이러한 경우를 위해 sheet.TypedLines.AddLine()을 제공합니다. 이 메서드는 행과 열 대신 픽셀 좌표로 선의 위치를 지정하며, BeginArrowHeadStyle과 EndArrowHeadStyle을 각각 독립적으로 받아들이므로 한쪽 끝에만, 양쪽 끝에, 또는 어느 쪽에도 화살표가 없는 선을 만들 수 있습니다. 이 엔진은 브라우저에서 WebAssembly로 실행되며, 파일은 가상 파일 시스템(VFS)을 통해 이동하고 백엔드는 관여하지 않습니다.
프로젝트 설정에 대해서는 React 프로젝트에 Spire.XLS for JavaScript 통합하기를 참조하세요. 아래 예제는 패키지가 설치되어 있고 WebAssembly 모듈이 초기화되었다고 가정합니다.
방향이 모든 것을 바꿉니다
세 가지 다이어그램, 세 가지 서로 다른 방향 요구 사항이 있으며, 동일한 라인 API가 이 모두를 처리합니다:
| 다이어그램 유형 | 화살표 구성 | 전달하는 의미 |
|---|---|---|
| 프로세스 흐름 | 끝에만 화살표 | 순차적 실행 — 단계 A가 단계 B로 이어짐 |
| 인과 사슬 | 끝에만 화살표, 여러 선이 연속으로 | 원인이 결과를 낳고, 그 결과가 다음 결과를 낳음 |
| 양방향 연결 | 양쪽 끝에 화살표 | 상호 관계 — A가 B에 영향을 주고 B도 A에 영향을 줌 |
| 주석 지시선 | 끝에는 화살표, 시작점에는 화살표 없음 | 레이블이 설명하는 셀을 가리킴 |
화살촉 스타일 자체도 의미를 담고 있습니다. 채워진 화살표(LineArrow)는 확실하고 확정된 연결로 읽힙니다. 열린 화살표(LineArrowOpen)는 더 느슨하고 덜 확실한 연결로 읽히며, 방향은 알지만 메커니즘은 명시되지 않은 데이터 흐름도에서 흔히 사용됩니다.
사전 요구 사항
Spire.XLS for JavaScript가 설치되고 WebAssembly 모듈이 초기화된 React 프로젝트가 필요하며, window.wasmModule.spirexls에서 접근할 수 있어야 합니다. 예제에서는 VFS에 글꼴을 로드하고 Excel 2010 버전 플래그로 저장합니다.
TypedLines와 Lines: 무엇이 다른가
sheet.Lines.AddLine()과 sheet.TypedLines.AddLine()은 서로 다른 필요를 위한 두 개의 별도 API입니다. 차이는 겉모습이 아니라 구조적인 것입니다:
Lines.AddLine() |
TypedLines.AddLine() |
|
|---|---|---|
| 위치 지정 | 행 및 열 좌표 | 픽셀 좌표(Top, Left) |
| 크기 | 생성자의 width 및 height |
속성으로서의 Width 및 Height |
| 끝의 화살표 | EndArrowHeadStyle |
EndArrowHeadStyle |
| 시작점의 화살표 | 지원되지 않음 | BeginArrowHeadStyle |
| 선 유형 | 생성자의 lineShapeType으로 설정 |
LineShapeType 속성으로 설정 |
| 적합한 용도 | 셀에 정렬된 단순 선 도형 | 정밀한 배치가 필요한 방향성 연결선 |
시작점 화살표 지원이 가장 중요한 차이입니다. Lines.AddLine()에서는 선의 끝에는 화살촉을 둘 수 있지만 시작점에는 둘 수 없으며, 이는 단방향 흐름에는 충분하지만 양방향 연결에는 충분하지 않습니다. TypedLines.AddLine()은 이러한 제약을 제거합니다.
화살표가 없는 기본 선 도형에 대해서는 JavaScript(React)에서 Excel에 선 도형 삽입하기에서 Lines.AddLine() API를 다룹니다.
픽셀 단위의 정밀한 위치 지정
TypedLines.AddLine()은 Top과 Left를 픽셀 단위로 사용하여 선을 배치하며, Width와 Height로 범위를 제어합니다:
let line = sheet.TypedLines.AddLine();
line.Top = 10;     // 10 pixels from the top of the sheet
line.Left = 20;    // 20 pixels from the left
line.Width = 100;  // 100 pixels wide
line.Height = 0;   // 0 height — a horizontal line
Height가 0이면 가로선이 되고, Width가 0이면 세로선이 됩니다. 둘 다 0이 아닌 값으로 설정하면 LineShapeType에 따라 대각선이나 꺾인 연결선이 만들어집니다.
행과 열에서 픽셀 좌표로의 전환은 선이 셀 경계에 맞춰지는 것이 아니라 셀 내부의 특정 지점 — 병합된 범위의 중앙, 테두리의 모서리 — 을 연결해야 할 때 가장 중요합니다. 픽셀 위치 지정을 사용하면 어느 행과 열이 가장 가까운지 추정하는 대신, 알고 있는 레이아웃에서 정확한 시작점과 끝점을 계산할 수 있습니다.
화살표 조합
BeginArrowHeadStyle과 EndArrowHeadStyle을 독립적으로 설정하면 네 가지 조합으로 일반적인 경우를 모두 포괄할 수 있습니다:
| 시작 | 끝 | 시각적 표시 | 의미 |
|---|---|---|---|
LineNoArrow |
LineArrow |
→ | 단방향: A가 B로 이어짐 |
LineArrow |
LineArrow |
↔ | 양방향: A와 B가 서로에게 영향을 줌 |
LineArrow |
LineNoArrow |
← | 역방향 단방향: B가 A로 이어짐(드물지만 오른쪽에서 왼쪽으로 가는 레이아웃에 유용) |
LineNoArrow |
LineNoArrow |
— | 방향 없음: 일반 연결선(간단하게 하려면 대신 Lines.AddLine() 사용) |
화살표 스타일은 양쪽 끝에서 채워진 삼각형이 아닌 열린 V자 모양인 LineArrowOpen일 수도 있습니다. 두 끝에 서로 다른 스타일을 섞는 것도 유효합니다. 한쪽 끝에 채워진 화살표를, 다른 쪽 끝에 열린 화살표를 두면 한 방향은 확정적이고 다른 방향은 잠정적임을 전달합니다.
화살표가 있는 선 삽입
이 예제는 일반적인 조합을 모두 포함하는 여섯 개의 화살표 선을 새 워크시트에 삽입합니다: 양방향 화살표 선, 단방향 화살표 선, 꺾인 화살표 연결선, 꺾인 양방향 화살표 연결선, 곡선 화살표 연결선, 곡선 양방향 화살표 연결선입니다. 단계는 다음과 같습니다:
Workbook개체를 만들고 첫 번째 워크시트를 가져옵니다.Worksheet.TypedLines.AddLine()을 호출하여 각 선을 만듭니다.Top,Left,Width,Height(픽셀 단위)를 통해 선 위치를 설정합니다.BeginArrowHeadStyle과EndArrowHeadStyle을 통해 양쪽 끝의 화살표 스타일을 설정합니다.LineShapeType(직선, 꺾인 선, 곡선 등)을 통해 선 유형을 지정합니다.Workbook.SaveToFile()로 통합 문서를 저장합니다.
function App() {
  const addArrowLines = async () => {
    // Get the Spire.XLS WASM module
    const xlsModule = window.wasmModule?.spirexls;

    // Check whether the module is ready
    if (!xlsModule) {
      alert('Spire.Xls is not ready yet');
      return;
    }

    // Load the font into the VFS for text measurement and column auto-fit
    await window.spire.FetchFileToVFS('ARIAL.TTF', '/Library/Fonts/', `${process.env.PUBLIC_URL}/font/`);

    // Create a new workbook and get the first worksheet
    const workbook = new xlsModule.Workbook();
    const sheet = workbook.Worksheets.get(0);

    // Add a double-arrow line - solid blue
    let line = sheet.TypedLines.AddLine();
    line.Top = 10;
    line.Left = 20;
    line.Width = 100;
    line.Height = 0;
    line.Color = xlsModule.Color.get_Blue();
    line.BeginArrowHeadStyle = xlsModule.ShapeArrowStyleType.LineArrow;
    line.EndArrowHeadStyle = xlsModule.ShapeArrowStyleType.LineArrow;

    // Add a single-arrow line - solid red
    let line_1 = sheet.TypedLines.AddLine();
    line_1.Top = 50;
    line_1.Left = 30;
    line_1.Width = 100;
    line_1.Height = 100;
    line_1.Color = xlsModule.Color.get_Red();
    line_1.BeginArrowHeadStyle = xlsModule.ShapeArrowStyleType.LineNoArrow;
    line_1.EndArrowHeadStyle = xlsModule.ShapeArrowStyleType.LineArrow;

    // Add an elbow arrow connector
    let line3 = sheet.TypedLines.AddLine();
    line3.LineShapeType = xlsModule.LineShapeType.ElbowLine;
    line3.Width = 30;
    line3.Height = 50;
    line3.EndArrowHeadStyle = xlsModule.ShapeArrowStyleType.LineArrow;
    line3.Top = 100;
    line3.Left = 50;

    // Add an elbow double-arrow connector
    let line2 = sheet.TypedLines.AddLine();
    line2.LineShapeType = xlsModule.LineShapeType.ElbowLine;
    line2.Width = 50;
    line2.Height = 50;
    line2.EndArrowHeadStyle = xlsModule.ShapeArrowStyleType.LineArrow;
    line2.BeginArrowHeadStyle = xlsModule.ShapeArrowStyleType.LineArrow;
    line2.Left = 120;
    line2.Top = 100;

    // Add a curved arrow connector
    line3 = sheet.TypedLines.AddLine();
    line3.LineShapeType = xlsModule.LineShapeType.CurveLine;
    line3.Width = 30;
    line3.Height = 50;
    line3.EndArrowHeadStyle = xlsModule.ShapeArrowStyleType.LineArrowOpen;
    line3.Top = 100;
    line3.Left = 200;

    // Add a curved double-arrow connector
    line2 = sheet.TypedLines.AddLine();
    line2.LineShapeType = xlsModule.LineShapeType.CurveLine;
    line2.Width = 30;
    line2.Height = 50;
    line2.EndArrowHeadStyle = xlsModule.ShapeArrowStyleType.LineArrowOpen;
    line2.BeginArrowHeadStyle = xlsModule.ShapeArrowStyleType.LineArrowOpen;
    line2.Left = 250;
    line2.Top = 100;

    // Save the workbook
    const outputFileName = 'AddArrowLines.xlsx';
    workbook.SaveToFile({ fileName: outputFileName, version: xlsModule.ExcelVersion.Version2010 });

    // Release resources
    workbook.Dispose();

    // Read the saved file from the VFS and trigger the download
    const fileArray = window.dotnetRuntime.Module.FS.readFile(outputFileName);
    const blob = new Blob([fileArray], { type: 'application/vnd.openxmlformats-officedocument.spreadsheetml.sheet' });
    const url = URL.createObjectURL(blob);
    const a = document.createElement('a');
    a.href = url;
    a.download = outputFileName;
    a.click();
    URL.revokeObjectURL(url);
  };

  return (
    <div style={{ textAlign: 'center', height: '300px' }}>
      <h1>Add Arrow Lines</h1>
      <button onClick={addArrowLines}>Start</button>
    </div>
  );
}

export default App;
여섯 개의 화살표 선: 양방향 화살표, 단방향 화살표, 꺾인 화살표, 꺾인 양방향 화살표, 곡선 화살표, 곡선 양방향 화살표
함수 후반부에서 line3와 line2 변수를 재사용한 점에 주목하세요. TypedLines.AddLine()을 호출할 때마다 이미 워크시트에 추가된 새로운 선 개체가 반환됩니다. 즉, 변수는 속성을 설정하기 위한 핸들일 뿐이며 보존해야 하는 컨테이너가 아닙니다. 이전 선은 이미 시트의 도형 컬렉션에 반영되어 있으므로 다음 선을 위해 변수 이름을 재사용해도 안전합니다.
기존 선 관리
여러분의 코드로 추가되었든, 파일에서 가져왔든, 사용자가 그렸든 이미 선이 포함된 워크시트는 sheet.Shapes 컬렉션을 통해 이를 노출합니다. 각 도형은 인덱스로 가져올 수 있고 속성을 통해 수정할 수 있습니다:
// Get the first shape in the worksheet
let shape = sheet.Shapes.get(0);
// Modify its properties — color, dash style, etc.
shape.Color = xlsModule.Color.get_Red();
삭제의 경우 sheet.Shapes.Remove(index)가 지정된 인덱스의 도형을 제거합니다. 이름, 유형 또는 위치별로 선을 선택적으로 제거하려면 컬렉션을 반복하면서 일치하는 도형을 제거하세요. 루프에서 삭제할 때는 마지막 인덱스부터 아래로 제거해야 합니다. 요소를 제거하면 그 뒤에 있는 모든 요소의 인덱스가 이동하기 때문입니다.
일반적인 문제
화살촉이 표시되지 않습니다.
BeginArrowHeadStyle 또는 EndArrowHeadStyle이 설정되지 않았거나 LineNoArrow로 설정되었습니다. 화살표가 있어야 할 끝이 어느 쪽인지 확인하고 해당 속성을 할당하세요. 두 속성 모두 설정되지 않은 선은 양쪽 끝에 화살표가 없습니다.
선이 잘못된 위치에 나타납니다.
Top과 Left는 행과 열이 아니라 픽셀 단위입니다. Top = 10이라는 값은 선을 10번째 행이 아니라 시트 위쪽에서 10픽셀 위치에 배치합니다. Lines.AddLine() API에 익숙하다면 이것이 가장 흔한 위치 오류의 원인입니다.
꺾인 연결선이 잘못된 방향으로 꺾입니다.
꺾이는 방향은 Width와 Height의 부호와 상대적 크기에 따라 달라집니다. 양수 Width와 양수 Height는 오른쪽 아래로 꺾입니다. 부호를 바꾸거나 두 값을 서로 바꾸어 꺾임을 변경하세요. 먼저 작은 값으로 테스트해 보세요.
곡선이 예상한 대로 휘어지지 않습니다.
TypedLines를 통한 CurveLine은 시작점과 끝점 사이에 부드러운 호를 그리며, 호의 모양은 Width와 Height의 영향을 받습니다. 직각으로 한 번 꺾이는 꺾인 연결선과 달리 곡선은 연속적이지만, 정확한 경로는 크기에 따라 달라지므로 정밀한 레이아웃에 의존하기 전에 결과를 확인하세요.
FAQ
LineArrow와 LineArrowOpen의 차이는 무엇인가요?
LineArrow는 채워진 삼각형 화살촉을 그립니다. LineArrowOpen은 채움 없이 두 개의 획으로 이루어진 열린 V자 화살촉을 그립니다. 열린 스타일은 화살표가 특정 메커니즘을 암시하지 않고 방향만 나타내는 데이터 흐름도와 개체-관계 다이어그램에서 흔히 사용됩니다.
양쪽 끝에 서로 다른 화살표 스타일을 설정할 수 있나요?
네. BeginArrowHeadStyle과 EndArrowHeadStyle은 독립적인 속성입니다. 한쪽 끝에 LineArrow를, 다른 쪽 끝에 LineArrowOpen을 사용한 선은 유효하며, 한 방향은 확정적이고 다른 방향은 잠정적임을 전달합니다.
픽셀 좌표는 워크시트 레이아웃과 어떻게 관련되나요?
픽셀 좌표는 워크시트의 왼쪽 위 모서리에서 측정됩니다. Excel의 행 높이는 포인트로, 열 너비는 문자 수로 측정되므로, 셀 위치와 픽셀 좌표 사이를 변환하려면 현재 행 높이와 열 너비를 고려해야 합니다. 셀 경계에 맞춰야 하는 선에는 행과 열 매개변수를 사용하는 Lines.AddLine()이 더 간단할 수 있습니다.
같은 워크시트에서 Lines.AddLine()과 TypedLines.AddLine()을 함께 사용할 수 있나요?
네. 두 API 모두 동일한 워크시트의 도형 컬렉션에 도형을 추가합니다. 하나의 워크시트에 기본 선 도형과 화살표가 있는 선을 동시에 포함할 수 있습니다.
Excel이 설치되어 있어야 하나요?
아니요. 이 엔진은 브라우저에서 WebAssembly로 실행됩니다. 선과 화살표는 워크시트 XML에 표준 도형 개체로 기록되며, 파일을 열면 Excel이 기본적으로 렌더링합니다.
관련 항목
Aggiungi connettori a freccia in Excel in JavaScript (React)
Una linea tra due caselle in un diagramma di flusso dice "queste sono correlate". Una freccia da una all'altra dice "questa viene prima". Questa distinzione — la direzione — è ciò che separa un connettore da una decorazione, ed è l'unica cosa che l'API di base Lines.AddLine() non può fare su entrambe le estremità. Un flusso di processo necessita di una freccia che esce da ogni passaggio; un diagramma causa-effetto necessita di frecce che puntano verso l'interno; un confronto a volte necessita di frecce a doppia punta per mostrare un collegamento bidirezionale. Nessuna di queste è possibile con un singolo EndArrowHeadStyle.
Spire.XLS for JavaScript fornisce sheet.TypedLines.AddLine() esattamente per questo caso. Posiziona le linee tramite coordinate in pixel invece che per riga e colonna, e accetta BeginArrowHeadStyle e EndArrowHeadStyle in modo indipendente — così una linea può avere una freccia su un'estremità, su entrambe o su nessuna. Il motore funziona nel browser su WebAssembly, con i file che passano attraverso un file system virtuale (VFS) e senza alcun backend coinvolto.
Per la configurazione del progetto, vedi Integrazione di Spire.XLS for JavaScript in un progetto React. Gli esempi seguenti presuppongono che il pacchetto sia installato e che il modulo WebAssembly sia stato inizializzato.
La direzione cambia tutto
Tre diagrammi, tre requisiti direzionali diversi, e la stessa API per le linee li gestisce tutti:
| Tipo di diagramma | Configurazione delle frecce | Cosa comunica |
|---|---|---|
| Flusso di processo | Freccia solo sull'estremità finale | Esecuzione sequenziale — il passaggio A porta al passaggio B |
| Catena causale | Freccia solo sull'estremità finale, più linee in sequenza | La causa produce l'effetto, che produce l'effetto successivo |
| Collegamento bidirezionale | Freccia su entrambe le estremità | Relazione reciproca — A influenza B e B influenza A |
| Indicatore di annotazione | Freccia sull'estremità finale, nessuna freccia sull'inizio | Un'etichetta punta alla cella che descrive |
Anche lo stile della punta di freccia ha un significato. Una freccia piena e riempita (LineArrow) viene letta come una connessione definita e consolidata. Una freccia aperta (LineArrowOpen) viene letta come una connessione più blanda e meno certa — comune nei diagrammi di flusso dei dati, dove la direzione è nota ma il meccanismo non è specificato.
Prerequisiti
È necessario un progetto React con Spire.XLS for JavaScript installato e il modulo WebAssembly inizializzato, accessibile all'indirizzo window.wasmModule.spirexls. L'esempio carica un font nel VFS e salva con il flag di versione Excel 2010.
TypedLines vs Lines: qual è la differenza
sheet.Lines.AddLine() e sheet.TypedLines.AddLine() sono due API separate per due esigenze separate. Le differenze sono strutturali, non estetiche:
Lines.AddLine() |
TypedLines.AddLine() |
|
|---|---|---|
| Posizionamento | Coordinate di riga e colonna | Coordinate in pixel (Top, Left) |
| Dimensioni | width e height nel costruttore |
Width e Height come proprietà |
| Freccia sull'estremità finale | EndArrowHeadStyle |
EndArrowHeadStyle |
| Freccia sull'inizio | Non supportato | BeginArrowHeadStyle |
| Tipo di linea | Impostato tramite lineShapeType nel costruttore |
Impostato tramite la proprietà LineShapeType |
| Ideale per | Forme di linea semplici allineate alle celle | Connettori direzionali con posizionamento preciso |
Il supporto della freccia iniziale è la differenza più rilevante. Con Lines.AddLine(), una linea può avere una punta di freccia alla sua estremità finale ma non all'inizio — il che è sufficiente per un flusso unidirezionale ma non per un collegamento bidirezionale. TypedLines.AddLine() elimina questo vincolo.
Per le forme di linea di base senza frecce, Inserire forme di linea in Excel in JavaScript (React) copre l'API Lines.AddLine().
Posizionamento preciso al pixel
TypedLines.AddLine() posiziona le linee usando Top e Left in pixel, con Width e Height che ne controllano l'estensione:
let line = sheet.TypedLines.AddLine();
line.Top = 10;     // 10 pixels from the top of the sheet
line.Left = 20;    // 20 pixels from the left
line.Width = 100;  // 100 pixels wide
line.Height = 0;   // 0 height — a horizontal line
Un Height di 0 produce una linea orizzontale; un Width di 0 ne produce una verticale. Impostando entrambi su valori diversi da zero si ottiene una diagonale o un connettore piegato, a seconda del LineShapeType.
Il passaggio da coordinate di riga e colonna a coordinate in pixel è più importante quando le linee devono collegare punti specifici all'interno delle celle — il centro di un intervallo unito, il bordo di una cornice — invece di allinearsi ai confini delle celle. Il posizionamento in pixel consente di calcolare l'inizio e la fine esatti dal layout che si conosce, invece di stimare quale riga e colonna si avvicini di più.
Combinazioni di frecce
Con BeginArrowHeadStyle e EndArrowHeadStyle impostati in modo indipendente, quattro combinazioni coprono i casi più comuni:
| Inizio | Fine | Aspetto | Significato |
|---|---|---|---|
LineNoArrow |
LineArrow |
→ | Direzione unidirezionale: A porta a B |
LineArrow |
LineArrow |
↔ | Bidirezionale: A e B si influenzano a vicenda |
LineArrow |
LineNoArrow |
← | Unidirezionale inversa: B porta ad A (raro, ma utile per layout da destra a sinistra) |
LineNoArrow |
LineNoArrow |
— | Nessuna direzione: un connettore semplice (usa Lines.AddLine() per semplicità) |
Lo stile della freccia può anche essere LineArrowOpen — una forma a V aperta invece di un triangolo pieno — su entrambe le estremità. Mescolare gli stili sulle due estremità è valido: una freccia piena su un'estremità e una freccia aperta sull'altra comunicano che una direzione è definita e l'altra è incerta.
Inserire linee con punta di freccia
L'esempio inserisce sei linee con punta di freccia in un foglio di lavoro nuovo, coprendo le combinazioni più comuni: una linea a doppia freccia, una linea a freccia singola, un connettore a gomito con freccia, un connettore a gomito a doppia freccia, un connettore curvo con freccia e un connettore curvo a doppia freccia. I passaggi sono:
- Creare un oggetto
Workbooke ottenere il primo foglio di lavoro. - Chiamare
Worksheet.TypedLines.AddLine()per creare ciascuna linea. - Impostare la posizione della linea tramite
Top,Left,WidtheHeight(in pixel). - Impostare gli stili delle frecce su entrambe le estremità tramite
BeginArrowHeadStyleeEndArrowHeadStyle. - Specificare il tipo di linea tramite
LineShapeType(dritta, a gomito, curva, ecc.). - Salvare il workbook con
Workbook.SaveToFile().
function App() {
  const addArrowLines = async () => {
    // Get the Spire.XLS WASM module
    const xlsModule = window.wasmModule?.spirexls;

    // Check whether the module is ready
    if (!xlsModule) {
      alert('Spire.Xls is not ready yet');
      return;
    }

    // Load the font into the VFS for text measurement and column auto-fit
    await window.spire.FetchFileToVFS('ARIAL.TTF', '/Library/Fonts/', `${process.env.PUBLIC_URL}/font/`);

    // Create a new workbook and get the first worksheet
    const workbook = new xlsModule.Workbook();
    const sheet = workbook.Worksheets.get(0);

    // Add a double-arrow line - solid blue
    let line = sheet.TypedLines.AddLine();
    line.Top = 10;
    line.Left = 20;
    line.Width = 100;
    line.Height = 0;
    line.Color = xlsModule.Color.get_Blue();
    line.BeginArrowHeadStyle = xlsModule.ShapeArrowStyleType.LineArrow;
    line.EndArrowHeadStyle = xlsModule.ShapeArrowStyleType.LineArrow;

    // Add a single-arrow line - solid red
    let line_1 = sheet.TypedLines.AddLine();
    line_1.Top = 50;
    line_1.Left = 30;
    line_1.Width = 100;
    line_1.Height = 100;
    line_1.Color = xlsModule.Color.get_Red();
    line_1.BeginArrowHeadStyle = xlsModule.ShapeArrowStyleType.LineNoArrow;
    line_1.EndArrowHeadStyle = xlsModule.ShapeArrowStyleType.LineArrow;

    // Add an elbow arrow connector
    let line3 = sheet.TypedLines.AddLine();
    line3.LineShapeType = xlsModule.LineShapeType.ElbowLine;
    line3.Width = 30;
    line3.Height = 50;
    line3.EndArrowHeadStyle = xlsModule.ShapeArrowStyleType.LineArrow;
    line3.Top = 100;
    line3.Left = 50;

    // Add an elbow double-arrow connector
    let line2 = sheet.TypedLines.AddLine();
    line2.LineShapeType = xlsModule.LineShapeType.ElbowLine;
    line2.Width = 50;
    line2.Height = 50;
    line2.EndArrowHeadStyle = xlsModule.ShapeArrowStyleType.LineArrow;
    line2.BeginArrowHeadStyle = xlsModule.ShapeArrowStyleType.LineArrow;
    line2.Left = 120;
    line2.Top = 100;

    // Add a curved arrow connector
    line3 = sheet.TypedLines.AddLine();
    line3.LineShapeType = xlsModule.LineShapeType.CurveLine;
    line3.Width = 30;
    line3.Height = 50;
    line3.EndArrowHeadStyle = xlsModule.ShapeArrowStyleType.LineArrowOpen;
    line3.Top = 100;
    line3.Left = 200;

    // Add a curved double-arrow connector
    line2 = sheet.TypedLines.AddLine();
    line2.LineShapeType = xlsModule.LineShapeType.CurveLine;
    line2.Width = 30;
    line2.Height = 50;
    line2.EndArrowHeadStyle = xlsModule.ShapeArrowStyleType.LineArrowOpen;
    line2.BeginArrowHeadStyle = xlsModule.ShapeArrowStyleType.LineArrowOpen;
    line2.Left = 250;
    line2.Top = 100;

    // Save the workbook
    const outputFileName = 'AddArrowLines.xlsx';
    workbook.SaveToFile({ fileName: outputFileName, version: xlsModule.ExcelVersion.Version2010 });

    // Release resources
    workbook.Dispose();

    // Read the saved file from the VFS and trigger the download
    const fileArray = window.dotnetRuntime.Module.FS.readFile(outputFileName);
    const blob = new Blob([fileArray], { type: 'application/vnd.openxmlformats-officedocument.spreadsheetml.sheet' });
    const url = URL.createObjectURL(blob);
    const a = document.createElement('a');
    a.href = url;
    a.download = outputFileName;
    a.click();
    URL.revokeObjectURL(url);
  };

  return (
    <div style={{ textAlign: 'center', height: '300px' }}>
      <h1>Add Arrow Lines</h1>
      <button onClick={addArrowLines}>Start</button>
    </div>
  );
}

export default App;
Sei linee con punta di freccia: doppia freccia, freccia singola, freccia a gomito, doppia freccia a gomito, freccia curva e doppia freccia curva
Si noti il riutilizzo delle variabili line3 e line2 nella seconda metà della funzione. Ogni chiamata a TypedLines.AddLine() restituisce un nuovo oggetto linea che è già stato aggiunto al foglio di lavoro — la variabile è un riferimento per impostare proprietà, non un contenitore che deve essere conservato. Riutilizzare il nome della variabile per la linea successiva è sicuro perché la linea precedente è già stata inserita nella raccolta di forme del foglio.
Gestire le linee esistenti
Un foglio di lavoro che contiene già delle linee — che siano state aggiunte dal tuo codice, importate da un file o disegnate da un utente — le espone tramite la raccolta sheet.Shapes. Ogni forma può essere recuperata tramite indice e modificata attraverso le sue proprietà:
// Get the first shape in the worksheet
let shape = sheet.Shapes.get(0);
// Modify its properties — color, dash style, etc.
shape.Color = xlsModule.Color.get_Red();
Per l'eliminazione, sheet.Shapes.Remove(index) rimuove la forma all'indice specificato. Per rimuovere le linee in modo selettivo — per nome, per tipo o per posizione — iterare la raccolta e rimuovere le forme corrispondenti. Quando si elimina in un ciclo, procedere dall'ultimo indice verso il basso, poiché la rimozione di un elemento sposta gli indici di tutti gli elementi successivi.
Problemi comuni
La punta della freccia non viene visualizzata.
BeginArrowHeadStyle o EndArrowHeadStyle non è stato impostato, oppure è stato impostato su LineNoArrow. Verifica su quale estremità ti aspetti la freccia e assegna la proprietà corrispondente. Una linea con nessuna delle due proprietà impostate non ha frecce su nessuna delle estremità.
La linea appare nella posizione sbagliata.
Top e Left sono in pixel, non in righe e colonne. Un valore di Top = 10 posiziona la linea a 10 pixel dalla parte superiore del foglio, non sulla riga 10. Se sei abituato all'API Lines.AddLine(), questa è la fonte più comune di posizionamento errato.
Il connettore a gomito si piega nella direzione sbagliata.
La direzione della piega dipende dai segni e dalle grandezze relative di Width e Height. Un Width positivo con un Height positivo piega verso il basso a destra. Inverti il segno o scambia i due valori per cambiare la piega. Prova prima con valori piccoli.
La linea curva non si curva come mi aspettavo.
Una CurveLine tramite TypedLines disegna un arco uniforme tra i punti di inizio e fine, e la forma dell'arco è influenzata da Width e Height. A differenza di un connettore a gomito, che ha una singola piega ad angolo retto, una curva è continua — ma il suo percorso esatto dipende dalle dimensioni, quindi verifica il risultato prima di affidarti a essa per un layout preciso.
FAQ
Qual è la differenza tra LineArrow e LineArrowOpen?
LineArrow disegna una punta di freccia triangolare piena. LineArrowOpen disegna una punta di freccia aperta a forma di V — due tratti senza riempimento. Lo stile aperto è comune nei diagrammi di flusso dei dati e nei diagrammi entità-relazione, dove la freccia indica la direzione senza implicare un meccanismo specifico.
Posso impostare stili di freccia diversi sulle due estremità?
Sì. BeginArrowHeadStyle e EndArrowHeadStyle sono proprietà indipendenti. Una linea con LineArrow su un'estremità e LineArrowOpen sull'altra è valida e comunica che una direzione è definita mentre l'altra è incerta.
Come si rapportano le coordinate in pixel al layout del foglio di lavoro?
Le coordinate in pixel sono misurate dall'angolo in alto a sinistra del foglio di lavoro. Le altezze di riga e le larghezze di colonna in Excel sono misurate rispettivamente in punti e caratteri, quindi la conversione tra posizioni di cella e coordinate in pixel richiede di tenere conto delle altezze di riga e delle larghezze di colonna correnti. Per le linee che devono allinearsi ai confini delle celle, Lines.AddLine() con parametri di riga e colonna può essere più semplice.
Posso mescolare Lines.AddLine() e TypedLines.AddLine() nello stesso foglio di lavoro?
Sì. Entrambe le API aggiungono forme alla stessa raccolta di forme del foglio di lavoro. Un foglio di lavoro può contenere contemporaneamente forme di linea di base e linee con punta di freccia.
È necessario avere Excel installato?
No. Il motore funziona come WebAssembly nel browser. Le linee e le frecce vengono scritte come oggetti forma standard nell'XML del foglio di lavoro, ed Excel le visualizza nativamente quando il file viene aperto.
Vedi anche
Ajouter des connecteurs fléchés dans Excel en JavaScript (React)
Table des matières
Une ligne entre deux boîtes dans un organigramme dit « ces éléments sont liés ». Une flèche de l'une vers l'autre dit « celui-ci vient en premier ». Cette distinction — la direction — est ce qui sépare un connecteur d'une décoration, et c'est précisément ce que l'API de base Lines.AddLine() ne peut pas faire aux deux extrémités. Un flux de processus a besoin d'une flèche partant de chaque étape ; un diagramme de cause à effet a besoin de flèches pointant vers l'intérieur ; une comparaison nécessite parfois des flèches à double sens pour montrer un lien bidirectionnel. Aucun de ces cas n'est possible avec un seul EndArrowHeadStyle.
Spire.XLS for JavaScript fournit sheet.TypedLines.AddLine() exactement pour ce cas. Il positionne les lignes par coordonnées en pixels plutôt que par ligne et colonne, et il accepte BeginArrowHeadStyle et EndArrowHeadStyle indépendamment — ainsi une ligne peut porter une flèche à une extrémité, aux deux extrémités, ou à aucune. Le moteur s'exécute dans le navigateur sur WebAssembly, avec des fichiers circulant via un système de fichiers virtuel (VFS) et sans backend impliqué.
Pour la configuration du projet, voir Intégrer Spire.XLS for JavaScript dans un projet React. Les exemples ci-dessous supposent que le package est installé et que le module WebAssembly a été initialisé.
La direction change tout
Trois diagrammes, trois exigences directionnelles différentes, et la même API de ligne gère les trois :
| Type de diagramme | Configuration des flèches | Ce qu'il communique |
|---|---|---|
| Flux de processus | Flèche uniquement à la fin | Exécution séquentielle — l'étape A mène à l'étape B |
| Chaîne causale | Flèche uniquement à la fin, plusieurs lignes en séquence | La cause produit un effet, qui produit l'effet suivant |
| Lien bidirectionnel | Flèche aux deux extrémités | Relation mutuelle — A affecte B et B affecte A |
| Pointeur d'annotation | Flèche à la fin, aucune flèche au début | Une étiquette pointe vers la cellule qu'elle décrit |
Le style de pointe de flèche lui-même porte aussi une signification. Une flèche pleine et remplie (LineArrow) se lit comme une connexion définitive et engagée. Une flèche ouverte (LineArrowOpen) se lit comme une connexion plus souple et moins certaine — courante dans les diagrammes de flux de données où la direction est connue mais le mécanisme n'est pas spécifié.
Prérequis
Vous avez besoin d'un projet React avec Spire.XLS for JavaScript installé et le module WebAssembly initialisé, accessible via window.wasmModule.spirexls. L'exemple charge une police dans le VFS et enregistre avec l'indicateur de version Excel 2010.
TypedLines vs Lines : quelle différence
sheet.Lines.AddLine() et sheet.TypedLines.AddLine() sont deux API distinctes pour deux besoins distincts. Les différences sont structurelles, non cosmétiques :
Lines.AddLine() |
TypedLines.AddLine() |
|
|---|---|---|
| Positionnement | Coordonnées en lignes et colonnes | Coordonnées en pixels (Top, Left) |
| Taille | width et height dans le constructeur |
Width et Height comme propriétés |
| Flèche à la fin | EndArrowHeadStyle |
EndArrowHeadStyle |
| Flèche au début | Non pris en charge | BeginArrowHeadStyle |
| Type de ligne | Défini via lineShapeType dans le constructeur |
Défini via la propriété LineShapeType |
| Idéal pour | Formes de lignes simples alignées sur les cellules | Connecteurs directionnels avec un placement précis |
La prise en charge de la flèche au début est la différence la plus importante. Avec Lines.AddLine(), une ligne peut avoir une pointe de flèche à sa fin mais pas à son début — ce qui suffit pour un flux unidirectionnel mais pas pour un lien bidirectionnel. TypedLines.AddLine() supprime cette contrainte.
Pour les formes de lignes de base sans flèches, Insérer des formes de lignes dans Excel en JavaScript (React) couvre l'API Lines.AddLine().
Positionnement au pixel près
TypedLines.AddLine() place les lignes à l'aide de Top et Left en pixels, avec Width et Height contrôlant l'étendue :
let line = sheet.TypedLines.AddLine();
line.Top = 10;     // 10 pixels from the top of the sheet
line.Left = 20;    // 20 pixels from the left
line.Width = 100;  // 100 pixels wide
line.Height = 0;   // 0 height — a horizontal line
Un Height de 0 produit une ligne horizontale ; un Width de 0 produit une ligne verticale. Définir les deux à des valeurs non nulles produit une diagonale ou un connecteur coudé, selon le LineShapeType.
Le passage des lignes et colonnes aux coordonnées en pixels importe surtout lorsque les lignes doivent relier des points précis à l'intérieur des cellules — le milieu d'une plage fusionnée, le bord d'une bordure — plutôt que de s'aligner sur les limites des cellules. Le positionnement en pixels vous permet de calculer le début et la fin exacts à partir de la disposition que vous connaissez, plutôt que d'estimer quelle ligne et quelle colonne s'en approche le plus.
Combinaisons de flèches
Avec BeginArrowHeadStyle et EndArrowHeadStyle définis indépendamment, quatre combinaisons couvrent les cas courants :
| Début | Fin | Visuel | Signification |
|---|---|---|---|
LineNoArrow |
LineArrow |
→ | Direction unique : A mène à B |
LineArrow |
LineArrow |
↔ | Bidirectionnel : A et B s'affectent mutuellement |
LineArrow |
LineNoArrow |
← | Sens unique inversé : B mène à A (rare, mais utile pour les dispositions de droite à gauche) |
LineNoArrow |
LineNoArrow |
— | Aucune direction : un connecteur simple (utilisez plutôt Lines.AddLine() pour plus de simplicité) |
Le style de flèche peut aussi être LineArrowOpen — une forme de V ouverte plutôt qu'un triangle rempli — à l'une ou l'autre extrémité. Mélanger les styles aux deux extrémités est valide : une flèche remplie à une extrémité et une flèche ouverte à l'autre indiquent qu'une direction est définitive et l'autre incertaine.
Insérer des lignes à pointe de flèche
L'exemple insère six lignes à pointe de flèche dans une nouvelle feuille de calcul, couvrant les combinaisons courantes : une ligne à double flèche, une ligne à flèche unique, un connecteur coudé à flèche, un connecteur coudé à double flèche, un connecteur courbe à flèche, et un connecteur courbe à double flèche. Les étapes sont :
- Créer un objet
Workbooket obtenir la première feuille de calcul. - Appeler
Worksheet.TypedLines.AddLine()pour créer chaque ligne. - Définir la position de la ligne via
Top,Left,WidthetHeight(en pixels). - Définir les styles de flèches aux deux extrémités via
BeginArrowHeadStyleetEndArrowHeadStyle. - Spécifier le type de ligne via
LineShapeType(droite, coudée, courbe, etc.). - Enregistrer le classeur avec
Workbook.SaveToFile().
function App() {
  const addArrowLines = async () => {
    // Get the Spire.XLS WASM module
    const xlsModule = window.wasmModule?.spirexls;

    // Check whether the module is ready
    if (!xlsModule) {
      alert('Spire.Xls is not ready yet');
      return;
    }

    // Load the font into the VFS for text measurement and column auto-fit
    await window.spire.FetchFileToVFS('ARIAL.TTF', '/Library/Fonts/', `${process.env.PUBLIC_URL}/font/`);

    // Create a new workbook and get the first worksheet
    const workbook = new xlsModule.Workbook();
    const sheet = workbook.Worksheets.get(0);

    // Add a double-arrow line - solid blue
    let line = sheet.TypedLines.AddLine();
    line.Top = 10;
    line.Left = 20;
    line.Width = 100;
    line.Height = 0;
    line.Color = xlsModule.Color.get_Blue();
    line.BeginArrowHeadStyle = xlsModule.ShapeArrowStyleType.LineArrow;
    line.EndArrowHeadStyle = xlsModule.ShapeArrowStyleType.LineArrow;

    // Add a single-arrow line - solid red
    let line_1 = sheet.TypedLines.AddLine();
    line_1.Top = 50;
    line_1.Left = 30;
    line_1.Width = 100;
    line_1.Height = 100;
    line_1.Color = xlsModule.Color.get_Red();
    line_1.BeginArrowHeadStyle = xlsModule.ShapeArrowStyleType.LineNoArrow;
    line_1.EndArrowHeadStyle = xlsModule.ShapeArrowStyleType.LineArrow;

    // Add an elbow arrow connector
    let line3 = sheet.TypedLines.AddLine();
    line3.LineShapeType = xlsModule.LineShapeType.ElbowLine;
    line3.Width = 30;
    line3.Height = 50;
    line3.EndArrowHeadStyle = xlsModule.ShapeArrowStyleType.LineArrow;
    line3.Top = 100;
    line3.Left = 50;

    // Add an elbow double-arrow connector
    let line2 = sheet.TypedLines.AddLine();
    line2.LineShapeType = xlsModule.LineShapeType.ElbowLine;
    line2.Width = 50;
    line2.Height = 50;
    line2.EndArrowHeadStyle = xlsModule.ShapeArrowStyleType.LineArrow;
    line2.BeginArrowHeadStyle = xlsModule.ShapeArrowStyleType.LineArrow;
    line2.Left = 120;
    line2.Top = 100;

    // Add a curved arrow connector
    line3 = sheet.TypedLines.AddLine();
    line3.LineShapeType = xlsModule.LineShapeType.CurveLine;
    line3.Width = 30;
    line3.Height = 50;
    line3.EndArrowHeadStyle = xlsModule.ShapeArrowStyleType.LineArrowOpen;
    line3.Top = 100;
    line3.Left = 200;

    // Add a curved double-arrow connector
    line2 = sheet.TypedLines.AddLine();
    line2.LineShapeType = xlsModule.LineShapeType.CurveLine;
    line2.Width = 30;
    line2.Height = 50;
    line2.EndArrowHeadStyle = xlsModule.ShapeArrowStyleType.LineArrowOpen;
    line2.BeginArrowHeadStyle = xlsModule.ShapeArrowStyleType.LineArrowOpen;
    line2.Left = 250;
    line2.Top = 100;

    // Save the workbook
    const outputFileName = 'AddArrowLines.xlsx';
    workbook.SaveToFile({ fileName: outputFileName, version: xlsModule.ExcelVersion.Version2010 });

    // Release resources
    workbook.Dispose();

    // Read the saved file from the VFS and trigger the download
    const fileArray = window.dotnetRuntime.Module.FS.readFile(outputFileName);
    const blob = new Blob([fileArray], { type: 'application/vnd.openxmlformats-officedocument.spreadsheetml.sheet' });
    const url = URL.createObjectURL(blob);
    const a = document.createElement('a');
    a.href = url;
    a.download = outputFileName;
    a.click();
    URL.revokeObjectURL(url);
  };

  return (
    <div style={{ textAlign: 'center', height: '300px' }}>
      <h1>Add Arrow Lines</h1>
      <button onClick={addArrowLines}>Start</button>
    </div>
  );
}

export default App;
Six lignes à pointe de flèche : double flèche, flèche unique, flèche coudée, double flèche coudée, flèche courbe et double flèche courbe
Notez la réutilisation des variables line3 et line2 dans la seconde moitié de la fonction. Chaque appel à TypedLines.AddLine() renvoie un nouvel objet ligne qui a déjà été ajouté à la feuille de calcul — la variable est un descripteur pour définir des propriétés, non un conteneur à conserver. Réutiliser le nom de variable pour la ligne suivante est sans risque car la ligne précédente est déjà engagée dans la collection de formes de la feuille.
Gérer les lignes existantes
Une feuille de calcul qui contient déjà des lignes — qu'elles aient été ajoutées par votre code, importées depuis un fichier ou dessinées par un utilisateur — les expose via la collection sheet.Shapes. Chaque forme peut être récupérée par index et modifiée via ses propriétés :
// Get the first shape in the worksheet
let shape = sheet.Shapes.get(0);
// Modify its properties — color, dash style, etc.
shape.Color = xlsModule.Color.get_Red();
Pour la suppression, sheet.Shapes.Remove(index) supprime la forme à l'index spécifié. Pour supprimer des lignes de manière sélective — par nom, par type ou par position — parcourez la collection et supprimez les formes correspondantes. Supprimez depuis le dernier index vers le premier lors d'une suppression en boucle, car la suppression d'un élément décale les index de tous les éléments suivants.
Problèmes courants
La pointe de flèche ne s'affiche pas.
BeginArrowHeadStyle ou EndArrowHeadStyle n'a pas été défini, ou a été défini sur LineNoArrow. Vérifiez à quelle extrémité vous attendez la flèche et attribuez la propriété correspondante. Une ligne dont aucune des deux propriétés n'est définie n'a aucune flèche à ses extrémités.
La ligne apparaît à la mauvaise position.
Top et Left sont en pixels, pas en lignes et colonnes. Une valeur de Top = 10 place la ligne à 10 pixels du haut de la feuille, pas sur la ligne 10. Si vous êtes habitué à l'API Lines.AddLine(), c'est la source la plus fréquente de mauvais placement.
Le connecteur coudé se plie dans la mauvaise direction.
La direction du coude dépend des signes et des magnitudes relatives de Width et Height. Un Width positif avec un Height positif plie vers le bas à droite. Inversez le signe ou échangez les deux valeurs pour changer le coude. Testez d'abord avec de petites valeurs.
La ligne courbe ne se courbe pas comme je l'attendais.
Une CurveLine via TypedLines dessine un arc lisse entre les points de début et de fin, et la forme de l'arc est influencée par Width et Height. Contrairement à un connecteur coudé, qui a un seul virage à angle droit, une courbe est continue — mais son tracé exact dépend des dimensions, alors vérifiez le rendu avant de vous y fier pour une disposition précise.
FAQ
Quelle est la différence entre LineArrow et LineArrowOpen ?
LineArrow dessine une pointe de flèche triangulaire remplie. LineArrowOpen dessine une pointe de flèche ouverte en forme de V — deux traits sans remplissage. Le style ouvert est courant dans les diagrammes de flux de données et d'entité-relation où la flèche indique la direction sans impliquer un mécanisme spécifique.
Puis-je définir différents styles de flèches aux deux extrémités ?
Oui. BeginArrowHeadStyle et EndArrowHeadStyle sont des propriétés indépendantes. Une ligne avec LineArrow à une extrémité et LineArrowOpen à l'autre est valide et indique qu'une direction est définitive tandis que l'autre est incertaine.
Quel est le rapport entre les coordonnées en pixels et la disposition de la feuille de calcul ?
Les coordonnées en pixels sont mesurées à partir du coin supérieur gauche de la feuille de calcul. Les hauteurs de lignes et les largeurs de colonnes dans Excel sont mesurées respectivement en points et en caractères, donc convertir entre positions de cellules et coordonnées en pixels nécessite de tenir compte des hauteurs de lignes et largeurs de colonnes actuelles. Pour les lignes qui doivent s'aligner sur les limites des cellules, Lines.AddLine() avec des paramètres de lignes et colonnes peut être plus simple.
Puis-je mélanger Lines.AddLine() et TypedLines.AddLine() dans la même feuille de calcul ?
Oui. Les deux API ajoutent des formes à la collection de formes de la même feuille de calcul. Une feuille de calcul peut contenir simultanément des formes de lignes de base et des lignes à pointe de flèche.
Cela nécessite-t-il qu'Excel soit installé ?
Non. Le moteur s'exécute en WebAssembly dans le navigateur. Les lignes et les flèches sont écrites comme objets de forme standard dans le XML de la feuille de calcul, et Excel les rend nativement lorsque le fichier est ouvert.
Voir aussi
Agregar conectores de flecha en Excel en JavaScript (React)
Tabla de contenidos
Una línea entre dos cuadros en un diagrama de flujo dice "estos están relacionados". Una flecha de uno hacia el otro dice "este va primero". Esa distinción — la dirección — es lo que separa un conector de una decoración, y es lo único que la API básica Lines.AddLine() no puede hacer en ambos extremos. Un flujo de proceso necesita una flecha que salga de cada paso; un diagrama de causa y efecto necesita flechas que apunten hacia dentro; una comparación a veces necesita flechas de doble punta para mostrar un vínculo bidireccional. Nada de esto es posible con un único EndArrowHeadStyle.
Spire.XLS for JavaScript proporciona sheet.TypedLines.AddLine() precisamente para este caso. Posiciona las líneas mediante coordenadas en píxeles en lugar de filas y columnas, y acepta BeginArrowHeadStyle y EndArrowHeadStyle de forma independiente, de modo que una línea puede llevar una flecha en un extremo, en ambos extremos o en ninguno. El motor se ejecuta en el navegador sobre WebAssembly, con los archivos moviéndose a través de un sistema de archivos virtual (VFS) y sin ningún backend implicado.
Para la configuración del proyecto, consulte Integrating Spire.XLS for JavaScript in a React Project. Los ejemplos a continuación asumen que el paquete está instalado y que el módulo WebAssembly se ha inicializado.
La dirección lo cambia todo
Tres diagramas, tres requisitos direccionales diferentes, y la misma API de líneas los gestiona todos:
| Tipo de diagrama | Configuración de flechas | Qué comunica |
|---|---|---|
| Flujo de proceso | Flecha solo en el final | Ejecución secuencial: el paso A lleva al paso B |
| Cadena causal | Flecha solo en el final, varias líneas en secuencia | La causa produce un efecto, que produce el siguiente efecto |
| Vínculo bidireccional | Flecha en ambos extremos | Relación mutua: A afecta a B y B afecta a A |
| Puntero de anotación | Flecha en el final, sin flecha en el inicio | Una etiqueta apunta a la celda que describe |
El propio estilo de la punta de flecha también transmite significado. Una flecha rellena sólida (LineArrow) se interpreta como una conexión definida y comprometida. Una flecha abierta (LineArrowOpen) se interpreta como una más flexible y menos segura, común en diagramas de flujo de datos donde la dirección se conoce pero el mecanismo no está especificado.
Requisitos previos
Necesita un proyecto de React con Spire.XLS for JavaScript instalado y el módulo WebAssembly inicializado, accesible en window.wasmModule.spirexls. El ejemplo carga una fuente en el VFS y guarda con la marca de versión de Excel 2010.
TypedLines vs Lines: en qué se diferencian
sheet.Lines.AddLine() y sheet.TypedLines.AddLine() son dos API separadas para dos necesidades distintas. Las diferencias son estructurales, no cosméticas:
Lines.AddLine() |
TypedLines.AddLine() |
|
|---|---|---|
| Posicionamiento | Coordenadas de fila y columna | Coordenadas en píxeles (Top, Left) |
| Tamaño | width y height en el constructor |
Width y Height como propiedades |
| Flecha en el final | EndArrowHeadStyle |
EndArrowHeadStyle |
| Flecha en el inicio | No compatible | BeginArrowHeadStyle |
| Tipo de línea | Se establece mediante lineShapeType en el constructor |
Se establece mediante la propiedad LineShapeType |
| Ideal para | Formas de línea simples alineadas con celdas | Conectores direccionales con colocación precisa |
La compatibilidad con flechas en el inicio es la diferencia más trascendental. Con Lines.AddLine(), una línea puede tener una punta de flecha en su final pero no en su inicio, lo cual es suficiente para un flujo unidireccional pero no para un vínculo bidireccional. TypedLines.AddLine() elimina esa restricción.
Para formas de línea básicas sin flechas, Insert Line Shapes in Excel in JavaScript (React) cubre la API Lines.AddLine().
Posicionamiento preciso al píxel
TypedLines.AddLine() coloca las líneas usando Top y Left en píxeles, con Width y Height controlando la extensión:
let line = sheet.TypedLines.AddLine();
line.Top = 10;     // 10 píxeles desde la parte superior de la hoja
line.Left = 20;    // 20 píxeles desde la izquierda
line.Width = 100;  // 100 píxeles de ancho
line.Height = 0;   // altura 0 — una línea horizontal
Un Height de 0 produce una línea horizontal; un Width de 0 produce una vertical. Establecer ambos en valores distintos de cero produce una diagonal o un conector acodado, según el LineShapeType.
El cambio de coordenadas de fila y columna a píxeles importa sobre todo cuando las líneas necesitan conectar puntos específicos dentro de las celdas — el centro de un rango combinado, el borde de un borde de celda — en lugar de alinearse con los límites de las celdas. El posicionamiento en píxeles le permite calcular el inicio y el final exactos a partir del diseño que conoce, en lugar de estimar qué fila y columna queda más cerca.
Combinaciones de flechas
Con BeginArrowHeadStyle y EndArrowHeadStyle establecidos de forma independiente, cuatro combinaciones cubren los casos comunes:
| Inicio | Final | Visual | Significado |
|---|---|---|---|
LineNoArrow |
LineArrow |
→ | Dirección unidireccional: A lleva a B |
LineArrow |
LineArrow |
↔ | Bidireccional: A y B se afectan mutuamente |
LineArrow |
LineNoArrow |
← | Unidireccional inversa: B lleva a A (poco común, pero útil para diseños de derecha a izquierda) |
LineNoArrow |
LineNoArrow |
— | Sin dirección: un conector simple (use Lines.AddLine() en su lugar por simplicidad) |
El estilo de flecha también puede ser LineArrowOpen — una forma de V abierta en lugar de un triángulo relleno — en cualquiera de los extremos. Mezclar estilos en los dos extremos es válido: una flecha rellena en un extremo y una flecha abierta en el otro comunica que una dirección es definida y la otra es tentativa.
Insertar líneas con punta de flecha
El ejemplo inserta seis líneas con punta de flecha en una hoja de cálculo nueva, cubriendo las combinaciones comunes: una línea de doble flecha, una línea de flecha simple, un conector de flecha acodado, un conector acodado de doble flecha, un conector de flecha curvo y un conector curvo de doble flecha. Los pasos son:
- Crear un objeto
Workbooky obtener la primera hoja de cálculo. - Llamar a
Worksheet.TypedLines.AddLine()para crear cada línea. - Establecer la posición de la línea mediante
Top,Left,WidthyHeight(en píxeles). - Establecer los estilos de flecha en ambos extremos mediante
BeginArrowHeadStyleyEndArrowHeadStyle. - Especificar el tipo de línea mediante
LineShapeType(recta, acodada, curva, etc.). - Guardar el libro con
Workbook.SaveToFile().
function App() {
  const addArrowLines = async () => {
    // Get the Spire.XLS WASM module
    const xlsModule = window.wasmModule?.spirexls;

    // Check whether the module is ready
    if (!xlsModule) {
      alert('Spire.Xls is not ready yet');
      return;
    }

    // Load the font into the VFS for text measurement and column auto-fit
    await window.spire.FetchFileToVFS('ARIAL.TTF', '/Library/Fonts/', `${process.env.PUBLIC_URL}/font/`);

    // Create a new workbook and get the first worksheet
    const workbook = new xlsModule.Workbook();
    const sheet = workbook.Worksheets.get(0);

    // Add a double-arrow line - solid blue
    let line = sheet.TypedLines.AddLine();
    line.Top = 10;
    line.Left = 20;
    line.Width = 100;
    line.Height = 0;
    line.Color = xlsModule.Color.get_Blue();
    line.BeginArrowHeadStyle = xlsModule.ShapeArrowStyleType.LineArrow;
    line.EndArrowHeadStyle = xlsModule.ShapeArrowStyleType.LineArrow;

    // Add a single-arrow line - solid red
    let line_1 = sheet.TypedLines.AddLine();
    line_1.Top = 50;
    line_1.Left = 30;
    line_1.Width = 100;
    line_1.Height = 100;
    line_1.Color = xlsModule.Color.get_Red();
    line_1.BeginArrowHeadStyle = xlsModule.ShapeArrowStyleType.LineNoArrow;
    line_1.EndArrowHeadStyle = xlsModule.ShapeArrowStyleType.LineArrow;

    // Add an elbow arrow connector
    let line3 = sheet.TypedLines.AddLine();
    line3.LineShapeType = xlsModule.LineShapeType.ElbowLine;
    line3.Width = 30;
    line3.Height = 50;
    line3.EndArrowHeadStyle = xlsModule.ShapeArrowStyleType.LineArrow;
    line3.Top = 100;
    line3.Left = 50;

    // Add an elbow double-arrow connector
    let line2 = sheet.TypedLines.AddLine();
    line2.LineShapeType = xlsModule.LineShapeType.ElbowLine;
    line2.Width = 50;
    line2.Height = 50;
    line2.EndArrowHeadStyle = xlsModule.ShapeArrowStyleType.LineArrow;
    line2.BeginArrowHeadStyle = xlsModule.ShapeArrowStyleType.LineArrow;
    line2.Left = 120;
    line2.Top = 100;

    // Add a curved arrow connector
    line3 = sheet.TypedLines.AddLine();
    line3.LineShapeType = xlsModule.LineShapeType.CurveLine;
    line3.Width = 30;
    line3.Height = 50;
    line3.EndArrowHeadStyle = xlsModule.ShapeArrowStyleType.LineArrowOpen;
    line3.Top = 100;
    line3.Left = 200;

    // Add a curved double-arrow connector
    line2 = sheet.TypedLines.AddLine();
    line2.LineShapeType = xlsModule.LineShapeType.CurveLine;
    line2.Width = 30;
    line2.Height = 50;
    line2.EndArrowHeadStyle = xlsModule.ShapeArrowStyleType.LineArrowOpen;
    line2.BeginArrowHeadStyle = xlsModule.ShapeArrowStyleType.LineArrowOpen;
    line2.Left = 250;
    line2.Top = 100;

    // Save the workbook
    const outputFileName = 'AddArrowLines.xlsx';
    workbook.SaveToFile({ fileName: outputFileName, version: xlsModule.ExcelVersion.Version2010 });

    // Release resources
    workbook.Dispose();

    // Read the saved file from the VFS and trigger the download
    const fileArray = window.dotnetRuntime.Module.FS.readFile(outputFileName);
    const blob = new Blob([fileArray], { type: 'application/vnd.openxmlformats-officedocument.spreadsheetml.sheet' });
    const url = URL.createObjectURL(blob);
    const a = document.createElement('a');
    a.href = url;
    a.download = outputFileName;
    a.click();
    URL.revokeObjectURL(url);
  };

  return (
    <div style={{ textAlign: 'center', height: '300px' }}>
      <h1>Add Arrow Lines</h1>
      <button onClick={addArrowLines}>Start</button>
    </div>
  );
}

export default App;
Seis líneas con punta de flecha: doble flecha, flecha simple, flecha acodada, doble flecha acodada, flecha curva y doble flecha curva
Observe la reutilización de las variables line3 y line2 en la segunda mitad de la función. Cada llamada a TypedLines.AddLine() devuelve un nuevo objeto de línea que ya se ha añadido a la hoja de cálculo: la variable es un identificador para establecer propiedades, no un contenedor que deba conservarse. Reutilizar el nombre de la variable para la siguiente línea es seguro porque la línea anterior ya está confirmada en la colección de formas de la hoja.
Gestionar líneas existentes
Una hoja de cálculo que ya contiene líneas — ya sea añadidas por su código, importadas desde un archivo o dibujadas por un usuario — las expone a través de la colección sheet.Shapes. Cada forma se puede recuperar por índice y modificar a través de sus propiedades:
// Get the first shape in the worksheet
let shape = sheet.Shapes.get(0);
// Modify its properties — color, dash style, etc.
shape.Color = xlsModule.Color.get_Red();
Para la eliminación, sheet.Shapes.Remove(index) elimina la forma en el índice especificado. Para eliminar líneas de forma selectiva — por nombre, por tipo o por posición — recorra la colección y elimine las formas que coincidan. Elimine desde el último índice hacia abajo cuando elimine en un bucle, ya que al eliminar un elemento se desplazan los índices de todos los elementos posteriores.
Problemas comunes
La punta de flecha no aparece.
No se estableció BeginArrowHeadStyle o EndArrowHeadStyle, o se estableció en LineNoArrow. Compruebe en qué extremo espera la flecha y asigne la propiedad correspondiente. Una línea sin ninguna de las dos propiedades establecidas no tiene flechas en ninguno de los extremos.
La línea aparece en la posición equivocada.
Top y Left están en píxeles, no en filas y columnas. Un valor de Top = 10 coloca la línea a 10 píxeles de la parte superior de la hoja, no en la fila 10. Si está acostumbrado a la API Lines.AddLine(), esta es la causa más común de mala colocación.
El conector acodado se dobla en la dirección equivocada.
La dirección del doblez depende de los signos y las magnitudes relativas de Width y Height. Un Width positivo con un Height positivo se dobla hacia abajo a la derecha. Cambie el signo o intercambie los dos valores para cambiar el doblez. Pruebe primero con valores pequeños.
La línea curva no se curva como esperaba.
Una CurveLine a través de TypedLines dibuja un arco suave entre los puntos de inicio y fin, y la forma del arco se ve influida por Width y Height. A diferencia de un conector acodado, que tiene un único doblez en ángulo recto, una curva es continua, pero su trayectoria exacta depende de las dimensiones, así que verifique el resultado antes de confiar en ella para un diseño preciso.
Preguntas frecuentes
¿Cuál es la diferencia entre LineArrow y LineArrowOpen?
LineArrow dibuja una punta de flecha triangular rellena. LineArrowOpen dibuja una punta de flecha abierta en forma de V: dos trazos sin relleno. El estilo abierto es común en diagramas de flujo de datos y de entidad-relación, donde la flecha indica la dirección sin implicar un mecanismo específico.
¿Puedo establecer estilos de flecha diferentes en los dos extremos?
Sí. BeginArrowHeadStyle y EndArrowHeadStyle son propiedades independientes. Una línea con LineArrow en un extremo y LineArrowOpen en el otro es válida y comunica que una dirección es definida mientras que la otra es tentativa.
¿Cómo se relacionan las coordenadas en píxeles con el diseño de la hoja de cálculo?
Las coordenadas en píxeles se miden desde la esquina superior izquierda de la hoja de cálculo. Las alturas de fila y los anchos de columna en Excel se miden en puntos y caracteres respectivamente, por lo que convertir entre posiciones de celdas y coordenadas en píxeles requiere tener en cuenta las alturas de fila y los anchos de columna actuales. Para líneas que necesitan alinearse con los límites de las celdas, Lines.AddLine() con parámetros de fila y columna puede ser más sencillo.
¿Puedo mezclar Lines.AddLine() y TypedLines.AddLine() en la misma hoja de cálculo?
Sí. Ambas API añaden formas a la misma colección de formas de la hoja de cálculo. Una hoja de cálculo puede contener formas de línea básicas y líneas con punta de flecha simultáneamente.
¿Esto requiere que Excel esté instalado?
No. El motor se ejecuta como WebAssembly en el navegador. Las líneas y flechas se escriben como objetos de forma estándar en el XML de la hoja de cálculo, y Excel las representa de forma nativa cuando se abre el archivo.
Véase también
Pfeilverbindungen in Excel mit JavaScript (React) hinzufügen
Inhaltsverzeichnis
Eine Linie zwischen zwei Kästen in einem Flussdiagramm besagt „diese stehen in Beziehung zueinander“. Ein Pfeil von einem zum anderen besagt „dieser kommt zuerst“. Diese Unterscheidung – die Richtung – ist es, was eine Verbindungslinie von einer Dekoration trennt, und sie ist genau das, was die grundlegende Lines.AddLine()-API an beiden Enden nicht leisten kann. Ein Prozessablauf benötigt einen Pfeil, der jeden Schritt verlässt; ein Ursache-Wirkungs-Diagramm benötigt Pfeile, die darauf zeigen; ein Vergleich benötigt manchmal Doppelpfeile, um eine bidirektionale Verbindung darzustellen. Nichts davon ist mit einem einzigen EndArrowHeadStyle möglich.
Spire.XLS for JavaScript bietet sheet.TypedLines.AddLine() genau für diesen Fall. Es positioniert Linien anhand von Pixelkoordinaten statt anhand von Zeilen und Spalten und akzeptiert BeginArrowHeadStyle und EndArrowHeadStyle unabhängig voneinander – so kann eine Linie an einem Ende, an beiden Enden oder an keinem Ende einen Pfeil tragen. Die Engine läuft im Browser auf WebAssembly, wobei Dateien über ein virtuelles Dateisystem (VFS) verarbeitet werden und kein Backend beteiligt ist.
Zur Projekteinrichtung siehe Integrieren von Spire.XLS for JavaScript in ein React-Projekt. Die folgenden Beispiele setzen voraus, dass das Paket installiert und das WebAssembly-Modul initialisiert wurde.
Die Richtung verändert alles
Drei Diagramme, drei unterschiedliche Richtungsanforderungen, und dieselbe Linien-API bewältigt sie alle:
| Diagrammtyp | Pfeilkonfiguration | Was er vermittelt |
|---|---|---|
| Prozessablauf | Pfeil nur am Ende | Sequenzielle Ausführung — Schritt A führt zu Schritt B |
| Kausalkette | Pfeil nur am Ende, mehrere Linien in Folge | Eine Ursache bewirkt eine Wirkung, die wiederum die nächste Wirkung bewirkt |
| Bidirektionale Verbindung | Pfeil an beiden Enden | Wechselseitige Beziehung — A beeinflusst B und B beeinflusst A |
| Beschriftungszeiger | Pfeil am Ende, kein Pfeil am Anfang | Eine Beschriftung zeigt auf die Zelle, die sie beschreibt |
Auch der Pfeilspitzenstil selbst trägt Bedeutung. Ein ausgefüllter massiver Pfeil (LineArrow) wird als definitive, verbindliche Verbindung gelesen. Ein offener Pfeil (LineArrowOpen) wird als lockerere, weniger sichere Verbindung gelesen – üblich in Datenflussdiagrammen, in denen die Richtung bekannt, der Mechanismus aber nicht spezifiziert ist.
Voraussetzungen
Sie benötigen ein React-Projekt mit installiertem Spire.XLS for JavaScript und initialisiertem WebAssembly-Modul, erreichbar unter window.wasmModule.spirexls. Das Beispiel lädt eine Schriftart in das VFS und speichert mit dem Versionsflag für Excel 2010.
TypedLines vs. Lines: Was ist der Unterschied
sheet.Lines.AddLine() und sheet.TypedLines.AddLine() sind zwei getrennte APIs für zwei getrennte Anforderungen. Die Unterschiede sind struktureller, nicht kosmetischer Natur:
Lines.AddLine() |
TypedLines.AddLine() |
|
|---|---|---|
| Positionierung | Zeilen- und Spaltenkoordinaten | Pixelkoordinaten (Top, Left) |
| Größe | width und height im Konstruktor |
Width und Height als Eigenschaften |
| Pfeil am Ende | EndArrowHeadStyle |
EndArrowHeadStyle |
| Pfeil am Anfang | Nicht unterstützt | BeginArrowHeadStyle |
| Linientyp | Über lineShapeType im Konstruktor festgelegt |
Über die Eigenschaft LineShapeType festgelegt |
| Am besten geeignet für | Einfache Linienformen, die an Zellen ausgerichtet sind | Gerichtete Verbindungslinien mit präziser Platzierung |
Die Unterstützung von Pfeilen am Anfang ist der folgenreichste Unterschied. Bei Lines.AddLine() kann eine Linie eine Pfeilspitze an ihrem Ende, aber nicht an ihrem Anfang haben – das reicht für einen einseitigen Fluss, aber nicht für eine bidirektionale Verbindung. TypedLines.AddLine() beseitigt diese Einschränkung.
Für grundlegende Linienformen ohne Pfeile behandelt Linienformen in Excel in JavaScript (React) einfügen die Lines.AddLine()-API.
Pixelgenaue Positionierung
TypedLines.AddLine() platziert Linien anhand von Top und Left in Pixeln, wobei Width und Height die Ausdehnung steuern:
let line = sheet.TypedLines.AddLine();
line.Top = 10;     // 10 pixels from the top of the sheet
line.Left = 20;    // 20 pixels from the left
line.Width = 100;  // 100 pixels wide
line.Height = 0;   // 0 height — a horizontal line
Ein Height von 0 erzeugt eine horizontale Linie; ein Width von 0 erzeugt eine vertikale. Werden beide auf Werte ungleich null gesetzt, entsteht eine diagonale oder eine geknickte Verbindungslinie, je nach LineShapeType.
Der Wechsel von Zeilen-und-Spalten- zu Pixelkoordinaten ist vor allem dann wichtig, wenn Linien bestimmte Punkte innerhalb von Zellen verbinden müssen – die Mitte eines verbundenen Bereichs, den Rand einer Umrandung –, anstatt sich an Zellgrenzen auszurichten. Die Pixelpositionierung ermöglicht es Ihnen, den exakten Anfang und das exakte Ende aus dem Ihnen bekannten Layout zu berechnen, anstatt zu schätzen, welche Zeile und Spalte am nächsten kommt.
Pfeilkombinationen
Da BeginArrowHeadStyle und EndArrowHeadStyle unabhängig voneinander festgelegt werden, decken vier Kombinationen die gängigen Fälle ab:
| Anfang | Ende | Visuell | Bedeutung |
|---|---|---|---|
LineNoArrow |
LineArrow |
→ | Einseitige Richtung: A führt zu B |
LineArrow |
LineArrow |
↔ | Bidirektional: A und B beeinflussen sich gegenseitig |
LineArrow |
LineNoArrow |
← | Umgekehrte Einzelrichtung: B führt zu A (selten, aber nützlich für Rechts-nach-links-Layouts) |
LineNoArrow |
LineNoArrow |
— | Keine Richtung: eine einfache Verbindungslinie (verwenden Sie der Einfachheit halber stattdessen Lines.AddLine()) |
Der Pfeilstil kann an beiden Enden auch LineArrowOpen sein – eine offene V-Form statt eines ausgefüllten Dreiecks. Das Mischen von Stilen an den beiden Enden ist zulässig: ein ausgefüllter Pfeil an einem Ende und ein offener Pfeil am anderen vermittelt, dass eine Richtung definitiv und die andere vorläufig ist.
Linien mit Pfeilspitzen einfügen
Das Beispiel fügt sechs Linien mit Pfeilspitzen in ein neues Arbeitsblatt ein und deckt die gängigen Kombinationen ab: eine Doppelpfeillinie, eine Einzelpfeillinie, eine geknickte Pfeilverbindung, eine geknickte Doppelpfeilverbindung, eine geschwungene Pfeilverbindung und eine geschwungene Doppelpfeilverbindung. Die Schritte sind:
- Erstellen Sie ein
Workbook-Objekt und rufen Sie das erste Arbeitsblatt ab. - Rufen Sie
Worksheet.TypedLines.AddLine()auf, um jede Linie zu erstellen. - Legen Sie die Linienposition über
Top,Left,WidthundHeightfest (in Pixeln). - Legen Sie die Pfeilstile an beiden Enden über
BeginArrowHeadStyleundEndArrowHeadStylefest. - Geben Sie den Linientyp über
LineShapeTypean (gerade, geknickt, geschwungen usw.). - Speichern Sie die Arbeitsmappe mit
Workbook.SaveToFile().
function App() {
  const addArrowLines = async () => {
    // Get the Spire.XLS WASM module
    const xlsModule = window.wasmModule?.spirexls;

    // Check whether the module is ready
    if (!xlsModule) {
      alert('Spire.Xls is not ready yet');
      return;
    }

    // Load the font into the VFS for text measurement and column auto-fit
    await window.spire.FetchFileToVFS('ARIAL.TTF', '/Library/Fonts/', `${process.env.PUBLIC_URL}/font/`);

    // Create a new workbook and get the first worksheet
    const workbook = new xlsModule.Workbook();
    const sheet = workbook.Worksheets.get(0);

    // Add a double-arrow line - solid blue
    let line = sheet.TypedLines.AddLine();
    line.Top = 10;
    line.Left = 20;
    line.Width = 100;
    line.Height = 0;
    line.Color = xlsModule.Color.get_Blue();
    line.BeginArrowHeadStyle = xlsModule.ShapeArrowStyleType.LineArrow;
    line.EndArrowHeadStyle = xlsModule.ShapeArrowStyleType.LineArrow;

    // Add a single-arrow line - solid red
    let line_1 = sheet.TypedLines.AddLine();
    line_1.Top = 50;
    line_1.Left = 30;
    line_1.Width = 100;
    line_1.Height = 100;
    line_1.Color = xlsModule.Color.get_Red();
    line_1.BeginArrowHeadStyle = xlsModule.ShapeArrowStyleType.LineNoArrow;
    line_1.EndArrowHeadStyle = xlsModule.ShapeArrowStyleType.LineArrow;

    // Add an elbow arrow connector
    let line3 = sheet.TypedLines.AddLine();
    line3.LineShapeType = xlsModule.LineShapeType.ElbowLine;
    line3.Width = 30;
    line3.Height = 50;
    line3.EndArrowHeadStyle = xlsModule.ShapeArrowStyleType.LineArrow;
    line3.Top = 100;
    line3.Left = 50;

    // Add an elbow double-arrow connector
    let line2 = sheet.TypedLines.AddLine();
    line2.LineShapeType = xlsModule.LineShapeType.ElbowLine;
    line2.Width = 50;
    line2.Height = 50;
    line2.EndArrowHeadStyle = xlsModule.ShapeArrowStyleType.LineArrow;
    line2.BeginArrowHeadStyle = xlsModule.ShapeArrowStyleType.LineArrow;
    line2.Left = 120;
    line2.Top = 100;

    // Add a curved arrow connector
    line3 = sheet.TypedLines.AddLine();
    line3.LineShapeType = xlsModule.LineShapeType.CurveLine;
    line3.Width = 30;
    line3.Height = 50;
    line3.EndArrowHeadStyle = xlsModule.ShapeArrowStyleType.LineArrowOpen;
    line3.Top = 100;
    line3.Left = 200;

    // Add a curved double-arrow connector
    line2 = sheet.TypedLines.AddLine();
    line2.LineShapeType = xlsModule.LineShapeType.CurveLine;
    line2.Width = 30;
    line2.Height = 50;
    line2.EndArrowHeadStyle = xlsModule.ShapeArrowStyleType.LineArrowOpen;
    line2.BeginArrowHeadStyle = xlsModule.ShapeArrowStyleType.LineArrowOpen;
    line2.Left = 250;
    line2.Top = 100;

    // Save the workbook
    const outputFileName = 'AddArrowLines.xlsx';
    workbook.SaveToFile({ fileName: outputFileName, version: xlsModule.ExcelVersion.Version2010 });

    // Release resources
    workbook.Dispose();

    // Read the saved file from the VFS and trigger the download
    const fileArray = window.dotnetRuntime.Module.FS.readFile(outputFileName);
    const blob = new Blob([fileArray], { type: 'application/vnd.openxmlformats-officedocument.spreadsheetml.sheet' });
    const url = URL.createObjectURL(blob);
    const a = document.createElement('a');
    a.href = url;
    a.download = outputFileName;
    a.click();
    URL.revokeObjectURL(url);
  };

  return (
    <div style={{ textAlign: 'center', height: '300px' }}>
      <h1>Add Arrow Lines</h1>
      <button onClick={addArrowLines}>Start</button>
    </div>
  );
}

export default App;
Sechs Linien mit Pfeilspitzen: Doppelpfeil, Einzelpfeil, geknickter Pfeil, geknickter Doppelpfeil, geschwungener Pfeil und geschwungener Doppelpfeil
Beachten Sie die Wiederverwendung der Variablen line3 und line2 in der zweiten Hälfte der Funktion. Jeder Aufruf von TypedLines.AddLine() gibt ein neues Linienobjekt zurück, das bereits zum Arbeitsblatt hinzugefügt wurde – die Variable ist ein Handle zum Festlegen von Eigenschaften, kein Container, der erhalten bleiben muss. Die Wiederverwendung des Variablennamens für die nächste Linie ist sicher, da die vorherige Linie bereits in der Formensammlung des Blatts festgeschrieben ist.
Bestehende Linien verwalten
Ein Arbeitsblatt, das bereits Linien enthält – sei es durch Ihren Code hinzugefügt, aus einer Datei importiert oder von einem Benutzer gezeichnet – macht sie über die sheet.Shapes-Sammlung verfügbar. Jede Form kann über den Index abgerufen und über ihre Eigenschaften geändert werden:
// Get the first shape in the worksheet
let shape = sheet.Shapes.get(0);
// Modify its properties — color, dash style, etc.
shape.Color = xlsModule.Color.get_Red();
Zum Löschen entfernt sheet.Shapes.Remove(index) die Form am angegebenen Index. Um Linien selektiv zu entfernen – nach Name, nach Typ oder nach Position –, durchlaufen Sie die Sammlung und entfernen Sie die passenden Formen. Löschen Sie in einer Schleife vom letzten Index abwärts, da das Entfernen eines Elements die Indizes aller nachfolgenden Elemente verschiebt.
Häufige Probleme
Die Pfeilspitze wird nicht angezeigt.
BeginArrowHeadStyle oder EndArrowHeadStyle wurde nicht festgelegt oder auf LineNoArrow gesetzt. Prüfen Sie, an welchem Ende Sie den Pfeil erwarten, und weisen Sie die entsprechende Eigenschaft zu. Eine Linie, bei der keine der beiden Eigenschaften festgelegt ist, hat an keinem Ende Pfeile.
Die Linie erscheint an der falschen Position.
Top und Left sind in Pixeln angegeben, nicht in Zeilen und Spalten. Der Wert Top = 10 platziert die Linie 10 Pixel vom oberen Rand des Blatts entfernt, nicht in Zeile 10. Wenn Sie die Lines.AddLine()-API gewohnt sind, ist dies die häufigste Ursache für eine Fehlplatzierung.
Die geknickte Verbindungslinie knickt in die falsche Richtung.
Die Knickrichtung hängt von den Vorzeichen und den relativen Größen von Width und Height ab. Ein positives Width mit einem positiven Height knickt nach unten rechts. Vertauschen Sie das Vorzeichen oder die beiden Werte, um den Knick zu ändern. Testen Sie zunächst mit kleinen Werten.
Die geschwungene Linie krümmt sich nicht so, wie ich es erwartet habe.
Eine CurveLine über TypedLines zeichnet einen glatten Bogen zwischen Start- und Endpunkt, und die Form des Bogens wird von Width und Height beeinflusst. Anders als eine geknickte Verbindungslinie, die einen einzigen rechtwinkligen Knick aufweist, ist eine Kurve kontinuierlich – aber ihr genauer Verlauf hängt von den Abmessungen ab, prüfen Sie also die Ausgabe, bevor Sie sich für ein präzises Layout darauf verlassen.
FAQ
Was ist der Unterschied zwischen LineArrow und LineArrowOpen?
LineArrow zeichnet eine ausgefüllte dreieckige Pfeilspitze. LineArrowOpen zeichnet eine offene V-förmige Pfeilspitze – zwei Striche ohne Füllung. Der offene Stil ist in Datenfluss- und Entity-Relationship-Diagrammen üblich, in denen der Pfeil die Richtung anzeigt, ohne einen bestimmten Mechanismus zu implizieren.
Kann ich an den beiden Enden unterschiedliche Pfeilstile festlegen?
Ja. BeginArrowHeadStyle und EndArrowHeadStyle sind unabhängige Eigenschaften. Eine Linie mit LineArrow an einem Ende und LineArrowOpen am anderen ist zulässig und vermittelt, dass eine Richtung definitiv und die andere vorläufig ist.
Wie stehen Pixelkoordinaten zum Layout des Arbeitsblatts in Beziehung?
Pixelkoordinaten werden von der oberen linken Ecke des Arbeitsblatts aus gemessen. Zeilenhöhen und Spaltenbreiten in Excel werden in Punkten bzw. Zeichen gemessen, sodass für die Umrechnung zwischen Zellpositionen und Pixelkoordinaten die aktuellen Zeilenhöhen und Spaltenbreiten berücksichtigt werden müssen. Für Linien, die an Zellgrenzen ausgerichtet werden müssen, ist Lines.AddLine() mit Zeilen- und Spaltenparametern möglicherweise einfacher.
Kann ich Lines.AddLine() und TypedLines.AddLine() im selben Arbeitsblatt mischen?
Ja. Beide APIs fügen Formen zur Formensammlung desselben Arbeitsblatts hinzu. Ein Arbeitsblatt kann gleichzeitig grundlegende Linienformen und Linien mit Pfeilspitzen enthalten.
Erfordert dies eine installierte Excel-Version?
Nein. Die Engine läuft als WebAssembly im Browser. Linien und Pfeile werden als Standard-Formobjekte in der Arbeitsblatt-XML geschrieben, und Excel rendert sie beim Öffnen der Datei nativ.
Siehe auch
Добавление стрелочных соединителей в Excel на JavaScript (React)
Содержание
Линия между двумя блоками на блок-схеме говорит «они связаны». Стрелка от одного к другому говорит «этот идёт первым». Именно это различие — направление — отличает соединитель от декоративного элемента, и это единственное, что базовый API Lines.AddLine() не может сделать на обоих концах. Схема процесса требует стрелки, выходящей из каждого шага; диаграмма причинно-следственных связей требует стрелок, указывающих внутрь; сравнение иногда требует двунаправленных стрелок, чтобы показать двустороннюю связь. Ничего из этого невозможно с одним EndArrowHeadStyle.
Spire.XLS for JavaScript предоставляет sheet.TypedLines.AddLine() именно для такого случая. Он позиционирует линии по пиксельным координатам вместо строк и столбцов и принимает BeginArrowHeadStyle и EndArrowHeadStyle независимо — так что линия может нести стрелку на одном конце, на обоих концах или ни на одном. Движок работает в браузере на WebAssembly, файлы перемещаются через виртуальную файловую систему (VFS), и никакого бэкенда не задействовано.
О настройке проекта см. Интеграция Spire.XLS for JavaScript в проект React. Приведённые ниже примеры предполагают, что пакет установлен и модуль WebAssembly инициализирован.
Направление меняет всё
Три диаграммы, три разных требования к направлению, и один и тот же API линий справляется со всеми:
| Тип диаграммы | Конфигурация стрелок | Что она сообщает |
|---|---|---|
| Схема процесса | Стрелка только на конце | Последовательное выполнение — шаг A ведёт к шагу B |
| Причинная цепочка | Стрелка только на конце, несколько линий последовательно | Причина порождает следствие, которое порождает следующее следствие |
| Двунаправленная связь | Стрелка на обоих концах | Взаимная связь — A влияет на B, а B влияет на A |
| Указатель-аннотация | Стрелка на конце, нет стрелки на начале | Метка указывает на ячейку, которую она описывает |
Сам стиль наконечника стрелки также несёт смысл. Залитая сплошная стрелка (LineArrow) воспринимается как определённая, устойчивая связь. Открытая стрелка (LineArrowOpen) воспринимается как более свободная, менее определённая — что часто встречается в диаграммах потоков данных, где направление известно, но механизм не указан.
Предварительные требования
Вам нужен проект React с установленным Spire.XLS for JavaScript и инициализированным модулем WebAssembly, доступным по адресу window.wasmModule.spirexls. Пример загружает шрифт в VFS и сохраняет с флагом версии Excel 2010.
TypedLines против Lines: в чём разница
sheet.Lines.AddLine() и sheet.TypedLines.AddLine() — это два отдельных API для двух разных задач. Различия структурные, а не косметические:
Lines.AddLine() |
TypedLines.AddLine() |
|
|---|---|---|
| Позиционирование | Координаты строк и столбцов | Пиксельные координаты (Top, Left) |
| Размер | width и height в конструкторе |
Width и Height как свойства |
| Стрелка на конце | EndArrowHeadStyle |
EndArrowHeadStyle |
| Стрелка на начале | Не поддерживается | BeginArrowHeadStyle |
| Тип линии | Задаётся через lineShapeType в конструкторе |
Задаётся через свойство LineShapeType |
| Лучше всего подходит для | Простые фигуры линий, выровненные по ячейкам | Направленные соединители с точным размещением |
Поддержка стрелки на начале — самое значимое различие. С Lines.AddLine() линия может иметь наконечник на конце, но не в начале — этого достаточно для одностороннего потока, но не для двунаправленной связи. TypedLines.AddLine() снимает это ограничение.
Для базовых фигур линий без стрелок см. Вставка фигур линий в Excel на JavaScript (React), где рассматривается API Lines.AddLine().
Позиционирование с точностью до пикселя
TypedLines.AddLine() размещает линии с помощью Top и Left в пикселях, а Width и Height управляют их протяжённостью:
let line = sheet.TypedLines.AddLine();
line.Top = 10;     // 10 pixels from the top of the sheet
line.Left = 20;    // 20 pixels from the left
line.Width = 100;  // 100 pixels wide
line.Height = 0;   // 0 height — a horizontal line
Height, равный 0, создаёт горизонтальную линию; Width, равный 0, создаёт вертикальную. Установка обоих значений в ненулевые значения создаёт диагональный или изогнутый соединитель, в зависимости от LineShapeType.
Переход от координат строк и столбцов к пиксельным координатам имеет наибольшее значение, когда линии должны соединять определённые точки внутри ячеек — середину объединённого диапазона, край границы — а не выравниваться по границам ячеек. Пиксельное позиционирование позволяет вычислить точное начало и конец исходя из известной вам разметки, а не оценивать, какая строка и столбец подходят ближе всего.
Комбинации стрелок
Когда BeginArrowHeadStyle и EndArrowHeadStyle заданы независимо, четыре комбинации охватывают распространённые случаи:
| Начало | Конец | Визуально | Значение |
|---|---|---|---|
LineNoArrow |
LineArrow |
→ | Одностороннее направление: A ведёт к B |
LineArrow |
LineArrow |
↔ | Двунаправленное: A и B влияют друг на друга |
LineArrow |
LineNoArrow |
← | Обратное одностороннее: B ведёт к A (редко, но полезно для макетов справа налево) |
LineNoArrow |
LineNoArrow |
— | Без направления: обычный соединитель (для простоты используйте вместо этого Lines.AddLine()) |
Стиль стрелки также может быть LineArrowOpen — открытая V-образная форма, а не залитый треугольник — на любом из концов. Смешивание стилей на двух концах допустимо: залитая стрелка на одном конце и открытая на другом сообщает, что одно направление определённое, а другое — предположительное.
Вставка линий со стрелками
В примере в новый рабочий лист вставляются шесть линий со стрелками, охватывающих распространённые комбинации: линия с двойной стрелкой, линия с одной стрелкой, угловой соединитель со стрелкой, угловой соединитель с двойной стрелкой, изогнутый соединитель со стрелкой и изогнутый соединитель с двойной стрелкой. Шаги следующие:
- Создайте объект
Workbookи получите первый рабочий лист. - Вызовите
Worksheet.TypedLines.AddLine()для создания каждой линии. - Задайте положение линии через
Top,Left,WidthиHeight(в пикселях). - Задайте стили стрелок на обоих концах через
BeginArrowHeadStyleиEndArrowHeadStyle. - Укажите тип линии через
LineShapeType(прямая, угловая, изогнутая и т. д.). - Сохраните книгу с помощью
Workbook.SaveToFile().
function App() {
  const addArrowLines = async () => {
    // Get the Spire.XLS WASM module
    const xlsModule = window.wasmModule?.spirexls;

    // Check whether the module is ready
    if (!xlsModule) {
      alert('Spire.Xls is not ready yet');
      return;
    }

    // Load the font into the VFS for text measurement and column auto-fit
    await window.spire.FetchFileToVFS('ARIAL.TTF', '/Library/Fonts/', `${process.env.PUBLIC_URL}/font/`);

    // Create a new workbook and get the first worksheet
    const workbook = new xlsModule.Workbook();
    const sheet = workbook.Worksheets.get(0);

    // Add a double-arrow line - solid blue
    let line = sheet.TypedLines.AddLine();
    line.Top = 10;
    line.Left = 20;
    line.Width = 100;
    line.Height = 0;
    line.Color = xlsModule.Color.get_Blue();
    line.BeginArrowHeadStyle = xlsModule.ShapeArrowStyleType.LineArrow;
    line.EndArrowHeadStyle = xlsModule.ShapeArrowStyleType.LineArrow;

    // Add a single-arrow line - solid red
    let line_1 = sheet.TypedLines.AddLine();
    line_1.Top = 50;
    line_1.Left = 30;
    line_1.Width = 100;
    line_1.Height = 100;
    line_1.Color = xlsModule.Color.get_Red();
    line_1.BeginArrowHeadStyle = xlsModule.ShapeArrowStyleType.LineNoArrow;
    line_1.EndArrowHeadStyle = xlsModule.ShapeArrowStyleType.LineArrow;

    // Add an elbow arrow connector
    let line3 = sheet.TypedLines.AddLine();
    line3.LineShapeType = xlsModule.LineShapeType.ElbowLine;
    line3.Width = 30;
    line3.Height = 50;
    line3.EndArrowHeadStyle = xlsModule.ShapeArrowStyleType.LineArrow;
    line3.Top = 100;
    line3.Left = 50;

    // Add an elbow double-arrow connector
    let line2 = sheet.TypedLines.AddLine();
    line2.LineShapeType = xlsModule.LineShapeType.ElbowLine;
    line2.Width = 50;
    line2.Height = 50;
    line2.EndArrowHeadStyle = xlsModule.ShapeArrowStyleType.LineArrow;
    line2.BeginArrowHeadStyle = xlsModule.ShapeArrowStyleType.LineArrow;
    line2.Left = 120;
    line2.Top = 100;

    // Add a curved arrow connector
    line3 = sheet.TypedLines.AddLine();
    line3.LineShapeType = xlsModule.LineShapeType.CurveLine;
    line3.Width = 30;
    line3.Height = 50;
    line3.EndArrowHeadStyle = xlsModule.ShapeArrowStyleType.LineArrowOpen;
    line3.Top = 100;
    line3.Left = 200;

    // Add a curved double-arrow connector
    line2 = sheet.TypedLines.AddLine();
    line2.LineShapeType = xlsModule.LineShapeType.CurveLine;
    line2.Width = 30;
    line2.Height = 50;
    line2.EndArrowHeadStyle = xlsModule.ShapeArrowStyleType.LineArrowOpen;
    line2.BeginArrowHeadStyle = xlsModule.ShapeArrowStyleType.LineArrowOpen;
    line2.Left = 250;
    line2.Top = 100;

    // Save the workbook
    const outputFileName = 'AddArrowLines.xlsx';
    workbook.SaveToFile({ fileName: outputFileName, version: xlsModule.ExcelVersion.Version2010 });

    // Release resources
    workbook.Dispose();

    // Read the saved file from the VFS and trigger the download
    const fileArray = window.dotnetRuntime.Module.FS.readFile(outputFileName);
    const blob = new Blob([fileArray], { type: 'application/vnd.openxmlformats-officedocument.spreadsheetml.sheet' });
    const url = URL.createObjectURL(blob);
    const a = document.createElement('a');
    a.href = url;
    a.download = outputFileName;
    a.click();
    URL.revokeObjectURL(url);
  };

  return (
    <div style={{ textAlign: 'center', height: '300px' }}>
      <h1>Add Arrow Lines</h1>
      <button onClick={addArrowLines}>Start</button>
    </div>
  );
}

export default App;
Шесть линий со стрелками: двойная стрелка, одинарная стрелка, угловая стрелка, угловая двойная стрелка, изогнутая стрелка и изогнутая двойная стрелка
Обратите внимание на повторное использование переменных line3 и line2 во второй половине функции. Каждый вызов TypedLines.AddLine() возвращает новый объект линии, который уже добавлен на рабочий лист — переменная является дескриптором для задания свойств, а не контейнером, который нужно сохранять. Повторное использование имени переменной для следующей линии безопасно, потому что предыдущая линия уже добавлена в коллекцию фигур листа.
Управление существующими линиями
Рабочий лист, который уже содержит линии — добавленные вашим кодом, импортированные из файла или нарисованные пользователем — предоставляет к ним доступ через коллекцию sheet.Shapes. Каждую фигуру можно получить по индексу и изменить через её свойства:
// Get the first shape in the worksheet
let shape = sheet.Shapes.get(0);
// Modify its properties — color, dash style, etc.
shape.Color = xlsModule.Color.get_Red();
Для удаления sheet.Shapes.Remove(index) удаляет фигуру по указанному индексу. Чтобы удалять линии выборочно — по имени, по типу или по положению — переберите коллекцию и удалите подходящие фигуры. При удалении в цикле удаляйте с последнего индекса вниз, поскольку удаление элемента сдвигает индексы всех элементов после него.
Типичные проблемы
Наконечник стрелки не отображается.
BeginArrowHeadStyle или EndArrowHeadStyle не был задан или был установлен в LineNoArrow. Проверьте, на каком конце вы ожидаете стрелку, и присвойте соответствующее свойство. Линия, у которой не задано ни одно из свойств, не имеет стрелок ни на одном конце.
Линия отображается в неправильном положении.
Top и Left задаются в пикселях, а не в строках и столбцах. Значение Top = 10 размещает линию на расстоянии 10 пикселей от верхнего края листа, а не в строке 10. Если вы привыкли к API Lines.AddLine(), это наиболее частая причина неправильного размещения.
Угловой соединитель изгибается не в ту сторону.
Направление изгиба зависит от знаков и относительных величин Width и Height. Положительные Width и Height дают изгиб вправо-вниз. Измените знак или поменяйте два значения местами, чтобы изменить изгиб. Сначала протестируйте с небольшими значениями.
Изогнутая линия изгибается не так, как я ожидал.
CurveLine через TypedLines рисует плавную дугу между начальной и конечной точками, и на форму дуги влияют Width и Height. В отличие от углового соединителя, у которого один изгиб под прямым углом, кривая непрерывна — но её точный путь зависит от размеров, поэтому проверьте результат, прежде чем полагаться на него для точной разметки.
Часто задаваемые вопросы
В чём разница между LineArrow и LineArrowOpen?
LineArrow рисует залитый треугольный наконечник стрелки. LineArrowOpen рисует открытый V-образный наконечник стрелки — два штриха без заливки. Открытый стиль часто встречается в диаграммах потоков данных и диаграммах «сущность-связь», где стрелка указывает направление, не подразумевая конкретного механизма.
Могу ли я задать разные стили стрелок на двух концах?
Да. BeginArrowHeadStyle и EndArrowHeadStyle — независимые свойства. Линия с LineArrow на одном конце и LineArrowOpen на другом допустима и сообщает, что одно направление определённое, а другое — предположительное.
Как пиксельные координаты соотносятся с разметкой рабочего листа?
Пиксельные координаты отсчитываются от верхнего левого угла рабочего листа. Высота строк и ширина столбцов в Excel измеряются в пунктах и символах соответственно, поэтому для преобразования между позициями ячеек и пиксельными координатами необходимо учитывать текущую высоту строк и ширину столбцов. Для линий, которые должны выравниваться по границам ячеек, Lines.AddLine() с параметрами строк и столбцов может оказаться проще.
Могу ли я смешивать Lines.AddLine() и TypedLines.AddLine() в одном рабочем листе?
Да. Оба API добавляют фигуры в коллекцию фигур одного и того же рабочего листа. Рабочий лист может одновременно содержать базовые фигуры линий и линии со стрелками.
Требуется ли для этого установленный Excel?
Нет. Движок работает как WebAssembly в браузере. Линии и стрелки записываются как стандартные объекты фигур в XML рабочего листа, и Excel отображает их нативно при открытии файла.
См. также
Make Excel Data Visual with Conditional Formatting in JavaScript
Table of Contents
A sales table with twenty columns of numbers is accurate and unreadable. The eye cannot compare 43,210 against 38,900 across a row fast enough to find the weak quarter, and the person reading the report knows this — which is why they ask for a chart. But a chart per column means twenty charts, and now the worksheet is a gallery instead of a table.
Data bars, color scales, and icon sets solve this inside the cells themselves. A bar grows in proportion to the value. A color shifts from pale to saturated as the number rises. An icon changes shape when the value crosses a threshold. None of them add rows, columns, or floating objects — the visualization sits in the cell that already holds the number. All three are forms of Excel conditional formatting, and Spire.XLS for JavaScript applies them through a single API in the browser on WebAssembly, with files moving through a virtual file system (VFS) and no backend required.
For project setup, see Integrating Spire.XLS for JavaScript in a React Project. The examples below assume the package is installed and the WebAssembly module has been initialized.
Why not just add a chart
Charts and in-cell visualization answer the same question — "how do these values compare?" — but they fit different moments:
| Charts | In-cell visualization | |
|---|---|---|
| Space | Floats over the worksheet, occupies a rectangular area | Lives inside the cells that already hold the data |
| Density | One chart per data set; multiple charts crowd the sheet | One format per range; dozens of columns can carry cues simultaneously |
| Detail | Shows axes, gridlines, labels — a full rendering | Shows only the cue: a bar, a color, an icon |
| Best for | Presentations, reports, standalone displays | Scanning a table, spotting outliers, comparing across many columns |
When the goal is to make a table of numbers scannable without rebuilding the layout, in-cell visualization is the lighter tool. The three sections below cover each type, and they share more API than they differ on — which is the first thing worth knowing.
Prerequisites
You need a React project with Spire.XLS for JavaScript installed and the WebAssembly module initialized, reachable at window.wasmModule.spirexls. The sample loads a font and a sales data file into the VFS, and saves with the Excel 2010 version flag, which is the earliest version that supports these conditional format types.
One API, three visualizations
All three types follow the same chain of calls. The only line that changes is the FormatType assignment:
sheet.ConditionalFormats.Add() → xcfs.AddRange(range) → format = xcfs.AddCondition() → format.FormatType = ???
| Visualization | FormatType value |
Extra setup |
|---|---|---|
| Data bars | ConditionalFormatType.DataBar |
DataBar.BarColor for the fill color |
| Color scales | ConditionalFormatType.ColorScale |
None — defaults to a two-color gradient |
| Icon sets | ConditionalFormatType.IconSet |
IconSet.IconSetType for the icon style |
The shared chain is why the three code examples below look similar — they are the same operation with a different format type. The differences are in what each type produces and when you would reach for it, which is what the comparison table later in this article addresses.
Data bars: magnitude at a glance
A data bar draws a horizontal colored band inside each cell, and the band's length is proportional to the cell's value relative to the rest of the selected range. The largest value fills the cell; the smallest fills a sliver. Scanning a row of data bars is the same mental operation as scanning a bar chart, except the numbers stay visible underneath.
The steps are:
- Load the font and the test data file into the VFS.
- Load the workbook and get the worksheet.
- Call
ConditionalFormats.Addto create a conditional format, and bind the data range withAddRange. - Call
AddConditionto add a condition, setFormatTypetoDataBar, and set the bar color. - Save the workbook.
function App() {
  const applyDataBars = async () => {
    // Get the Spire.XLS WASM module
    const xlsModule = window.wasmModule?.spirexls;

    // Check whether the module is ready
    if (!xlsModule) {
      alert('Spire.Xls is not ready yet');
      return;
    }

    // Load the font and the test data file into the VFS
    await window.spire.FetchFileToVFS('ARIAL.TTF', '/Library/Fonts/', `${process.env.PUBLIC_URL}/font/`);
    const inputFileName = 'SalesData.xlsx';
    await window.spire.FetchFileToVFS(inputFileName, '', `${process.env.PUBLIC_URL}data/`);

    // Load the workbook and get the first worksheet
    const workbook = new xlsModule.Workbook();
    workbook.LoadFromFile({ fileName: inputFileName });
    const sheet = workbook.Worksheets.get(0);

    // Select the data range that receives the data bars
    const dataRange = sheet.Range.get("B2:E9");

    // Create a conditional format and bind it to that range
    const xcfs = sheet.ConditionalFormats.Add();
    xcfs.AddRange(dataRange);

    // Add a data bar condition and set the bar color
    const format = xcfs.AddCondition();
    format.FormatType = xlsModule.ConditionalFormatType.DataBar;
    format.DataBar.BarColor = xlsModule.Color.get_CadetBlue();

    // Save the workbook
    const outputFileName = "ApplyDataBars.xlsx";
    workbook.SaveToFile({ fileName: outputFileName, version: xlsModule.ExcelVersion.Version2010 });

    // Dispose of the workbook object to free resources
    workbook.Dispose();

    // Read the result file from the VFS and trigger the download
    const fileArray = window.dotnetRuntime.Module.FS.readFile(outputFileName);
    const blob = new Blob([fileArray], { type: 'application/vnd.openxmlformats-officedocument.spreadsheetml.sheet' });
    const url = URL.createObjectURL(blob);
    const a = document.createElement('a');
    a.href = url;
    a.download = outputFileName;
    a.click();
    URL.revokeObjectURL(url);
  };

  return (
    <div style={{ textAlign: 'center', height: '300px' }}>
      <h1>Apply Data Bars</h1>
      <button onClick={applyDataBars}>Start</button>
    </div>
  );
}

export default App;
Data bars applied to a sales figures table, bar length proportional to cell value
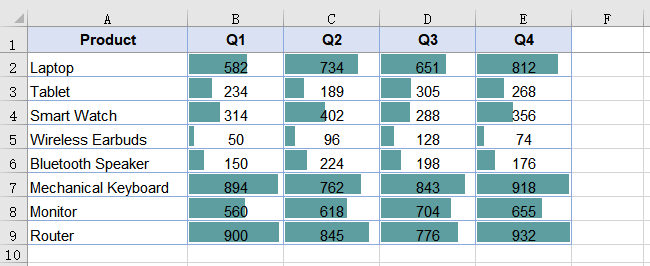
Only numeric cells receive bars — text cells inside the range are skipped. This is expected: a data bar expresses relative magnitude, and text has no magnitude to express. Keep the range bounded by the numeric area; including a product-name column or a header row does not cause an error, but those cells will show nothing.
Color scales: heat-mapping without a chart
A color scale shades each cell based on where its value falls between the range minimum and maximum. No color arguments are required — when none are specified, the result is a two-color scale that takes orange at the minimum and pale yellow at the maximum, with intermediate values shaded proportionally. The effect is a heat map embedded in the data table: hot spots and cold spots are visible without sorting or charting.
The steps are the same as for data bars, with FormatType set to ColorScale and no additional properties:
- Load the font and the test data file into the VFS.
- Load the workbook and get the worksheet.
- Call
ConditionalFormats.Addto create a conditional format, and bind the data range withAddRange. - Call
AddConditionto add a condition, and setFormatTypetoColorScale. - Save the workbook.
function App() {
  const applyColorScales = async () => {
    // Get the Spire.XLS WASM module
    const xlsModule = window.wasmModule?.spirexls;

    // Check whether the module is ready
    if (!xlsModule) {
      alert('Spire.Xls is not ready yet');
      return;
    }

    // Load the font and the test data file into the VFS
    await window.spire.FetchFileToVFS('ARIAL.TTF', '/Library/Fonts/', `${process.env.PUBLIC_URL}/font/`);
    const inputFileName = 'SalesData.xlsx';
    await window.spire.FetchFileToVFS(inputFileName, '', `${process.env.PUBLIC_URL}data/`);

    // Load the workbook and get the first worksheet
    const workbook = new xlsModule.Workbook();
    workbook.LoadFromFile({ fileName: inputFileName });
    const sheet = workbook.Worksheets.get(0);

    // Select the data range that receives the color scales
    const dataRange = sheet.Range.get("B2:E9");

    // Create a conditional format and bind it to that range
    const xcfs = sheet.ConditionalFormats.Add();
    xcfs.AddRange(dataRange);

    // Add a color scale condition; colors transition with the values
    const format = xcfs.AddCondition();
    format.FormatType = xlsModule.ConditionalFormatType.ColorScale;

    // Save the workbook
    const outputFileName = "ApplyColorScales.xlsx";
    workbook.SaveToFile({ fileName: outputFileName, version: xlsModule.ExcelVersion.Version2010 });

    // Dispose of the workbook object to free resources
    workbook.Dispose();

    // Read the result file from the VFS and trigger the download
    const fileArray = window.dotnetRuntime.Module.FS.readFile(outputFileName);
    const blob = new Blob([fileArray], { type: 'application/vnd.openxmlformats-officedocument.spreadsheetml.sheet' });
    const url = URL.createObjectURL(blob);
    const a = document.createElement('a');
    a.href = url;
    a.download = outputFileName;
    a.click();
    URL.revokeObjectURL(url);
  };

  return (
    <div style={{ textAlign: 'center', height: '300px' }}>
      <h1>Apply Color Scales</h1>
      <button onClick={applyColorScales}>Start</button>
    </div>
  );
}

export default App;
Color scales applied to a sales figures table, shading from orange to pale yellow
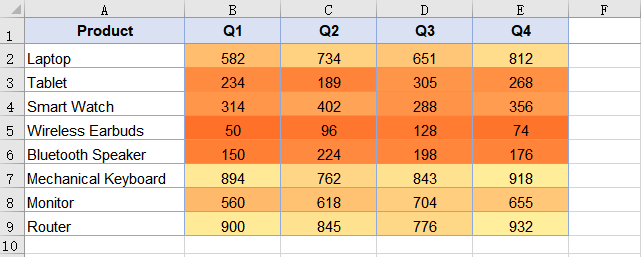
Where data bars show absolute magnitude through bar length, color scales show relative position through hue. A value in the middle of the range gets a mid-tone regardless of whether the range spans 1 to 100 or 10,000 to 50,000 — the shading is positional, not absolute.
Icon sets: status bands
An icon set places a different icon in each cell based on which band the value falls into. The example uses three-traffic-lights: red for the lowest third, yellow for the middle, green for the highest. Unlike data bars and color scales, which communicate a continuous gradient, icon sets communicate a discrete category — "this is low", "this is medium", "this is high" — which is closer to a status indicator than a measurement.
The steps differ only in the FormatType and the icon style selection:
- Load the font and the test data file into the VFS.
- Load the workbook and get the worksheet.
- Call
ConditionalFormats.Addto create a conditional format, and bind the data range withAddRange. - Call
AddConditionto add a condition, setFormatTypetoIconSet, and specify the icon set type. - Save the workbook.
function App() {
  const applyIconSets = async () => {
    // Get the Spire.XLS WASM module
    const xlsModule = window.wasmModule?.spirexls;

    // Check whether the module is ready
    if (!xlsModule) {
      alert('Spire.Xls is not ready yet');
      return;
    }

    // Load the font and the test data file into the VFS
    await window.spire.FetchFileToVFS('ARIAL.TTF', '/Library/Fonts/', `${process.env.PUBLIC_URL}/font/`);
    const inputFileName = 'SalesData.xlsx';
    await window.spire.FetchFileToVFS(inputFileName, '', `${process.env.PUBLIC_URL}data/`);

    // Load the workbook and get the first worksheet
    const workbook = new xlsModule.Workbook();
    workbook.LoadFromFile({ fileName: inputFileName });
    const sheet = workbook.Worksheets.get(0);

    // Select the data range that receives the icon sets
    const dataRange = sheet.Range.get("B2:E9");

    // Create a conditional format and bind it to that range
    const xcfs = sheet.ConditionalFormats.Add();
    xcfs.AddRange(dataRange);

    // Add an icon set condition and set the icon style to three traffic lights
    const format = xcfs.AddCondition();
    format.FormatType = xlsModule.ConditionalFormatType.IconSet;
    format.IconSet.IconSetType = xlsModule.IconSetType.ThreeTrafficLights1;

    // Save the workbook
    const outputFileName = "ApplyIconSets.xlsx";
    workbook.SaveToFile({ fileName: outputFileName, version: xlsModule.ExcelVersion.Version2010 });

    // Dispose of the workbook object to free resources
    workbook.Dispose();

    // Read the result file from the VFS and trigger the download
    const fileArray = window.dotnetRuntime.Module.FS.readFile(outputFileName);
    const blob = new Blob([fileArray], { type: 'application/vnd.openxmlformats-officedocument.spreadsheetml.sheet' });
    const url = URL.createObjectURL(blob);
    const a = document.createElement('a');
    a.href = url;
    a.download = outputFileName;
    a.click();
    URL.revokeObjectURL(url);
  };

  return (
    <div style={{ textAlign: 'center', height: '300px' }}>
      <h1>Apply Icon Sets</h1>
      <button onClick={applyIconSets}>Start</button>
    </div>
  );
}

export default App;
Icon sets applied to a sales figures table, traffic-light icons based on value bands
An icon set divides the range into bands, so the same icon covers a different span of values in different ranges. In a range of 10 to 90, the green icon covers roughly 60 to 90; in a range of 10 to 900, it covers roughly 600 to 900. The bands are relative, not absolute — which is the right default for a table where each column has its own scale, but worth knowing if you expect a fixed threshold.
Choosing between the three
All three are applied to a range, all three live inside the cells, and all three are conditional formatting. The choice is about what the reader needs to do with the numbers:
| The reader needs to | Use | Because |
|---|---|---|
| Compare magnitudes across a row or column | Data bars | Bar length is the most precise visual cue for "how much" |
| Spot hot and cold spots in a large table | Color scales | Color intensity registers peripherally even when the eye is not focused on a specific cell |
| Classify values into a few status categories | Icon sets | Discrete icons map to discrete decisions — "this needs attention", "this is fine" |
| See all of the above at once | Combine on different ranges | Each conditional format is independent; apply data bars to one range and icon sets to another |
The three are not mutually exclusive. A worksheet can carry data bars on the revenue columns and icon sets on the growth-rate column in the same save, because each call to ConditionalFormats.Add creates an independent format bound to its own range.
Customizing data bar appearance
The fill color of a data bar comes from DataBar.BarColor. Setting only FormatType without BarColor yields the default blue. A border is also available, but it has a dependency: the border type must be set before the border color takes effect.
// Set the border type first so that the border color takes effect
format.DataBar.BarBorder.Type = xlsModule.DataBarBorderType.DataBarBorderSolid;
format.DataBar.BarBorder.Color = xlsModule.Color.get_Red();

// Fill color of the bar
format.DataBar.BarColor = xlsModule.Color.get_GreenYellow();
Setting BarBorder.Color on its own, without first setting BarBorder.Type, has no effect — the border is not drawn because no border type has been declared. Color scales and icon sets do not have equivalent appearance properties; their styling is determined by the format type and, for icon sets, the IconSetType enum.
Common issues
Text cells in the target range show no data bars. This is expected. A data bar expresses relative magnitude, and only numeric cells have magnitude. Text cells are skipped silently — no error, no bar. Keep the range limited to the numeric area.
Data bars are all the default blue.
DataBar.BarColor was not set after FormatType was assigned. Set it to any xlsModule.Color value to change the fill.
The data bar border color is not showing.
The border type was not set first. Assign DataBar.BarBorder.Type before DataBar.BarBorder.Color — the color only takes effect once a solid border type is declared.
No visible change after applying a conditional format.
Check that the range passed to AddRange matches where the data actually is. A range pointing at empty cells produces no error and no visible result.
FAQ
Can I apply more than one conditional format to the same range?
Yes. Each call to ConditionalFormats.Add creates an independent format. Two formats can target the same range, though the visual result of stacking a data bar and a color scale on the same cells may be confusing — it is usually clearer to apply different types to different ranges.
Which Excel versions support these conditional format types?
Data bars, color scales, and icon sets were introduced in Excel 2007. The sample saves with ExcelVersion.Version2010 to ensure compatibility with both Excel 2010 and later versions.
Do I need Excel installed to apply conditional formatting?
No. The spreadsheet engine is bundled with the package and runs as WebAssembly in the browser. The conditional formatting is written as standard XML inside the .xlsx file, and Excel renders it when the file is opened.
Can I set custom thresholds for icon sets?
The IconSetType enum selects a predefined icon style with predefined band boundaries. The example uses ThreeTrafficLights1, which divides the range into three equal bands.
Does the conditional formatting survive if the file is opened and re-saved in Excel?
Yes. Conditional formatting is part of the worksheet's stored format rules, not a rendering artifact. Excel reads, preserves, and re-applies the same rules on recalculation.
See Also
Add Arrow Connectors in Excel in JavaScript (React)
A line between two boxes in a flowchart says "these are related". An arrow from one to the other says "this one comes first". That distinction — direction — is what separates a connector from a decoration, and it is the one thing the basic Lines.AddLine() API cannot do on both ends. A process flow needs an arrow leaving each step; a cause-and-effect diagram needs arrows pointing in; a comparison sometimes needs double-headed arrows to show a bidirectional link. None of these are possible with a single EndArrowHeadStyle.
Spire.XLS for JavaScript provides sheet.TypedLines.AddLine() for exactly this case. It positions lines by pixel coordinates instead of row and column, and it accepts BeginArrowHeadStyle and EndArrowHeadStyle independently — so a line can carry an arrow on one end, both ends, or neither. The engine runs in the browser on WebAssembly, with files moving through a virtual file system (VFS) and no backend involved.
For project setup, see Integrating Spire.XLS for JavaScript in a React Project. The examples below assume the package is installed and the WebAssembly module has been initialized.
Direction changes everything
Three diagrams, three different directional requirements, and the same line API handles all of them:
| Diagram type | Arrow configuration | What it communicates |
|---|---|---|
| Process flow | Arrow on the end only | Sequential execution — step A leads to step B |
| Causal chain | Arrow on the end only, multiple lines in sequence | Cause produces effect, which produces the next effect |
| Bidirectional link | Arrow on both ends | Mutual relationship — A affects B and B affects A |
| Annotation pointer | Arrow on the end, no arrow on the beginning | A label points at the cell it describes |
The arrowhead style itself also carries meaning. A solid filled arrow (LineArrow) reads as a definite, committed connection. An open arrow (LineArrowOpen) reads as a looser, less certain one — common in data-flow diagrams where the direction is known but the mechanism is not specified.
Prerequisites
You need a React project with Spire.XLS for JavaScript installed and the WebAssembly module initialized, reachable at window.wasmModule.spirexls. The sample loads a font into the VFS and saves with the Excel 2010 version flag.
TypedLines vs Lines: what is different
sheet.Lines.AddLine() and sheet.TypedLines.AddLine() are two separate APIs for two separate needs. The differences are structural, not cosmetic:
Lines.AddLine() |
TypedLines.AddLine() |
|
|---|---|---|
| Positioning | Row and column coordinates | Pixel coordinates (Top, Left) |
| Size | width and height in the constructor |
Width and Height as properties |
| Arrow on end | EndArrowHeadStyle |
EndArrowHeadStyle |
| Arrow on beginning | Not supported | BeginArrowHeadStyle |
| Line type | Set via lineShapeType in constructor |
Set via LineShapeType property |
| Best for | Simple line shapes aligned to cells | Directional connectors with precise placement |
The beginning-arrow support is the most consequential difference. With Lines.AddLine(), a line can have an arrowhead at its end but not at its start — which is enough for a one-way flow but not for a bidirectional link. TypedLines.AddLine() removes that constraint.
For basic line shapes without arrows, Insert Line Shapes in Excel in JavaScript (React) covers the Lines.AddLine() API.
Pixel-precise positioning
TypedLines.AddLine() places lines using Top and Left in pixels, with Width and Height controlling the extent:
let line = sheet.TypedLines.AddLine();
line.Top = 10;     // 10 pixels from the top of the sheet
line.Left = 20;    // 20 pixels from the left
line.Width = 100;  // 100 pixels wide
line.Height = 0;   // 0 height — a horizontal line
A Height of 0 produces a horizontal line; a Width of 0 produces a vertical one. Setting both to non-zero values produces a diagonal or a bent connector, depending on the LineShapeType.
The shift from row-and-column to pixel coordinates matters most when lines need to connect specific points inside cells — the middle of a merged range, the edge of a border — rather than aligning with cell boundaries. Pixel positioning lets you compute the exact start and end from the layout you know, rather than estimating which row and column comes closest.
Arrow combinations
With BeginArrowHeadStyle and EndArrowHeadStyle set independently, four combinations cover the common cases:
| Begin | End | Visual | Meaning |
|---|---|---|---|
LineNoArrow |
LineArrow |
→ | One-way direction: A leads to B |
LineArrow |
LineArrow |
↔ | Bidirectional: A and B affect each other |
LineArrow |
LineNoArrow |
← | Reverse one-way: B leads to A (rare, but useful for right-to-left layouts) |
LineNoArrow |
LineNoArrow |
— | No direction: a plain connector (use Lines.AddLine() instead for simplicity) |
The arrow style can also be LineArrowOpen — an open V-shape rather than a filled triangle — on either end. Mixing styles on the two ends is valid: a filled arrow on one end and an open arrow on the other communicates that one direction is definite and the other is tentative.
Insert arrow-tipped lines
The example inserts six arrow-tipped lines into a fresh worksheet, covering the common combinations: a double-arrow line, a single-arrow line, an elbow arrow connector, an elbow double-arrow connector, a curved arrow connector, and a curved double-arrow connector. The steps are:
- Create a
Workbookobject and get the first worksheet. - Call
Worksheet.TypedLines.AddLine()to create each line. - Set line position through
Top,Left,Width, andHeight(in pixels). - Set arrow styles on both ends through
BeginArrowHeadStyleandEndArrowHeadStyle. - Specify the line type through
LineShapeType(straight, elbow, curved, etc.). - Save the workbook with
Workbook.SaveToFile().
function App() {
  const addArrowLines = async () => {
    // Get the Spire.XLS WASM module
    const xlsModule = window.wasmModule?.spirexls;

    // Check whether the module is ready
    if (!xlsModule) {
      alert('Spire.Xls is not ready yet');
      return;
    }

    // Load the font into the VFS for text measurement and column auto-fit
    await window.spire.FetchFileToVFS('ARIAL.TTF', '/Library/Fonts/', `${process.env.PUBLIC_URL}/font/`);

    // Create a new workbook and get the first worksheet
    const workbook = new xlsModule.Workbook();
    const sheet = workbook.Worksheets.get(0);

    // Add a double-arrow line - solid blue
    let line = sheet.TypedLines.AddLine();
    line.Top = 10;
    line.Left = 20;
    line.Width = 100;
    line.Height = 0;
    line.Color = xlsModule.Color.get_Blue();
    line.BeginArrowHeadStyle = xlsModule.ShapeArrowStyleType.LineArrow;
    line.EndArrowHeadStyle = xlsModule.ShapeArrowStyleType.LineArrow;

    // Add a single-arrow line - solid red
    let line_1 = sheet.TypedLines.AddLine();
    line_1.Top = 50;
    line_1.Left = 30;
    line_1.Width = 100;
    line_1.Height = 100;
    line_1.Color = xlsModule.Color.get_Red();
    line_1.BeginArrowHeadStyle = xlsModule.ShapeArrowStyleType.LineNoArrow;
    line_1.EndArrowHeadStyle = xlsModule.ShapeArrowStyleType.LineArrow;

    // Add an elbow arrow connector
    let line3 = sheet.TypedLines.AddLine();
    line3.LineShapeType = xlsModule.LineShapeType.ElbowLine;
    line3.Width = 30;
    line3.Height = 50;
    line3.EndArrowHeadStyle = xlsModule.ShapeArrowStyleType.LineArrow;
    line3.Top = 100;
    line3.Left = 50;

    // Add an elbow double-arrow connector
    let line2 = sheet.TypedLines.AddLine();
    line2.LineShapeType = xlsModule.LineShapeType.ElbowLine;
    line2.Width = 50;
    line2.Height = 50;
    line2.EndArrowHeadStyle = xlsModule.ShapeArrowStyleType.LineArrow;
    line2.BeginArrowHeadStyle = xlsModule.ShapeArrowStyleType.LineArrow;
    line2.Left = 120;
    line2.Top = 100;

    // Add a curved arrow connector
    line3 = sheet.TypedLines.AddLine();
    line3.LineShapeType = xlsModule.LineShapeType.CurveLine;
    line3.Width = 30;
    line3.Height = 50;
    line3.EndArrowHeadStyle = xlsModule.ShapeArrowStyleType.LineArrowOpen;
    line3.Top = 100;
    line3.Left = 200;

    // Add a curved double-arrow connector
    line2 = sheet.TypedLines.AddLine();
    line2.LineShapeType = xlsModule.LineShapeType.CurveLine;
    line2.Width = 30;
    line2.Height = 50;
    line2.EndArrowHeadStyle = xlsModule.ShapeArrowStyleType.LineArrowOpen;
    line2.BeginArrowHeadStyle = xlsModule.ShapeArrowStyleType.LineArrowOpen;
    line2.Left = 250;
    line2.Top = 100;

    // Save the workbook
    const outputFileName = 'AddArrowLines.xlsx';
    workbook.SaveToFile({ fileName: outputFileName, version: xlsModule.ExcelVersion.Version2010 });

    // Release resources
    workbook.Dispose();

    // Read the saved file from the VFS and trigger the download
    const fileArray = window.dotnetRuntime.Module.FS.readFile(outputFileName);
    const blob = new Blob([fileArray], { type: 'application/vnd.openxmlformats-officedocument.spreadsheetml.sheet' });
    const url = URL.createObjectURL(blob);
    const a = document.createElement('a');
    a.href = url;
    a.download = outputFileName;
    a.click();
    URL.revokeObjectURL(url);
  };

  return (
    <div style={{ textAlign: 'center', height: '300px' }}>
      <h1>Add Arrow Lines</h1>
      <button onClick={addArrowLines}>Start</button>
    </div>
  );
}

export default App;
Six arrow-tipped lines: double-arrow, single-arrow, elbow arrow, elbow double-arrow, curved arrow, and curved double-arrow
Note the reuse of the line3 and line2 variables in the second half of the function. Each call to TypedLines.AddLine() returns a new line object that has already been added to the worksheet — the variable is a handle for setting properties, not a container that needs to be preserved. Reusing the variable name for the next line is safe because the previous line is already committed to the sheet's shape collection.
Managing existing lines
A worksheet that already contains lines — whether added by your code, imported from a file, or drawn by a user — exposes them through the sheet.Shapes collection. Each shape can be retrieved by index and modified through its properties:
// Get the first shape in the worksheet
let shape = sheet.Shapes.get(0);
// Modify its properties — color, dash style, etc.
shape.Color = xlsModule.Color.get_Red();
For deletion, sheet.Shapes.Remove(index) removes the shape at the specified index. To remove lines selectively — by name, by type, or by position — iterate the collection and remove matching shapes. Remove from the last index downward when deleting in a loop, since removing an element shifts the indices of all elements after it.
Common issues
The arrowhead is not showing.
BeginArrowHeadStyle or EndArrowHeadStyle was not set, or was set to LineNoArrow. Check which end you expect the arrow on and assign the corresponding property. A line with neither property set has no arrows at either end.
The line appears in the wrong position.
Top and Left are in pixels, not rows and columns. A value of Top = 10 places the line 10 pixels from the top of the sheet, not on row 10. If you are used to the Lines.AddLine() API, this is the most common source of misplacement.
The elbow connector bends in the wrong direction.
The bend direction depends on the signs and relative magnitudes of Width and Height. A positive Width with a positive Height bends down-right. Swap the sign or exchange the two values to change the bend. Test with small values first.
The curved line does not curve the way I expected.
A CurveLine through TypedLines draws a smooth arc between the start and end points, and the arc's shape is influenced by Width and Height. Unlike an elbow connector, which has a single right-angle bend, a curve is continuous — but its exact path depends on the dimensions, so verify the output before relying on it for a precise layout.
FAQ
What is the difference between LineArrow and LineArrowOpen?
LineArrow draws a filled triangular arrowhead. LineArrowOpen draws an open V-shaped arrowhead — two strokes without a fill. The open style is common in data-flow and entity-relationship diagrams where the arrow indicates direction without implying a specific mechanism.
Can I set different arrow styles on the two ends?
Yes. BeginArrowHeadStyle and EndArrowHeadStyle are independent properties. A line with LineArrow on one end and LineArrowOpen on the other is valid and communicates that one direction is definite while the other is tentative.
How do pixel coordinates relate to the worksheet layout?
Pixel coordinates are measured from the top-left corner of the worksheet. Row heights and column widths in Excel are measured in points and characters respectively, so converting between cell positions and pixel coordinates requires accounting for the current row heights and column widths. For lines that need to align with cell boundaries, Lines.AddLine() with row and column parameters may be simpler.
Can I mix Lines.AddLine() and TypedLines.AddLine() in the same worksheet?
Yes. Both APIs add shapes to the same worksheet's shape collection. A worksheet can contain basic line shapes and arrow-tipped lines simultaneously.
Does this require Excel to be installed?
No. The engine runs as WebAssembly in the browser. Lines and arrows are written as standard shape objects in the worksheet XML, and Excel renders them natively when the file is opened.
See Also
Insert Line Shapes in Excel in JavaScript (React)
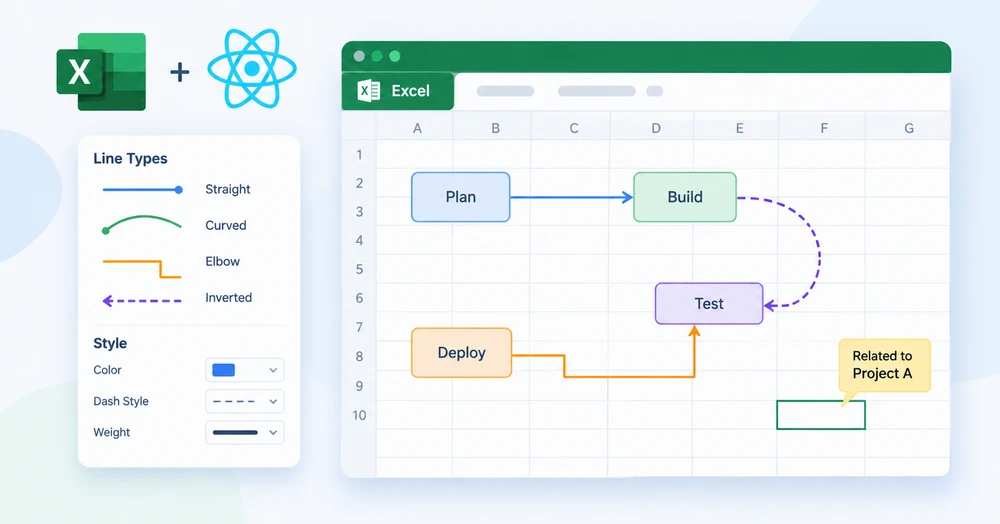
A worksheet is not always just a grid of numbers. Sometimes it is a canvas — a flowchart sketched between data blocks, a relationship diagram connecting teams to projects, a callout pointing from a note to the cell it annotates. In every one of these cases the missing element is a line: a straight stroke between two boxes, a curved arc around a region, an elbow connector that bends once and continues.
Spire.XLS for JavaScript gives a React app the sheet.Lines.AddLine() method for inserting line shapes at a specified position, with four line types available through the LineShapeType enum and full control over dash style, color, and weight. Everything runs in the browser on WebAssembly — no backend, no Excel automation, no file upload.
For project setup, see Integrating Spire.XLS for JavaScript in a React Project. The examples below assume the package is installed and the WebAssembly module has been initialized.
When a worksheet needs lines
Lines in a worksheet serve three broad purposes, and the line type you reach for depends on which one is in front of you:
| Scenario | What the line does | Typical line type |
|---|---|---|
| Flowchart between data blocks | Connects a process step to the next, sometimes with a bend | Straight or elbow |
| Relationship diagram | Links entities that are not aligned in a grid | Curved |
| Region boundary or divider | Separates one area of the sheet from another | Straight |
| Callout or annotation pointer | Draws attention from a label to a cell | Straight with an arrowhead |
The arrowhead case — where the line needs to show direction — uses a different API, TypedLines.AddLine(), which supports arrow styles on both ends and pixel-precise positioning. That is covered separately in Add Arrow Connectors in Excel in JavaScript (React). This article focuses on Lines.AddLine(), which handles the four core line shapes and their visual styling.
Prerequisites
You need a React project with Spire.XLS for JavaScript installed and the WebAssembly module initialized, reachable at window.wasmModule.spirexls. The sample loads a font into the VFS for text measurement and saves with the Excel 2010 version flag.
The four line types
LineShapeType exposes four shapes, and the difference between them is geometric — how the line travels from its start to its end:
LineShapeType value |
Shape | What it looks like | Reach for it when |
|---|---|---|---|
Line |
Straight line | A single stroke from start to end | Connecting two points on the same row or column |
CurveLine |
Curved line | A smooth arc between start and end | Routing around other content, or showing a non-linear relationship |
ElbowLine |
Elbow connector | A line that bends once at a right angle | Flowchart steps that are not directly aligned |
LineInv |
Inverted line | A straight line with inverted orientation | Mirror layouts or right-to-left diagrams |
All four are created by the same method — sheet.Lines.AddLine() — with the lineShapeType parameter selecting which one is drawn. The appearance properties (DashStyle, Color, Weight) apply to all four uniformly.
Insert lines into a worksheet
The example inserts one of each line type into a fresh worksheet, each with a distinct dash style and color so the four shapes are distinguishable in the output. The steps are:
- Create a
Workbookobject and get the first worksheet. - Call
Worksheet.Lines.AddLine()four times, passing position parameters and a differentLineShapeTypeeach time. - Customize each line's
DashStyle,Color, andWeight. - Save the workbook with
Workbook.SaveToFile().
function App() {
  const addLineShapes = async () => {
    // Get the Spire.XLS WASM module
    const xlsModule = window.wasmModule?.spirexls;

    // Check whether the module is ready
    if (!xlsModule) {
      alert('Spire.Xls is not ready yet');
      return;
    }

    // Load the font into the VFS for text measurement and column auto-fit
    await window.spire.FetchFileToVFS('ARIAL.TTF', '/Library/Fonts/', `${process.env.PUBLIC_URL}/font/`);

    // Create a new workbook and get the first worksheet
    const workbook = new xlsModule.Workbook();
    const sheet = workbook.Worksheets.get(0);

    // Add a straight line - solid, CadetBlue, weight 2, with arrow
    let line1 = sheet.Lines.AddLine({ row: 10, column: 2, width: 200, height: 1, lineShapeType: xlsModule.LineShapeType.Line });
    line1.DashStyle = xlsModule.ShapeDashLineStyleType.Solid;
    line1.Color = xlsModule.Color.get_CadetBlue();
    line1.Weight = 2;
    line1.EndArrowHeadStyle = xlsModule.ShapeArrowStyleType.LineArrow;

    // Add a curved line - dotted, OrangeRed, weight 2
    let line2 = sheet.Lines.AddLine({ row: 12, column: 2, width: 200, height: 1, lineShapeType: xlsModule.LineShapeType.CurveLine });
    line2.DashStyle = xlsModule.ShapeDashLineStyleType.Dotted;
    line2.Color = xlsModule.Color.get_OrangeRed();
    line2.Weight = 2;

    // Add an elbow connector - DashDotDot, Purple, weight 2
    let line3 = sheet.Lines.AddLine({ row: 14, column: 2, width: 200, height: 1, lineShapeType: xlsModule.LineShapeType.ElbowLine });
    line3.DashStyle = xlsModule.ShapeDashLineStyleType.DashDotDot;
    line3.Color = xlsModule.Color.get_Purple();
    line3.Weight = 2;

    // Add an inverted line - Dashed, Green, weight 2
    let line4 = sheet.Lines.AddLine({ row: 16, column: 2, width: 200, height: 1, lineShapeType: xlsModule.LineShapeType.LineInv });
    line4.DashStyle = xlsModule.ShapeDashLineStyleType.Dashed;
    line4.Color = xlsModule.Color.get_Green();
    line4.Weight = 2;

    // Save the workbook
    const outputFileName = 'AddLineShapes.xlsx';
    workbook.SaveToFile({ fileName: outputFileName, version: xlsModule.ExcelVersion.Version2010 });

    // Release resources
    workbook.Dispose();

    // Read the saved file from the VFS and trigger the download
    const fileArray = window.dotnetRuntime.Module.FS.readFile(outputFileName);
    const blob = new Blob([fileArray], { type: 'application/vnd.openxmlformats-officedocument.spreadsheetml.sheet' });
    const url = URL.createObjectURL(blob);
    const a = document.createElement('a');
    a.href = url;
    a.download = outputFileName;
    a.click();
    URL.revokeObjectURL(url);
  };

  return (
    <div style={{ textAlign: 'center', height: '300px' }}>
      <h1>Add Line Shapes</h1>
      <button onClick={addLineShapes}>Start</button>
    </div>
  );
}

export default App;
Four line types inserted into a worksheet: straight, curved, elbow, and inverted

The first line also sets EndArrowHeadStyle, which gives it an arrowhead at the end — Lines.AddLine() supports a single arrow style on the end, but not on the beginning. For arrows on both ends or pixel-precise positioning, use TypedLines.AddLine() instead, covered in Add Arrow Connectors in Excel in JavaScript (React).
Customizing line appearance
Three properties control how a line looks, and they are independent — changing one does not reset the others:
| Property | What it controls | Example values |
|---|---|---|
DashStyle |
The dash pattern of the stroke | Solid, Dotted, Dashed, DashDotDot |
Color |
The stroke color | Any xlsModule.Color.get_*() value |
Weight |
The stroke thickness, in points | 1, 2, 3 — higher is thicker |
The dash style is the one worth experimenting with. A solid line reads as a permanent connection; a dotted line reads as a tentative or optional one; a dashed line reads as a boundary. In a flowchart where some connections are conditional, using Solid for the main flow and Dashed for the conditional branches communicates the distinction without a legend.
Positioning by row and column
Lines.AddLine() places a line using row and column coordinates, plus a width and height:
sheet.Lines.AddLine({ row: 10, column: 2, width: 200, height: 1, lineShapeType: xlsModule.LineShapeType.Line });
rowandcolumnset the anchor point — where the line starts.widthsets the horizontal extent in pixels.heightsets the vertical extent in pixels. A height of1produces a horizontal line; a width of1produces a vertical one.
This is a hybrid system: the anchor is in spreadsheet units (rows and columns), but the size is in pixels. That makes it straightforward to align a line with a specific cell — pass that cell's row and column — but the length needs to account for column widths and row heights, which vary. If you need full pixel control over the start position as well as the size, TypedLines.AddLine() offers Top and Left in pixels.
Common issues
The line is not visible in the output.
Check Weight and Color. A weight of 0 or a color that matches the background produces an invisible line. Also verify that row and column place the line within the used range of the worksheet — a line anchored at row 1000 on an empty sheet is drawn but off-screen.
The arrowhead is missing.
EndArrowHeadStyle was not set, or was set to LineNoArrow. Assign ShapeArrowStyleType.LineArrow to show an arrowhead at the end of the line. Lines.AddLine() does not support BeginArrowHeadStyle — for arrows on both ends, use TypedLines.AddLine().
The elbow line goes in an unexpected direction.
An elbow connector bends once, and the direction of the bend depends on the width and height values. A positive width with a positive height bends down-right; changing the sign of either value changes the bend direction. Experiment with small values first to confirm the shape before committing to a large layout.
Lines overlap or stack on top of each other.
Each call to AddLine creates an independent shape at the specified position. If two lines share the same row and column, they overlap. Offset the row value by 2 or more for each successive line, as the example does.
FAQ
What is the difference between Lines.AddLine() and TypedLines.AddLine()?
Lines.AddLine() positions by row and column and supports an arrowhead on the end only. TypedLines.AddLine() positions by pixel coordinates and supports arrowheads on both ends. For basic line shapes without directional arrows, Lines.AddLine() is simpler. For connectors that need precise placement or bidirectional arrows, see Add Arrow Connectors in Excel in JavaScript (React).
Can I create a vertical line?
Yes. Set width to 1 and height to a positive value. The line extends downward from the anchor point.
How many lines can a single worksheet hold?
There is no hard limit in the API. Each line is a shape object stored in the worksheet's shapes collection, and the practical constraint is file size and rendering performance when hundreds of shapes are present.
Do the lines survive if the file is opened in Excel?
Yes. Lines are stored as standard shape objects in the worksheet XML. Excel reads and renders them natively — they are not a rendering artifact specific to Spire.XLS.
Can I retrieve and modify lines that already exist in a workbook?
Yes. Traverse the sheet.Shapes collection to access line shape objects, then modify their properties through the ILineShape interface. For deletion, use sheet.Shapes.Remove(index).