Haz que los datos de Excel sean visuales con formato condicional en JavaScript
Tabla de contenido
- Por qué no basta con añadir un gráfico
- Requisitos previos
- Una API, tres visualizaciones
- Barras de datos: la magnitud de un vistazo
- Escalas de color: mapas de calor sin un gráfico
- Conjuntos de iconos: bandas de estado
- Elegir entre las tres opciones
- Personalizar la apariencia de las barras de datos
- Problemas comunes
- Preguntas frecuentes
- Véase también
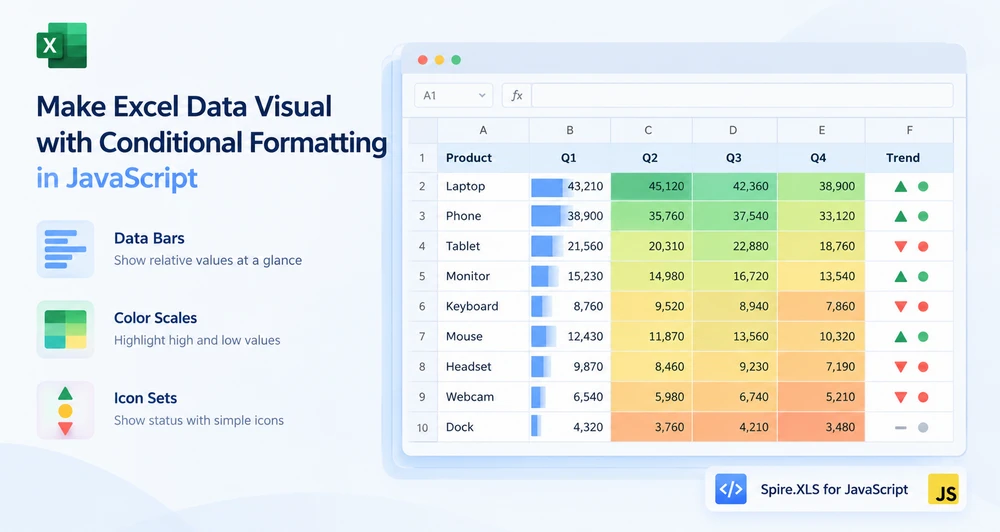
Una tabla de ventas con veinte columnas de números es precisa e ilegible. El ojo no puede comparar 43.210 con 38.900 a lo largo de una fila con la suficiente rapidez para encontrar el trimestre débil, y quien lee el informe lo sabe, por eso pide un gráfico. Pero un gráfico por columna significa veinte gráficos, y ahora la hoja de cálculo es una galería en lugar de una tabla.
Las barras de datos, las escalas de color y los conjuntos de iconos resuelven esto dentro de las propias celdas. Una barra crece en proporción al valor. Un color pasa de pálido a saturado a medida que el número aumenta. Un icono cambia de forma cuando el valor cruza un umbral. Ninguno de ellos añade filas, columnas u objetos flotantes: la visualización se asienta en la celda que ya contiene el número. Los tres son formas de formato condicional de Excel, y Spire.XLS for JavaScript los aplica a través de una única API en el navegador sobre WebAssembly, con los archivos circulando por un sistema de archivos virtual (VFS) y sin necesidad de backend.
Para la configuración del proyecto, consulte Integrar Spire.XLS for JavaScript en un proyecto de React. Los ejemplos siguientes presuponen que el paquete está instalado y que el módulo de WebAssembly se ha inicializado.
Por qué no basta con añadir un gráfico
Los gráficos y la visualización dentro de la celda responden a la misma pregunta —"¿cómo se comparan estos valores?"—, pero encajan en momentos diferentes:
| Gráficos | Visualización dentro de la celda | |
|---|---|---|
| Espacio | Flota sobre la hoja de cálculo, ocupa un área rectangular | Vive dentro de las celdas que ya contienen los datos |
| Densidad | Un gráfico por conjunto de datos; varios gráficos abarrotan la hoja | Un formato por rango; docenas de columnas pueden mostrar indicios simultáneamente |
| Detalle | Muestra ejes, líneas de división y etiquetas: una representación completa | Muestra solo el indicio: una barra, un color, un icono |
| Ideal para | Presentaciones, informes, visualizaciones independientes | Escanear una tabla, detectar valores atípicos, comparar entre muchas columnas |
Cuando el objetivo es hacer que una tabla de números se pueda escanear sin rehacer el diseño, la visualización dentro de la celda es la herramienta más ligera. Las tres secciones siguientes abordan cada tipo, y comparten más API de lo que difieren, que es lo primero que conviene saber.
Requisitos previos
Necesita un proyecto de React con Spire.XLS for JavaScript instalado y el módulo de WebAssembly inicializado, accesible en window.wasmModule.spirexls. El ejemplo carga una fuente y un archivo de datos de ventas en el VFS, y guarda con la marca de versión de Excel 2010, que es la versión más antigua que admite estos tipos de formato condicional.
Una API, tres visualizaciones
Los tres tipos siguen la misma cadena de llamadas. La única línea que cambia es la asignación de FormatType:
sheet.ConditionalFormats.Add() → xcfs.AddRange(range) → format = xcfs.AddCondition() → format.FormatType = ???
| Visualización | Valor de FormatType |
Configuración adicional |
|---|---|---|
| Barras de datos | ConditionalFormatType.DataBar |
DataBar.BarColor para el color de relleno |
| Escalas de color | ConditionalFormatType.ColorScale |
Ninguna: por defecto usa un degradado de dos colores |
| Conjuntos de iconos | ConditionalFormatType.IconSet |
IconSet.IconSetType para el estilo del icono |
La cadena compartida es la razón por la que los tres ejemplos de código siguientes se parecen: son la misma operación con un tipo de formato distinto. Las diferencias están en lo que produce cada tipo y en cuándo recurriríamos a él, que es lo que aborda la tabla comparativa que aparece más adelante en este artículo.
Barras de datos: la magnitud de un vistazo
Una barra de datos dibuja una banda horizontal de color dentro de cada celda, y la longitud de la banda es proporcional al valor de la celda en relación con el resto del rango seleccionado. El valor más alto llena la celda; el más bajo llena apenas una franja. Escanear una fila de barras de datos es la misma operación mental que escanear un gráfico de barras, salvo que los números permanecen visibles debajo.
Los pasos son:
- Cargue la fuente y el archivo de datos de prueba en el VFS.
- Cargue el libro y obtenga la hoja de cálculo.
- Llame a
ConditionalFormats.Addpara crear un formato condicional y vincule el rango de datos conAddRange. - Llame a
AddConditionpara añadir una condición, establezcaFormatTypeenDataBary defina el color de la barra. - Guarde el libro.
function App() {
  const applyDataBars = async () => {
    // Get the Spire.XLS WASM module
    const xlsModule = window.wasmModule?.spirexls;

    // Check whether the module is ready
    if (!xlsModule) {
      alert('Spire.Xls is not ready yet');
      return;
    }

    // Load the font and the test data file into the VFS
    await window.spire.FetchFileToVFS('ARIAL.TTF', '/Library/Fonts/', `${process.env.PUBLIC_URL}/font/`);
    const inputFileName = 'SalesData.xlsx';
    await window.spire.FetchFileToVFS(inputFileName, '', `${process.env.PUBLIC_URL}data/`);

    // Load the workbook and get the first worksheet
    const workbook = new xlsModule.Workbook();
    workbook.LoadFromFile({ fileName: inputFileName });
    const sheet = workbook.Worksheets.get(0);

    // Select the data range that receives the data bars
    const dataRange = sheet.Range.get("B2:E9");

    // Create a conditional format and bind it to that range
    const xcfs = sheet.ConditionalFormats.Add();
    xcfs.AddRange(dataRange);

    // Add a data bar condition and set the bar color
    const format = xcfs.AddCondition();
    format.FormatType = xlsModule.ConditionalFormatType.DataBar;
    format.DataBar.BarColor = xlsModule.Color.get_CadetBlue();

    // Save the workbook
    const outputFileName = "ApplyDataBars.xlsx";
    workbook.SaveToFile({ fileName: outputFileName, version: xlsModule.ExcelVersion.Version2010 });

    // Dispose of the workbook object to free resources
    workbook.Dispose();

    // Read the result file from the VFS and trigger the download
    const fileArray = window.dotnetRuntime.Module.FS.readFile(outputFileName);
    const blob = new Blob([fileArray], { type: 'application/vnd.openxmlformats-officedocument.spreadsheetml.sheet' });
    const url = URL.createObjectURL(blob);
    const a = document.createElement('a');
    a.href = url;
    a.download = outputFileName;
    a.click();
    URL.revokeObjectURL(url);
  };

  return (
    <div style={{ textAlign: 'center', height: '300px' }}>
      <h1>Apply Data Bars</h1>
      <button onClick={applyDataBars}>Start</button>
    </div>
  );
}

export default App;
Barras de datos aplicadas a una tabla de cifras de ventas, con la longitud de la barra proporcional al valor de la celda
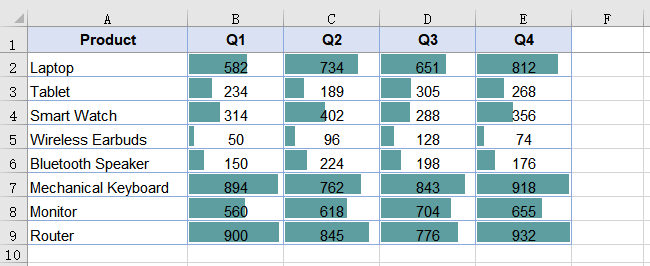
Solo las celdas numéricas reciben barras; las celdas de texto dentro del rango se omiten. Esto es lo esperado: una barra de datos expresa una magnitud relativa, y el texto no tiene magnitud que expresar. Mantenga el rango limitado al área numérica; incluir una columna de nombres de producto o una fila de encabezados no provoca ningún error, pero esas celdas no mostrarán nada.
Escalas de color: mapas de calor sin un gráfico
Una escala de color sombrea cada celda según dónde se sitúe su valor entre el mínimo y el máximo del rango. No se requieren argumentos de color: cuando no se especifica ninguno, el resultado es una escala de dos colores que toma naranja en el mínimo y amarillo pálido en el máximo, con los valores intermedios sombreados de forma proporcional. El efecto es un mapa de calor integrado en la tabla de datos: los puntos calientes y fríos se ven sin necesidad de ordenar ni de crear un gráfico.
Los pasos son los mismos que para las barras de datos, con FormatType establecido en ColorScale y sin propiedades adicionales:
- Cargue la fuente y el archivo de datos de prueba en el VFS.
- Cargue el libro y obtenga la hoja de cálculo.
- Llame a
ConditionalFormats.Addpara crear un formato condicional y vincule el rango de datos conAddRange. - Llame a
AddConditionpara añadir una condición y establezcaFormatTypeenColorScale. - Guarde el libro.
function App() {
  const applyColorScales = async () => {
    // Get the Spire.XLS WASM module
    const xlsModule = window.wasmModule?.spirexls;

    // Check whether the module is ready
    if (!xlsModule) {
      alert('Spire.Xls is not ready yet');
      return;
    }

    // Load the font and the test data file into the VFS
    await window.spire.FetchFileToVFS('ARIAL.TTF', '/Library/Fonts/', `${process.env.PUBLIC_URL}/font/`);
    const inputFileName = 'SalesData.xlsx';
    await window.spire.FetchFileToVFS(inputFileName, '', `${process.env.PUBLIC_URL}data/`);

    // Load the workbook and get the first worksheet
    const workbook = new xlsModule.Workbook();
    workbook.LoadFromFile({ fileName: inputFileName });
    const sheet = workbook.Worksheets.get(0);

    // Select the data range that receives the color scales
    const dataRange = sheet.Range.get("B2:E9");

    // Create a conditional format and bind it to that range
    const xcfs = sheet.ConditionalFormats.Add();
    xcfs.AddRange(dataRange);

    // Add a color scale condition; colors transition with the values
    const format = xcfs.AddCondition();
    format.FormatType = xlsModule.ConditionalFormatType.ColorScale;

    // Save the workbook
    const outputFileName = "ApplyColorScales.xlsx";
    workbook.SaveToFile({ fileName: outputFileName, version: xlsModule.ExcelVersion.Version2010 });

    // Dispose of the workbook object to free resources
    workbook.Dispose();

    // Read the result file from the VFS and trigger the download
    const fileArray = window.dotnetRuntime.Module.FS.readFile(outputFileName);
    const blob = new Blob([fileArray], { type: 'application/vnd.openxmlformats-officedocument.spreadsheetml.sheet' });
    const url = URL.createObjectURL(blob);
    const a = document.createElement('a');
    a.href = url;
    a.download = outputFileName;
    a.click();
    URL.revokeObjectURL(url);
  };

  return (
    <div style={{ textAlign: 'center', height: '300px' }}>
      <h1>Apply Color Scales</h1>
      <button onClick={applyColorScales}>Start</button>
    </div>
  );
}

export default App;
Escalas de color aplicadas a una tabla de cifras de ventas, con un sombreado de naranja a amarillo pálido
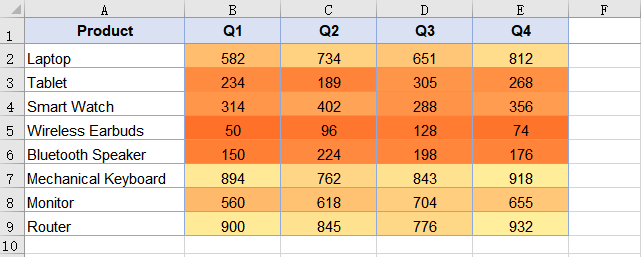
Mientras que las barras de datos muestran la magnitud absoluta mediante la longitud de la barra, las escalas de color muestran la posición relativa mediante el tono. Un valor situado en la mitad del rango recibe un tono medio independientemente de si el rango abarca de 1 a 100 o de 10.000 a 50.000: el sombreado es posicional, no absoluto.
Conjuntos de iconos: bandas de estado
Un conjunto de iconos coloca un icono distinto en cada celda según la banda en la que se sitúe el valor. El ejemplo utiliza tres semáforos: rojo para el tercio más bajo, amarillo para el intermedio y verde para el más alto. A diferencia de las barras de datos y las escalas de color, que comunican un degradado continuo, los conjuntos de iconos comunican una categoría discreta —"esto es bajo", "esto es medio", "esto es alto"—, lo que se acerca más a un indicador de estado que a una medición.
Los pasos solo se diferencian en el FormatType y en la selección del estilo de icono:
- Cargue la fuente y el archivo de datos de prueba en el VFS.
- Cargue el libro y obtenga la hoja de cálculo.
- Llame a
ConditionalFormats.Addpara crear un formato condicional y vincule el rango de datos conAddRange. - Llame a
AddConditionpara añadir una condición, establezcaFormatTypeenIconSety especifique el tipo de conjunto de iconos. - Guarde el libro.
function App() {
  const applyIconSets = async () => {
    // Get the Spire.XLS WASM module
    const xlsModule = window.wasmModule?.spirexls;

    // Check whether the module is ready
    if (!xlsModule) {
      alert('Spire.Xls is not ready yet');
      return;
    }

    // Load the font and the test data file into the VFS
    await window.spire.FetchFileToVFS('ARIAL.TTF', '/Library/Fonts/', `${process.env.PUBLIC_URL}/font/`);
    const inputFileName = 'SalesData.xlsx';
    await window.spire.FetchFileToVFS(inputFileName, '', `${process.env.PUBLIC_URL}data/`);

    // Load the workbook and get the first worksheet
    const workbook = new xlsModule.Workbook();
    workbook.LoadFromFile({ fileName: inputFileName });
    const sheet = workbook.Worksheets.get(0);

    // Select the data range that receives the icon sets
    const dataRange = sheet.Range.get("B2:E9");

    // Create a conditional format and bind it to that range
    const xcfs = sheet.ConditionalFormats.Add();
    xcfs.AddRange(dataRange);

    // Add an icon set condition and set the icon style to three traffic lights
    const format = xcfs.AddCondition();
    format.FormatType = xlsModule.ConditionalFormatType.IconSet;
    format.IconSet.IconSetType = xlsModule.IconSetType.ThreeTrafficLights1;

    // Save the workbook
    const outputFileName = "ApplyIconSets.xlsx";
    workbook.SaveToFile({ fileName: outputFileName, version: xlsModule.ExcelVersion.Version2010 });

    // Dispose of the workbook object to free resources
    workbook.Dispose();

    // Read the result file from the VFS and trigger the download
    const fileArray = window.dotnetRuntime.Module.FS.readFile(outputFileName);
    const blob = new Blob([fileArray], { type: 'application/vnd.openxmlformats-officedocument.spreadsheetml.sheet' });
    const url = URL.createObjectURL(blob);
    const a = document.createElement('a');
    a.href = url;
    a.download = outputFileName;
    a.click();
    URL.revokeObjectURL(url);
  };

  return (
    <div style={{ textAlign: 'center', height: '300px' }}>
      <h1>Apply Icon Sets</h1>
      <button onClick={applyIconSets}>Start</button>
    </div>
  );
}

export default App;
Conjuntos de iconos aplicados a una tabla de cifras de ventas, con iconos de semáforo según las bandas de valores
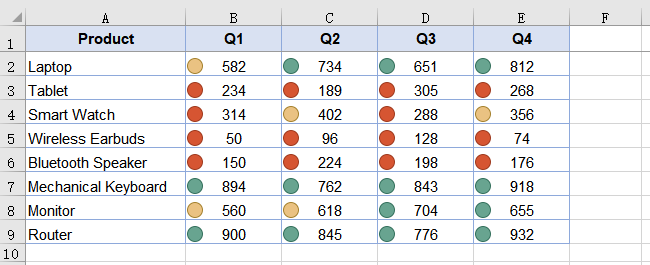
Un conjunto de iconos divide el rango en bandas, por lo que el mismo icono abarca un intervalo distinto de valores en rangos diferentes. En un rango de 10 a 90, el icono verde abarca aproximadamente de 60 a 90; en un rango de 10 a 900, abarca aproximadamente de 600 a 900. Las bandas son relativas, no absolutas, lo cual es el valor predeterminado adecuado para una tabla en la que cada columna tiene su propia escala, pero conviene saberlo si espera un umbral fijo.
Elegir entre las tres opciones
Las tres se aplican a un rango, las tres viven dentro de las celdas y las tres son formato condicional. La elección depende de lo que el lector necesite hacer con los números:
| El lector necesita | Usar | Porque |
|---|---|---|
| Comparar magnitudes en una fila o columna | Barras de datos | La longitud de la barra es el indicio visual más preciso de "cuánto" |
| Detectar puntos calientes y fríos en una tabla grande | Escalas de color | La intensidad del color se percibe de forma periférica incluso cuando la vista no se centra en una celda concreta |
| Clasificar valores en unas pocas categorías de estado | Conjuntos de iconos | Los iconos discretos se corresponden con decisiones discretas: "esto requiere atención", "esto está bien" |
| Ver todo lo anterior a la vez | Combinar en rangos diferentes | Cada formato condicional es independiente; aplique barras de datos a un rango y conjuntos de iconos a otro |
Los tres no son mutuamente excluyentes. Una hoja de cálculo puede llevar barras de datos en las columnas de ingresos y conjuntos de iconos en la columna de tasa de crecimiento en la misma operación de guardado, porque cada llamada a ConditionalFormats.Add crea un formato independiente vinculado a su propio rango.
Personalizar la apariencia de las barras de datos
El color de relleno de una barra de datos proviene de DataBar.BarColor. Establecer solo FormatType sin BarColor da como resultado el azul predeterminado. También hay disponible un borde, pero tiene una dependencia: el tipo de borde debe establecerse antes de que el color del borde surta efecto.
// Set the border type first so that the border color takes effect
format.DataBar.BarBorder.Type = xlsModule.DataBarBorderType.DataBarBorderSolid;
format.DataBar.BarBorder.Color = xlsModule.Color.get_Red();

// Fill color of the bar
format.DataBar.BarColor = xlsModule.Color.get_GreenYellow();
Establecer BarBorder.Color por sí solo, sin definir antes BarBorder.Type, no tiene ningún efecto: el borde no se dibuja porque no se ha declarado ningún tipo de borde. Las escalas de color y los conjuntos de iconos no tienen propiedades de apariencia equivalentes; su estilo viene determinado por el tipo de formato y, en el caso de los conjuntos de iconos, por la enumeración IconSetType.
Problemas comunes
Las celdas de texto del rango de destino no muestran barras de datos. Esto es lo esperado. Una barra de datos expresa una magnitud relativa, y solo las celdas numéricas tienen magnitud. Las celdas de texto se omiten de forma silenciosa: sin error y sin barra. Mantenga el rango limitado al área numérica.
Todas las barras de datos son del azul predeterminado.
No se estableció DataBar.BarColor después de asignar FormatType. Establézcalo con cualquier valor de xlsModule.Color para cambiar el relleno.
No se muestra el color del borde de la barra de datos.
No se estableció primero el tipo de borde. Asigne DataBar.BarBorder.Type antes de DataBar.BarBorder.Color: el color solo surte efecto una vez declarado un tipo de borde sólido.
No hay ningún cambio visible tras aplicar un formato condicional.
Compruebe que el rango pasado a AddRange coincide con el lugar donde están realmente los datos. Un rango que apunta a celdas vacías no produce ningún error ni ningún resultado visible.
Preguntas frecuentes
¿Puedo aplicar más de un formato condicional al mismo rango?
Sí. Cada llamada a ConditionalFormats.Add crea un formato independiente. Dos formatos pueden tener como destino el mismo rango, aunque el resultado visual de superponer una barra de datos y una escala de color en las mismas celdas puede resultar confuso; normalmente es más claro aplicar tipos distintos a rangos distintos.
¿Qué versiones de Excel admiten estos tipos de formato condicional?
Las barras de datos, las escalas de color y los conjuntos de iconos se introdujeron en Excel 2007. El ejemplo guarda con ExcelVersion.Version2010 para garantizar la compatibilidad tanto con Excel 2010 como con versiones posteriores.
¿Necesito tener Excel instalado para aplicar formato condicional?
No. El motor de hojas de cálculo viene incluido en el paquete y se ejecuta como WebAssembly en el navegador. El formato condicional se escribe como XML estándar dentro del archivo .xlsx, y Excel lo representa al abrir el archivo.
¿Puedo establecer umbrales personalizados para los conjuntos de iconos?
La enumeración IconSetType selecciona un estilo de icono predefinido con límites de banda predefinidos. El ejemplo utiliza ThreeTrafficLights1, que divide el rango en tres bandas iguales.
¿Sobrevive el formato condicional si el archivo se abre y se vuelve a guardar en Excel?
Sí. El formato condicional forma parte de las reglas de formato almacenadas en la hoja de cálculo, no es un artefacto de representación. Excel lee, conserva y vuelve a aplicar las mismas reglas al recalcular.
Véase también
Excel-Daten mit bedingter Formatierung in JavaScript visualisieren
Inhaltsverzeichnis
Eine Verkaufstabelle mit zwanzig Zahlenspalten ist korrekt und unlesbar. Das Auge kann 43.210 nicht schnell genug mit 38.900 über eine Zeile hinweg vergleichen, um das schwache Quartal zu finden, und die Person, die den Bericht liest, weiß das – deshalb bittet sie um ein Diagramm. Aber ein Diagramm pro Spalte bedeutet zwanzig Diagramme, und schon ist das Arbeitsblatt eine Galerie statt einer Tabelle.
Datenbalken, Farbskalen und Symbolsätze lösen dies innerhalb der Zellen selbst. Ein Balken wächst proportional zum Wert. Eine Farbe verschiebt sich von blass zu gesättigt, wenn die Zahl steigt. Ein Symbol ändert seine Form, wenn der Wert eine Schwelle überschreitet. Keine davon fügt Zeilen, Spalten oder schwebende Objekte hinzu – die Visualisierung sitzt in der Zelle, die bereits die Zahl enthält. Alle drei sind Formen der bedingten Formatierung von Excel, und Spire.XLS for JavaScript wendet sie über eine einzige API im Browser auf WebAssembly an, wobei Dateien durch ein virtuelles Dateisystem (VFS) wandern und kein Backend erforderlich ist.
Zur Projekteinrichtung siehe Integrating Spire.XLS for JavaScript in a React Project. Die folgenden Beispiele gehen davon aus, dass das Paket installiert und das WebAssembly-Modul initialisiert wurde.
Warum nicht einfach ein Diagramm hinzufügen
Diagramme und In-Cell-Visualisierungen beantworten dieselbe Frage – „Wie lassen sich diese Werte vergleichen?“ –, passen aber zu unterschiedlichen Momenten:
| Diagramme | Visualisierung in der Zelle | |
|---|---|---|
| Platzbedarf | Schwebt über dem Arbeitsblatt und belegt einen rechteckigen Bereich | Befindet sich in den Zellen, die bereits die Daten enthalten |
| Dichte | Ein Diagramm pro Datensatz; mehrere Diagramme überfüllen das Blatt | Ein Format pro Bereich; Dutzende Spalten können gleichzeitig Hinweise tragen |
| Detailgrad | Zeigt Achsen, Gitternetzlinien, Beschriftungen – eine vollständige Darstellung | Zeigt nur den Hinweis: einen Balken, eine Farbe, ein Symbol |
| Am besten für | Präsentationen, Berichte, eigenständige Darstellungen | Das Überfliegen einer Tabelle, das Erkennen von Ausreißern, der Vergleich über viele Spalten hinweg |
Wenn das Ziel darin besteht, eine Zahlentabelle ohne Umbau des Layouts überfliegbar zu machen, ist die In-Cell-Visualisierung das leichtere Werkzeug. Die drei folgenden Abschnitte behandeln jeweils einen Typ, und sie teilen mehr API, als sie sich unterscheiden – was das Erste ist, das man wissen sollte.
Voraussetzungen
Sie benötigen ein React-Projekt mit installiertem Spire.XLS for JavaScript und initialisiertem WebAssembly-Modul, erreichbar unter window.wasmModule.spirexls. Das Beispiel lädt eine Schriftart und eine Verkaufsdatendatei in das VFS und speichert mit dem Versionsflag für Excel 2010, der frühesten Version, die diese Typen der bedingten Formatierung unterstützt.
Eine API, drei Visualisierungen
Alle drei Typen folgen derselben Aufrufkette. Die einzige Zeile, die sich ändert, ist die Zuweisung von FormatType:
sheet.ConditionalFormats.Add() → xcfs.AddRange(range) → format = xcfs.AddCondition() → format.FormatType = ???
| Visualisierung | FormatType-Wert |
Zusätzliche Einrichtung |
|---|---|---|
| Datenbalken | ConditionalFormatType.DataBar |
DataBar.BarColor für die Füllfarbe |
| Farbskalen | ConditionalFormatType.ColorScale |
Keine – standardmäßig ein zweifarbiger Farbverlauf |
| Symbolsätze | ConditionalFormatType.IconSet |
IconSet.IconSetType für den Symbolstil |
Die gemeinsame Aufrufkette ist der Grund, warum die drei Codebeispiele unten ähnlich aussehen – sie sind dieselbe Operation mit einem anderen Formattyp. Die Unterschiede liegen darin, was jeder Typ erzeugt und wann man zu ihm greifen würde, was die Vergleichstabelle weiter unten in diesem Artikel behandelt.
Datenbalken: Größenordnung auf einen Blick
Ein Datenbalken zeichnet ein horizontales farbiges Band innerhalb jeder Zelle, und die Länge des Bandes ist proportional zum Wert der Zelle im Verhältnis zum übrigen ausgewählten Bereich. Der größte Wert füllt die Zelle; der kleinste füllt einen schmalen Streifen. Eine Zeile mit Datenbalken zu überfliegen ist dieselbe geistige Operation wie das Überfliegen eines Balkendiagramms, nur dass die Zahlen darunter sichtbar bleiben.
Die Schritte sind:
- Laden Sie die Schriftart und die Testdatendatei in das VFS.
- Laden Sie die Arbeitsmappe und rufen Sie das Arbeitsblatt ab.
- Rufen Sie
ConditionalFormats.Addauf, um ein bedingtes Format zu erstellen, und binden Sie den Datenbereich mitAddRange. - Rufen Sie
AddConditionauf, um eine Bedingung hinzuzufügen, setzen SieFormatTypeaufDataBarund legen Sie die Balkenfarbe fest. - Speichern Sie die Arbeitsmappe.
function App() {
  const applyDataBars = async () => {
    // Get the Spire.XLS WASM module
    const xlsModule = window.wasmModule?.spirexls;

    // Check whether the module is ready
    if (!xlsModule) {
      alert('Spire.Xls is not ready yet');
      return;
    }

    // Load the font and the test data file into the VFS
    await window.spire.FetchFileToVFS('ARIAL.TTF', '/Library/Fonts/', `${process.env.PUBLIC_URL}/font/`);
    const inputFileName = 'SalesData.xlsx';
    await window.spire.FetchFileToVFS(inputFileName, '', `${process.env.PUBLIC_URL}data/`);

    // Load the workbook and get the first worksheet
    const workbook = new xlsModule.Workbook();
    workbook.LoadFromFile({ fileName: inputFileName });
    const sheet = workbook.Worksheets.get(0);

    // Select the data range that receives the data bars
    const dataRange = sheet.Range.get("B2:E9");

    // Create a conditional format and bind it to that range
    const xcfs = sheet.ConditionalFormats.Add();
    xcfs.AddRange(dataRange);

    // Add a data bar condition and set the bar color
    const format = xcfs.AddCondition();
    format.FormatType = xlsModule.ConditionalFormatType.DataBar;
    format.DataBar.BarColor = xlsModule.Color.get_CadetBlue();

    // Save the workbook
    const outputFileName = "ApplyDataBars.xlsx";
    workbook.SaveToFile({ fileName: outputFileName, version: xlsModule.ExcelVersion.Version2010 });

    // Dispose of the workbook object to free resources
    workbook.Dispose();

    // Read the result file from the VFS and trigger the download
    const fileArray = window.dotnetRuntime.Module.FS.readFile(outputFileName);
    const blob = new Blob([fileArray], { type: 'application/vnd.openxmlformats-officedocument.spreadsheetml.sheet' });
    const url = URL.createObjectURL(blob);
    const a = document.createElement('a');
    a.href = url;
    a.download = outputFileName;
    a.click();
    URL.revokeObjectURL(url);
  };

  return (
    <div style={{ textAlign: 'center', height: '300px' }}>
      <h1>Apply Data Bars</h1>
      <button onClick={applyDataBars}>Start</button>
    </div>
  );
}

export default App;
Datenbalken auf eine Verkaufszahlen-Tabelle angewendet, Balkenlänge proportional zum Zellenwert
Nur numerische Zellen erhalten Balken – Textzellen innerhalb des Bereichs werden übersprungen. Das ist zu erwarten: Ein Datenbalken drückt eine relative Größenordnung aus, und Text hat keine Größenordnung auszudrücken. Halten Sie den Bereich auf die numerische Fläche begrenzt; das Einbeziehen einer Produktnamensspalte oder einer Kopfzeile verursacht keinen Fehler, aber diese Zellen zeigen nichts an.
Farbskalen: Heatmap ohne Diagramm
Eine Farbskala schattiert jede Zelle danach, wo ihr Wert zwischen Minimum und Maximum des Bereichs liegt. Es sind keine Farbargumente erforderlich – wenn keine angegeben werden, ist das Ergebnis eine zweifarbige Skala, die am Minimum Orange und am Maximum Blassgelb annimmt, wobei Zwischenwerte proportional schattiert werden. Der Effekt ist eine Heatmap, die in die Datentabelle eingebettet ist: heiße und kalte Stellen sind sichtbar, ohne zu sortieren oder ein Diagramm zu erstellen.
Die Schritte sind dieselben wie bei Datenbalken, mit FormatType auf ColorScale gesetzt und ohne zusätzliche Eigenschaften:
- Laden Sie die Schriftart und die Testdatendatei in das VFS.
- Laden Sie die Arbeitsmappe und rufen Sie das Arbeitsblatt ab.
- Rufen Sie
ConditionalFormats.Addauf, um ein bedingtes Format zu erstellen, und binden Sie den Datenbereich mitAddRange. - Rufen Sie
AddConditionauf, um eine Bedingung hinzuzufügen, und setzen SieFormatTypeaufColorScale. - Speichern Sie die Arbeitsmappe.
function App() {
  const applyColorScales = async () => {
    // Get the Spire.XLS WASM module
    const xlsModule = window.wasmModule?.spirexls;

    // Check whether the module is ready
    if (!xlsModule) {
      alert('Spire.Xls is not ready yet');
      return;
    }

    // Load the font and the test data file into the VFS
    await window.spire.FetchFileToVFS('ARIAL.TTF', '/Library/Fonts/', `${process.env.PUBLIC_URL}/font/`);
    const inputFileName = 'SalesData.xlsx';
    await window.spire.FetchFileToVFS(inputFileName, '', `${process.env.PUBLIC_URL}data/`);

    // Load the workbook and get the first worksheet
    const workbook = new xlsModule.Workbook();
    workbook.LoadFromFile({ fileName: inputFileName });
    const sheet = workbook.Worksheets.get(0);

    // Select the data range that receives the color scales
    const dataRange = sheet.Range.get("B2:E9");

    // Create a conditional format and bind it to that range
    const xcfs = sheet.ConditionalFormats.Add();
    xcfs.AddRange(dataRange);

    // Add a color scale condition; colors transition with the values
    const format = xcfs.AddCondition();
    format.FormatType = xlsModule.ConditionalFormatType.ColorScale;

    // Save the workbook
    const outputFileName = "ApplyColorScales.xlsx";
    workbook.SaveToFile({ fileName: outputFileName, version: xlsModule.ExcelVersion.Version2010 });

    // Dispose of the workbook object to free resources
    workbook.Dispose();

    // Read the result file from the VFS and trigger the download
    const fileArray = window.dotnetRuntime.Module.FS.readFile(outputFileName);
    const blob = new Blob([fileArray], { type: 'application/vnd.openxmlformats-officedocument.spreadsheetml.sheet' });
    const url = URL.createObjectURL(blob);
    const a = document.createElement('a');
    a.href = url;
    a.download = outputFileName;
    a.click();
    URL.revokeObjectURL(url);
  };

  return (
    <div style={{ textAlign: 'center', height: '300px' }}>
      <h1>Apply Color Scales</h1>
      <button onClick={applyColorScales}>Start</button>
    </div>
  );
}

export default App;
Farbskalen auf eine Verkaufszahlen-Tabelle angewendet, Schattierung von Orange bis Blassgelb
Wo Datenbalken die absolute Größenordnung durch die Balkenlänge zeigen, zeigen Farbskalen die relative Position durch den Farbton. Ein Wert in der Mitte des Bereichs erhält einen Mittelton, unabhängig davon, ob der Bereich von 1 bis 100 oder von 10.000 bis 50.000 reicht – die Schattierung ist positionell, nicht absolut.
Symbolsätze: Statusbänder
Ein Symbolsatz platziert ein unterschiedliches Symbol in jeder Zelle, je nachdem, in welches Band der Wert fällt. Das Beispiel verwendet drei Ampeln: Rot für das untere Drittel, Gelb für die Mitte, Grün für das oberste. Anders als Datenbalken und Farbskalen, die einen kontinuierlichen Verlauf vermitteln, vermitteln Symbolsätze eine diskrete Kategorie – „das ist niedrig“, „das ist mittel“, „das ist hoch“ –, was eher einer Statusanzeige als einer Messung entspricht.
Die Schritte unterscheiden sich nur in FormatType und der Auswahl des Symbolstils:
- Laden Sie die Schriftart und die Testdatendatei in das VFS.
- Laden Sie die Arbeitsmappe und rufen Sie das Arbeitsblatt ab.
- Rufen Sie
ConditionalFormats.Addauf, um ein bedingtes Format zu erstellen, und binden Sie den Datenbereich mitAddRange. - Rufen Sie
AddConditionauf, um eine Bedingung hinzuzufügen, setzen SieFormatTypeaufIconSetund geben Sie den Symbolsatztyp an. - Speichern Sie die Arbeitsmappe.
function App() {
  const applyIconSets = async () => {
    // Get the Spire.XLS WASM module
    const xlsModule = window.wasmModule?.spirexls;

    // Check whether the module is ready
    if (!xlsModule) {
      alert('Spire.Xls is not ready yet');
      return;
    }

    // Load the font and the test data file into the VFS
    await window.spire.FetchFileToVFS('ARIAL.TTF', '/Library/Fonts/', `${process.env.PUBLIC_URL}/font/`);
    const inputFileName = 'SalesData.xlsx';
    await window.spire.FetchFileToVFS(inputFileName, '', `${process.env.PUBLIC_URL}data/`);

    // Load the workbook and get the first worksheet
    const workbook = new xlsModule.Workbook();
    workbook.LoadFromFile({ fileName: inputFileName });
    const sheet = workbook.Worksheets.get(0);

    // Select the data range that receives the icon sets
    const dataRange = sheet.Range.get("B2:E9");

    // Create a conditional format and bind it to that range
    const xcfs = sheet.ConditionalFormats.Add();
    xcfs.AddRange(dataRange);

    // Add an icon set condition and set the icon style to three traffic lights
    const format = xcfs.AddCondition();
    format.FormatType = xlsModule.ConditionalFormatType.IconSet;
    format.IconSet.IconSetType = xlsModule.IconSetType.ThreeTrafficLights1;

    // Save the workbook
    const outputFileName = "ApplyIconSets.xlsx";
    workbook.SaveToFile({ fileName: outputFileName, version: xlsModule.ExcelVersion.Version2010 });

    // Dispose of the workbook object to free resources
    workbook.Dispose();

    // Read the result file from the VFS and trigger the download
    const fileArray = window.dotnetRuntime.Module.FS.readFile(outputFileName);
    const blob = new Blob([fileArray], { type: 'application/vnd.openxmlformats-officedocument.spreadsheetml.sheet' });
    const url = URL.createObjectURL(blob);
    const a = document.createElement('a');
    a.href = url;
    a.download = outputFileName;
    a.click();
    URL.revokeObjectURL(url);
  };

  return (
    <div style={{ textAlign: 'center', height: '300px' }}>
      <h1>Apply Icon Sets</h1>
      <button onClick={applyIconSets}>Start</button>
    </div>
  );
}

export default App;
Symbolsätze auf eine Verkaufszahlen-Tabelle angewendet, Ampel-Symbole basierend auf Wertbändern
Ein Symbolsatz unterteilt den Bereich in Bänder, sodass dasselbe Symbol in unterschiedlichen Bereichen eine unterschiedliche Wertespanne abdeckt. In einem Bereich von 10 bis 90 deckt das grüne Symbol etwa 60 bis 90 ab; in einem Bereich von 10 bis 900 deckt es etwa 600 bis 900 ab. Die Bänder sind relativ, nicht absolut – was die richtige Voreinstellung für eine Tabelle ist, in der jede Spalte ihre eigene Skala hat, aber gut zu wissen, wenn Sie eine feste Schwelle erwarten.
Die Wahl zwischen den dreien
Alle drei werden auf einen Bereich angewendet, alle drei leben innerhalb der Zellen, und alle drei sind bedingte Formatierung. Die Wahl hängt davon ab, was der Leser mit den Zahlen tun muss:
| Der Leser muss | Verwenden | Weil |
|---|---|---|
| Größenordnungen über eine Zeile oder Spalte vergleichen | Datenbalken | Die Balkenlänge ist der präziseste visuelle Hinweis auf „wie viel“ |
| Heiße und kalte Stellen in einer großen Tabelle erkennen | Farbskalen | Farbintensität wird peripher wahrgenommen, auch wenn das Auge nicht auf eine bestimmte Zelle fokussiert ist |
| Werte in wenige Statuskategorien einordnen | Symbolsätze | Diskrete Symbole entsprechen diskreten Entscheidungen – „das braucht Aufmerksamkeit“, „das ist in Ordnung“ |
| All das auf einmal sehen | Auf verschiedenen Bereichen kombinieren | Jede bedingte Formatierung ist unabhängig; wenden Sie Datenbalken auf einen Bereich und Symbolsätze auf einen anderen an |
Die drei schließen sich nicht gegenseitig aus. Ein Arbeitsblatt kann im selben Speichervorgang Datenbalken auf den Umsatzspalten und Symbolsätze auf der Wachstumsratenspalte tragen, weil jeder Aufruf von ConditionalFormats.Add ein unabhängiges Format erstellt, das an seinen eigenen Bereich gebunden ist.
Anpassen des Erscheinungsbilds von Datenbalken
Die Füllfarbe eines Datenbalkens stammt aus DataBar.BarColor. Wenn nur FormatType ohne BarColor gesetzt wird, ergibt sich das Standardblau. Ein Rahmen ist ebenfalls verfügbar, hat aber eine Abhängigkeit: Der Rahmentyp muss festgelegt werden, bevor die Rahmenfarbe wirksam wird.
// Set the border type first so that the border color takes effect
format.DataBar.BarBorder.Type = xlsModule.DataBarBorderType.DataBarBorderSolid;
format.DataBar.BarBorder.Color = xlsModule.Color.get_Red();

// Fill color of the bar
format.DataBar.BarColor = xlsModule.Color.get_GreenYellow();
Das Setzen von BarBorder.Color allein, ohne vorher BarBorder.Type festzulegen, hat keine Wirkung – der Rahmen wird nicht gezeichnet, weil kein Rahmentyp deklariert wurde. Farbskalen und Symbolsätze haben keine entsprechenden Eigenschaften für das Erscheinungsbild; ihre Gestaltung wird durch den Formattyp und – bei Symbolsätzen – durch die Enumeration IconSetType bestimmt.
Häufige Probleme
Textzellen im Zielbereich zeigen keine Datenbalken. Das ist zu erwarten. Ein Datenbalken drückt eine relative Größenordnung aus, und nur numerische Zellen haben eine Größenordnung. Textzellen werden stillschweigend übersprungen – kein Fehler, kein Balken. Begrenzen Sie den Bereich auf die numerische Fläche.
Alle Datenbalken sind im Standardblau.
DataBar.BarColor wurde nach der Zuweisung von FormatType nicht gesetzt. Setzen Sie es auf einen beliebigen xlsModule.Color-Wert, um die Füllung zu ändern.
Die Rahmenfarbe des Datenbalkens wird nicht angezeigt.
Der Rahmentyp wurde nicht zuerst festgelegt. Weisen Sie DataBar.BarBorder.Type vor DataBar.BarBorder.Color zu – die Farbe wird erst wirksam, wenn ein durchgehender Rahmentyp deklariert wurde.
Keine sichtbare Änderung nach dem Anwenden einer bedingten Formatierung.
Prüfen Sie, ob der an AddRange übergebene Bereich mit der Stelle übereinstimmt, an der sich die Daten tatsächlich befinden. Ein Bereich, der auf leere Zellen zeigt, erzeugt keinen Fehler und kein sichtbares Ergebnis.
FAQ
Kann ich mehr als eine bedingte Formatierung auf denselben Bereich anwenden?
Ja. Jeder Aufruf von ConditionalFormats.Add erstellt ein unabhängiges Format. Zwei Formate können auf denselben Bereich abzielen, obwohl das visuelle Ergebnis des Stapelns eines Datenbalkens und einer Farbskala auf denselben Zellen verwirrend sein kann – es ist üblicherweise klarer, verschiedene Typen auf verschiedene Bereiche anzuwenden.
Welche Excel-Versionen unterstützen diese Typen der bedingten Formatierung?
Datenbalken, Farbskalen und Symbolsätze wurden in Excel 2007 eingeführt. Das Beispiel speichert mit ExcelVersion.Version2010, um die Kompatibilität sowohl mit Excel 2010 als auch mit späteren Versionen sicherzustellen.
Muss Excel installiert sein, um bedingte Formatierung anzuwenden?
Nein. Die Tabellenkalkulations-Engine ist im Paket enthalten und läuft als WebAssembly im Browser. Die bedingte Formatierung wird als Standard-XML innerhalb der .xlsx-Datei geschrieben, und Excel rendert sie beim Öffnen der Datei.
Kann ich benutzerdefinierte Schwellenwerte für Symbolsätze festlegen?
Die Enumeration IconSetType wählt einen vordefinierten Symbolstil mit vordefinierten Bandgrenzen. Das Beispiel verwendet ThreeTrafficLights1, das den Bereich in drei gleiche Bänder unterteilt.
Bleibt die bedingte Formatierung erhalten, wenn die Datei in Excel geöffnet und erneut gespeichert wird?
Ja. Die bedingte Formatierung ist Teil der gespeicherten Formatregeln des Arbeitsblatts, kein Rendering-Artefakt. Excel liest, bewahrt und wendet dieselben Regeln bei der Neuberechnung erneut an.
Siehe auch
Визуализируйте данные Excel с помощью условного форматирования в JavaScript
Содержание
- Почему бы просто не добавить диаграмму
- Предварительные требования
- Один API, три визуализации
- Гистограммы: величина с первого взгляда
- Цветовые шкалы: тепловая карта без диаграммы
- Наборы значков: диапазоны статусов
- Выбор между тремя
- Настройка внешнего вида гистограмм
- Распространённые проблемы
- Часто задаваемые вопросы
- См. также
Таблица продаж с двадцатью колонками чисел точна, но нечитаема. Глаз не может достаточно быстро сравнить 43 210 и 38 900 в строке, чтобы найти слабый квартал, и человек, читающий отчёт, знает это — именно поэтому он просит диаграмму. Но диаграмма для каждой колонки означает двадцать диаграмм, и теперь рабочий лист превращается в галерею, а не в таблицу.
Гистограммы, цветовые шкалы и наборы значков решают эту задачу внутри самих ячеек. Полоса растёт пропорционально значению. Цвет меняется от бледного к насыщенному по мере роста числа. Значок меняет форму, когда значение пересекает порог. Ни один из них не добавляет строки, столбцы или плавающие объекты — визуализация находится в ячейке, которая уже содержит число. Все три являются разновидностями условного форматирования Excel, и Spire.XLS for JavaScript применяет их через единый API в браузере на WebAssembly, при этом файлы перемещаются через виртуальную файловую систему (VFS), а серверная часть не требуется.
По настройке проекта см. Интеграция Spire.XLS for JavaScript в проект React. Примеры ниже предполагают, что пакет установлен, а модуль WebAssembly инициализирован.
Почему бы просто не добавить диаграмму
Диаграммы и визуализация внутри ячеек отвечают на один и тот же вопрос — "как эти значения соотносятся?" — но подходят для разных ситуаций:
| Диаграммы | Визуализация внутри ячеек | |
|---|---|---|
| Пространство | «Плавает» над рабочим листом, занимает прямоугольную область | Находится внутри ячеек, которые уже содержат данные |
| Плотность | Одна диаграмма на набор данных; несколько диаграмм загромождают лист | Один формат на диапазон; десятки колонок могут одновременно нести визуальные подсказки |
| Детализация | Показывает оси, линии сетки, подписи — полное отображение | Показывает только подсказку: полосу, цвет, значок |
| Лучше всего подходит для | Презентаций, отчётов, отдельных показов | Просмотра таблицы, выявления выбросов, сравнения по множеству колонок |
Когда цель — сделать таблицу чисел удобной для просмотра без перестройки макета, визуализация внутри ячеек является более лёгким инструментом. Три приведённых ниже раздела описывают каждый тип, и у них больше общего в API, чем различий — это первое, что стоит знать.
Предварительные требования
Вам нужен проект React с установленным Spire.XLS for JavaScript и инициализированным модулем WebAssembly, доступным по адресу window.wasmModule.spirexls. Пример загружает шрифт и файл с данными о продажах в VFS и сохраняет с флагом версии Excel 2010 — это самая ранняя версия, поддерживающая эти типы условного форматирования.
Один API, три визуализации
Все три типа используют одну и ту же цепочку вызовов. Меняется только строка с присваиванием FormatType:
sheet.ConditionalFormats.Add() → xcfs.AddRange(range) → format = xcfs.AddCondition() → format.FormatType = ???
| Визуализация | Значение FormatType |
Дополнительная настройка |
|---|---|---|
| Гистограммы | ConditionalFormatType.DataBar |
DataBar.BarColor для цвета заливки |
| Цветовые шкалы | ConditionalFormatType.ColorScale |
Нет — по умолчанию используется двухцветный градиент |
| Наборы значков | ConditionalFormatType.IconSet |
IconSet.IconSetType для стиля значков |
Общая цепочка — вот почему три приведённых ниже примера кода выглядят похоже: это одна и та же операция с разным типом формата. Различия заключаются в том, что производит каждый тип и когда к нему стоит прибегать, — именно этому посвящена сравнительная таблица далее в этой статье.
Гистограммы: величина с первого взгляда
Гистограмма рисует горизонтальную цветную полосу внутри каждой ячейки, и длина полосы пропорциональна значению ячейки относительно остальной части выбранного диапазона. Наибольшее значение заполняет ячейку целиком; наименьшее — лишь тонкую полоску. Просмотр строки гистограмм — та же мыслительная операция, что и просмотр столбчатой диаграммы, только числа остаются видимыми под ними.
Шаги:
- Загрузите шрифт и файл тестовых данных в VFS.
- Загрузите книгу и получите рабочий лист.
- Вызовите
ConditionalFormats.Add, чтобы создать условный формат, и привяжите диапазон данных с помощьюAddRange. - Вызовите
AddCondition, чтобы добавить условие, установитеFormatTypeв значениеDataBarи задайте цвет полосы. - Сохраните книгу.
function App() {
  const applyDataBars = async () => {
    // Get the Spire.XLS WASM module
    const xlsModule = window.wasmModule?.spirexls;

    // Check whether the module is ready
    if (!xlsModule) {
      alert('Spire.Xls is not ready yet');
      return;
    }

    // Load the font and the test data file into the VFS
    await window.spire.FetchFileToVFS('ARIAL.TTF', '/Library/Fonts/', `${process.env.PUBLIC_URL}/font/`);
    const inputFileName = 'SalesData.xlsx';
    await window.spire.FetchFileToVFS(inputFileName, '', `${process.env.PUBLIC_URL}data/`);

    // Load the workbook and get the first worksheet
    const workbook = new xlsModule.Workbook();
    workbook.LoadFromFile({ fileName: inputFileName });
    const sheet = workbook.Worksheets.get(0);

    // Select the data range that receives the data bars
    const dataRange = sheet.Range.get("B2:E9");

    // Create a conditional format and bind it to that range
    const xcfs = sheet.ConditionalFormats.Add();
    xcfs.AddRange(dataRange);

    // Add a data bar condition and set the bar color
    const format = xcfs.AddCondition();
    format.FormatType = xlsModule.ConditionalFormatType.DataBar;
    format.DataBar.BarColor = xlsModule.Color.get_CadetBlue();

    // Save the workbook
    const outputFileName = "ApplyDataBars.xlsx";
    workbook.SaveToFile({ fileName: outputFileName, version: xlsModule.ExcelVersion.Version2010 });

    // Dispose of the workbook object to free resources
    workbook.Dispose();

    // Read the result file from the VFS and trigger the download
    const fileArray = window.dotnetRuntime.Module.FS.readFile(outputFileName);
    const blob = new Blob([fileArray], { type: 'application/vnd.openxmlformats-officedocument.spreadsheetml.sheet' });
    const url = URL.createObjectURL(blob);
    const a = document.createElement('a');
    a.href = url;
    a.download = outputFileName;
    a.click();
    URL.revokeObjectURL(url);
  };

  return (
    <div style={{ textAlign: 'center', height: '300px' }}>
      <h1>Apply Data Bars</h1>
      <button onClick={applyDataBars}>Start</button>
    </div>
  );
}

export default App;
Гистограммы, применённые к таблице показателей продаж; длина полосы пропорциональна значению ячейки
Полосы получают только числовые ячейки — текстовые ячейки внутри диапазона пропускаются. Это ожидаемо: гистограмма выражает относительную величину, а текст не имеет величины для выражения. Ограничьте диапазон числовой областью; включение колонки с названиями товаров или строки заголовков не вызовет ошибки, но в этих ячейках ничего не отобразится.
Цветовые шкалы: тепловая карта без диаграммы
Цветовая шкала закрашивает каждую ячейку в зависимости от того, где её значение находится между минимумом и максимумом диапазона. Аргументы цвета не требуются — если они не указаны, результатом становится двухцветная шкала, принимающая оранжевый цвет на минимуме и бледно-жёлтый на максимуме, а промежуточные значения закрашиваются пропорционально. Эффект — тепловая карта, встроенная в таблицу данных: горячие и холодные точки видны без сортировки или построения диаграмм.
Шаги те же, что и для гистограмм, но FormatType устанавливается в значение ColorScale и дополнительные свойства не задаются:
- Загрузите шрифт и файл тестовых данных в VFS.
- Загрузите книгу и получите рабочий лист.
- Вызовите
ConditionalFormats.Add, чтобы создать условный формат, и привяжите диапазон данных с помощьюAddRange. - Вызовите
AddCondition, чтобы добавить условие, и установитеFormatTypeв значениеColorScale. - Сохраните книгу.
function App() {
  const applyColorScales = async () => {
    // Get the Spire.XLS WASM module
    const xlsModule = window.wasmModule?.spirexls;

    // Check whether the module is ready
    if (!xlsModule) {
      alert('Spire.Xls is not ready yet');
      return;
    }

    // Load the font and the test data file into the VFS
    await window.spire.FetchFileToVFS('ARIAL.TTF', '/Library/Fonts/', `${process.env.PUBLIC_URL}/font/`);
    const inputFileName = 'SalesData.xlsx';
    await window.spire.FetchFileToVFS(inputFileName, '', `${process.env.PUBLIC_URL}data/`);

    // Load the workbook and get the first worksheet
    const workbook = new xlsModule.Workbook();
    workbook.LoadFromFile({ fileName: inputFileName });
    const sheet = workbook.Worksheets.get(0);

    // Select the data range that receives the color scales
    const dataRange = sheet.Range.get("B2:E9");

    // Create a conditional format and bind it to that range
    const xcfs = sheet.ConditionalFormats.Add();
    xcfs.AddRange(dataRange);

    // Add a color scale condition; colors transition with the values
    const format = xcfs.AddCondition();
    format.FormatType = xlsModule.ConditionalFormatType.ColorScale;

    // Save the workbook
    const outputFileName = "ApplyColorScales.xlsx";
    workbook.SaveToFile({ fileName: outputFileName, version: xlsModule.ExcelVersion.Version2010 });

    // Dispose of the workbook object to free resources
    workbook.Dispose();

    // Read the result file from the VFS and trigger the download
    const fileArray = window.dotnetRuntime.Module.FS.readFile(outputFileName);
    const blob = new Blob([fileArray], { type: 'application/vnd.openxmlformats-officedocument.spreadsheetml.sheet' });
    const url = URL.createObjectURL(blob);
    const a = document.createElement('a');
    a.href = url;
    a.download = outputFileName;
    a.click();
    URL.revokeObjectURL(url);
  };

  return (
    <div style={{ textAlign: 'center', height: '300px' }}>
      <h1>Apply Color Scales</h1>
      <button onClick={applyColorScales}>Start</button>
    </div>
  );
}

export default App;
Цветовые шкалы, применённые к таблице показателей продаж; заливка от оранжевого к бледно-жёлтому
Там, где гистограммы показывают абсолютную величину через длину полосы, цветовые шкалы показывают относительную позицию через оттенок. Значение в середине диапазона получает средний тон независимо от того, охватывает диапазон от 1 до 100 или от 10 000 до 50 000 — заливка зависит от позиции, а не от абсолютной величины.
Наборы значков: диапазоны статусов
Набор значков помещает в каждую ячейку свой значок в зависимости от того, в какую полосу попадает значение. В примере используются три светофора: красный для нижней трети, жёлтый для середины, зелёный для верхней. В отличие от гистограмм и цветовых шкал, которые передают непрерывный градиент, наборы значков передают дискретную категорию — "это низко", "это средне", "это высоко" — что ближе к индикатору состояния, чем к измерению.
Шаги отличаются только значением FormatType и выбором стиля значков:
- Загрузите шрифт и файл тестовых данных в VFS.
- Загрузите книгу и получите рабочий лист.
- Вызовите
ConditionalFormats.Add, чтобы создать условный формат, и привяжите диапазон данных с помощьюAddRange. - Вызовите
AddCondition, чтобы добавить условие, установитеFormatTypeв значениеIconSetи укажите тип набора значков. - Сохраните книгу.
function App() {
  const applyIconSets = async () => {
    // Get the Spire.XLS WASM module
    const xlsModule = window.wasmModule?.spirexls;

    // Check whether the module is ready
    if (!xlsModule) {
      alert('Spire.Xls is not ready yet');
      return;
    }

    // Load the font and the test data file into the VFS
    await window.spire.FetchFileToVFS('ARIAL.TTF', '/Library/Fonts/', `${process.env.PUBLIC_URL}/font/`);
    const inputFileName = 'SalesData.xlsx';
    await window.spire.FetchFileToVFS(inputFileName, '', `${process.env.PUBLIC_URL}data/`);

    // Load the workbook and get the first worksheet
    const workbook = new xlsModule.Workbook();
    workbook.LoadFromFile({ fileName: inputFileName });
    const sheet = workbook.Worksheets.get(0);

    // Select the data range that receives the icon sets
    const dataRange = sheet.Range.get("B2:E9");

    // Create a conditional format and bind it to that range
    const xcfs = sheet.ConditionalFormats.Add();
    xcfs.AddRange(dataRange);

    // Add an icon set condition and set the icon style to three traffic lights
    const format = xcfs.AddCondition();
    format.FormatType = xlsModule.ConditionalFormatType.IconSet;
    format.IconSet.IconSetType = xlsModule.IconSetType.ThreeTrafficLights1;

    // Save the workbook
    const outputFileName = "ApplyIconSets.xlsx";
    workbook.SaveToFile({ fileName: outputFileName, version: xlsModule.ExcelVersion.Version2010 });

    // Dispose of the workbook object to free resources
    workbook.Dispose();

    // Read the result file from the VFS and trigger the download
    const fileArray = window.dotnetRuntime.Module.FS.readFile(outputFileName);
    const blob = new Blob([fileArray], { type: 'application/vnd.openxmlformats-officedocument.spreadsheetml.sheet' });
    const url = URL.createObjectURL(blob);
    const a = document.createElement('a');
    a.href = url;
    a.download = outputFileName;
    a.click();
    URL.revokeObjectURL(url);
  };

  return (
    <div style={{ textAlign: 'center', height: '300px' }}>
      <h1>Apply Icon Sets</h1>
      <button onClick={applyIconSets}>Start</button>
    </div>
  );
}

export default App;
Наборы значков, применённые к таблице показателей продаж; значки светофора на основе диапазонов значений
Набор значков делит диапазон на полосы, поэтому один и тот же значок охватывает разный интервал значений в разных диапазонах. В диапазоне от 10 до 90 зелёный значок охватывает примерно от 60 до 90; в диапазоне от 10 до 900 — примерно от 600 до 900. Полосы относительны, а не абсолютны — это правильное поведение по умолчанию для таблицы, где у каждой колонки своя шкала, но об этом стоит знать, если вы ожидаете фиксированный порог.
Выбор между тремя
Все три применяются к диапазону, все три находятся внутри ячеек, и все три являются условным форматированием. Выбор зависит от того, что читателю нужно сделать с числами:
| Читателю нужно | Использовать | Потому что |
|---|---|---|
| Сравнить величины в строке или колонке | Гистограммы | Длина полосы — самая точная визуальная подсказка о том, "сколько" |
| Найти горячие и холодные точки в большой таблице | Цветовые шкалы | Интенсивность цвета воспринимается периферийно, даже когда взгляд не сосредоточен на конкретной ячейке |
| Классифицировать значения по нескольким категориям статуса | Наборы значков | Дискретные значки соответствуют дискретным решениям — "это требует внимания", "это в порядке" |
| Увидеть всё вышеперечисленное сразу | Комбинировать на разных диапазонах | Каждый условный формат независим; примените гистограммы к одному диапазону, а наборы значков — к другому |
Эти три не исключают друг друга. Рабочий лист может содержать гистограммы в колонках выручки и наборы значков в колонке темпов роста при одном сохранении, поскольку каждый вызов ConditionalFormats.Add создаёт независимый формат, привязанный к своему диапазону.
Настройка внешнего вида гистограмм
Цвет заливки гистограммы задаётся через DataBar.BarColor. Если задать только FormatType без BarColor, получится синий цвет по умолчанию. Также доступна граница, но у неё есть зависимость: тип границы должен быть задан до того, как вступит в силу цвет границы.
// Set the border type first so that the border color takes effect
format.DataBar.BarBorder.Type = xlsModule.DataBarBorderType.DataBarBorderSolid;
format.DataBar.BarBorder.Color = xlsModule.Color.get_Red();

// Fill color of the bar
format.DataBar.BarColor = xlsModule.Color.get_GreenYellow();
Если задать только BarBorder.Color, не установив предварительно BarBorder.Type, это не даст эффекта — граница не будет нарисована, поскольку тип границы не объявлен. У цветовых шкал и наборов значков нет аналогичных свойств внешнего вида; их стиль определяется типом формата, а для наборов значков — перечислением IconSetType.
Распространённые проблемы
Текстовые ячейки в целевом диапазоне не показывают гистограммы. Это ожидаемо. Гистограмма выражает относительную величину, и только числовые ячейки обладают величиной. Текстовые ячейки пропускаются без уведомления — ни ошибки, ни полосы. Ограничьте диапазон числовой областью.
Все гистограммы синие по умолчанию.
DataBar.BarColor не был задан после присваивания FormatType. Установите любое значение xlsModule.Color, чтобы изменить заливку.
Цвет границы гистограммы не отображается.
Тип границы не был задан первым. Присвойте DataBar.BarBorder.Type до DataBar.BarBorder.Color — цвет вступает в силу только после объявления сплошного типа границы.
После применения условного формата нет видимых изменений.
Проверьте, что диапазон, переданный в AddRange, соответствует тому, где действительно находятся данные. Диапазон, указывающий на пустые ячейки, не вызывает ошибки и не даёт видимого результата.
Часто задаваемые вопросы
Можно ли применить более одного условного формата к одному и тому же диапазону?
Да. Каждый вызов ConditionalFormats.Add создаёт независимый формат. Два формата могут нацеливаться на один и тот же диапазон, хотя визуальный результат наложения гистограммы и цветовой шкалы на одни и те же ячейки может запутать — обычно понятнее применять разные типы к разным диапазонам.
Какие версии Excel поддерживают эти типы условного форматирования?
Гистограммы, цветовые шкалы и наборы значков появились в Excel 2007. Пример сохраняется с ExcelVersion.Version2010, чтобы обеспечить совместимость как с Excel 2010, так и с более поздними версиями.
Нужен ли установленный Excel для применения условного форматирования?
Нет. Механизм работы с электронными таблицами входит в состав пакета и работает как WebAssembly в браузере. Условное форматирование записывается как стандартный XML внутри файла .xlsx, и Excel отображает его при открытии файла.
Можно ли задать собственные пороги для наборов значков?
Перечисление IconSetType выбирает предопределённый стиль значков с предопределёнными границами полос. В примере используется ThreeTrafficLights1, который делит диапазон на три равные полосы.
Сохранится ли условное форматирование, если файл открыть и пересохранить в Excel?
Да. Условное форматирование является частью сохранённых правил формата рабочего листа, а не артефактом отображения. Excel читает, сохраняет и повторно применяет те же правила при пересчёте.
См. также
Inserir Formas de Linha no Excel em JavaScript (React)
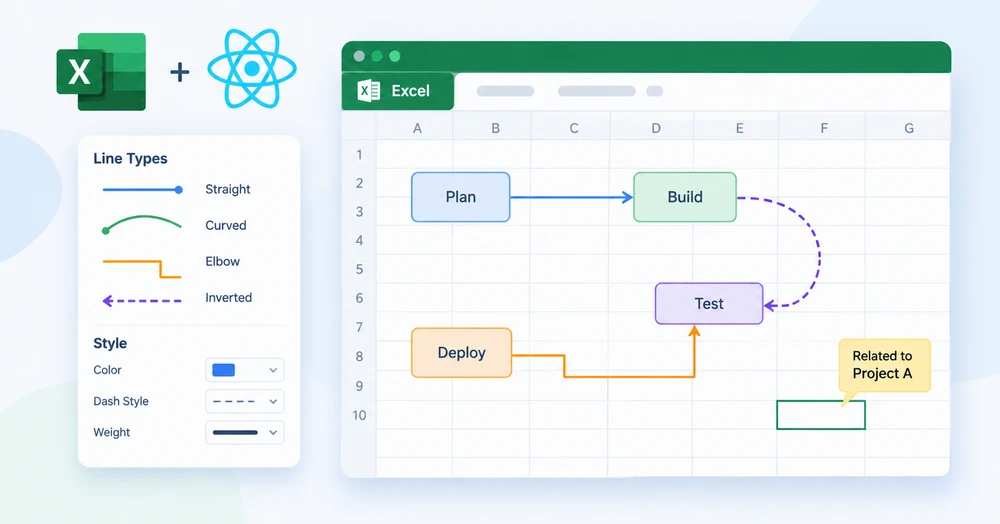
Uma planilha nem sempre é apenas uma grade de números. Às vezes, ela é uma tela — um fluxograma esboçado entre blocos de dados, um diagrama de relacionamento conectando equipes a projetos, uma chamada apontando de uma nota para a célula que ela anota. Em cada um desses casos, o elemento que falta é uma linha: um traço reto entre duas caixas, um arco curvo ao redor de uma região, um conector em cotovelo que dobra uma vez e continua.
Spire.XLS for JavaScript oferece a um aplicativo React o método sheet.Lines.AddLine() para inserir formas de linha em uma posição especificada, com quatro tipos de linha disponíveis por meio do enum LineShapeType e controle total sobre estilo de traço, cor e espessura. Tudo é executado no navegador via WebAssembly — sem backend, sem automação do Excel, sem upload de arquivo.
Para configuração do projeto, consulte Integrando o Spire.XLS for JavaScript em um projeto React. Os exemplos abaixo pressupõem que o pacote está instalado e o módulo WebAssembly foi inicializado.
Quando uma planilha precisa de linhas
Linhas em uma planilha atendem a três propósitos amplos, e o tipo de linha que você escolhe depende de qual deles está diante de você:
| Cenário | O que a linha faz | Tipo de linha típico |
|---|---|---|
| Fluxograma entre blocos de dados | Conecta uma etapa do processo à próxima, às vezes com uma curva | Reta ou em cotovelo |
| Diagrama de relacionamento | Liga entidades que não estão alinhadas em uma grade | Curva |
| Limite ou divisor de região | Separa uma área da planilha de outra | Reta |
| Chamada ou indicador de anotação | Chama a atenção de um rótulo para uma célula | Reta com ponta de seta |
O caso da ponta de seta — em que a linha precisa mostrar direção — usa uma API diferente, TypedLines.AddLine(), que oferece suporte a estilos de seta nas duas extremidades e posicionamento com precisão de pixels. Isso é abordado separadamente em Adicionar conectores de seta no Excel em JavaScript (React). Este artigo concentra-se em Lines.AddLine(), que lida com as quatro formas de linha principais e sua estilização visual.
Pré-requisitos
Você precisa de um projeto React com o Spire.XLS for JavaScript instalado e o módulo WebAssembly inicializado, acessível em window.wasmModule.spirexls. O exemplo carrega uma fonte no VFS para medição de texto e salva com o sinalizador de versão do Excel 2010.
Os quatro tipos de linha
LineShapeType expõe quatro formas, e a diferença entre elas é geométrica — como a linha percorre do início ao fim:
Valor de LineShapeType |
Forma | Como se parece | Use-a quando |
|---|---|---|---|
Line |
Linha reta | Um único traço do início ao fim | Conectar dois pontos na mesma linha ou coluna |
CurveLine |
Linha curva | Um arco suave entre o início e o fim | Contornar outro conteúdo ou mostrar um relacionamento não linear |
ElbowLine |
Conector em cotovelo | Uma linha que dobra uma vez em ângulo reto | Etapas de fluxograma que não estão diretamente alinhadas |
LineInv |
Linha invertida | Uma linha reta com orientação invertida | Layouts espelhados ou diagramas da direita para a esquerda |
Todas as quatro são criadas pelo mesmo método — sheet.Lines.AddLine() — com o parâmetro lineShapeType selecionando qual delas é desenhada. As propriedades de aparência (DashStyle, Color, Weight) aplicam-se uniformemente a todas as quatro.
Inserir linhas em uma planilha
O exemplo insere um de cada tipo de linha em uma nova planilha, cada uma com um estilo de traço e cor distintos para que as quatro formas sejam distinguíveis na saída. As etapas são:
- Crie um objeto
Workbooke obtenha a primeira planilha. - Chame
Worksheet.Lines.AddLine()quatro vezes, passando parâmetros de posição e umLineShapeTypediferente a cada vez. - Personalize
DashStyle,ColoreWeightde cada linha. - Salve a pasta de trabalho com
Workbook.SaveToFile().
function App() {
  const addLineShapes = async () => {
    // Get the Spire.XLS WASM module
    const xlsModule = window.wasmModule?.spirexls;

    // Check whether the module is ready
    if (!xlsModule) {
      alert('Spire.Xls is not ready yet');
      return;
    }

    // Load the font into the VFS for text measurement and column auto-fit
    await window.spire.FetchFileToVFS('ARIAL.TTF', '/Library/Fonts/', `${process.env.PUBLIC_URL}/font/`);

    // Create a new workbook and get the first worksheet
    const workbook = new xlsModule.Workbook();
    const sheet = workbook.Worksheets.get(0);

    // Add a straight line - solid, CadetBlue, weight 2, with arrow
    let line1 = sheet.Lines.AddLine({ row: 10, column: 2, width: 200, height: 1, lineShapeType: xlsModule.LineShapeType.Line });
    line1.DashStyle = xlsModule.ShapeDashLineStyleType.Solid;
    line1.Color = xlsModule.Color.get_CadetBlue();
    line1.Weight = 2;
    line1.EndArrowHeadStyle = xlsModule.ShapeArrowStyleType.LineArrow;

    // Add a curved line - dotted, OrangeRed, weight 2
    let line2 = sheet.Lines.AddLine({ row: 12, column: 2, width: 200, height: 1, lineShapeType: xlsModule.LineShapeType.CurveLine });
    line2.DashStyle = xlsModule.ShapeDashLineStyleType.Dotted;
    line2.Color = xlsModule.Color.get_OrangeRed();
    line2.Weight = 2;

    // Add an elbow connector - DashDotDot, Purple, weight 2
    let line3 = sheet.Lines.AddLine({ row: 14, column: 2, width: 200, height: 1, lineShapeType: xlsModule.LineShapeType.ElbowLine });
    line3.DashStyle = xlsModule.ShapeDashLineStyleType.DashDotDot;
    line3.Color = xlsModule.Color.get_Purple();
    line3.Weight = 2;

    // Add an inverted line - Dashed, Green, weight 2
    let line4 = sheet.Lines.AddLine({ row: 16, column: 2, width: 200, height: 1, lineShapeType: xlsModule.LineShapeType.LineInv });
    line4.DashStyle = xlsModule.ShapeDashLineStyleType.Dashed;
    line4.Color = xlsModule.Color.get_Green();
    line4.Weight = 2;

    // Save the workbook
    const outputFileName = 'AddLineShapes.xlsx';
    workbook.SaveToFile({ fileName: outputFileName, version: xlsModule.ExcelVersion.Version2010 });

    // Release resources
    workbook.Dispose();

    // Read the saved file from the VFS and trigger the download
    const fileArray = window.dotnetRuntime.Module.FS.readFile(outputFileName);
    const blob = new Blob([fileArray], { type: 'application/vnd.openxmlformats-officedocument.spreadsheetml.sheet' });
    const url = URL.createObjectURL(blob);
    const a = document.createElement('a');
    a.href = url;
    a.download = outputFileName;
    a.click();
    URL.revokeObjectURL(url);
  };

  return (
    <div style={{ textAlign: 'center', height: '300px' }}>
      <h1>Add Line Shapes</h1>
      <button onClick={addLineShapes}>Start</button>
    </div>
  );
}

export default App;
Quatro tipos de linha inseridos em uma planilha: reta, curva, em cotovelo e invertida

A primeira linha também define EndArrowHeadStyle, o que lhe dá uma ponta de seta no final — Lines.AddLine() oferece suporte a um único estilo de seta no final, mas não no início. Para setas nas duas extremidades ou posicionamento com precisão de pixels, use TypedLines.AddLine(), abordado em Adicionar conectores de seta no Excel em JavaScript (React).
Personalizar a aparência da linha
Três propriedades controlam a aparência de uma linha, e elas são independentes — alterar uma não redefine as outras:
| Propriedade | O que ela controla | Valores de exemplo |
|---|---|---|
DashStyle |
O padrão de tracejado do traço | Solid, Dotted, Dashed, DashDotDot |
Color |
A cor do traço | Qualquer valor de xlsModule.Color.get_*() |
Weight |
A espessura do traço, em pontos | 1, 2, 3 — quanto maior, mais espessa |
O estilo de traço é o que vale a pena experimentar. Uma linha sólida é lida como uma conexão permanente; uma linha pontilhada é lida como provisória ou opcional; uma linha tracejada é lida como um limite. Em um fluxograma em que algumas conexões são condicionais, usar Solid para o fluxo principal e Dashed para os ramos condicionais comunica a distinção sem uma legenda.
Posicionamento por linha e coluna
Lines.AddLine() posiciona uma linha usando coordenadas de linha e coluna, além de largura e altura:
sheet.Lines.AddLine({ row: 10, column: 2, width: 200, height: 1, lineShapeType: xlsModule.LineShapeType.Line });
rowecolumndefinem o ponto de ancoragem — onde a linha começa.widthdefine a extensão horizontal em pixels.heightdefine a extensão vertical em pixels. Uma altura de1produz uma linha horizontal; uma largura de1produz uma vertical.
Este é um sistema híbrido: a âncora está em unidades da planilha (linhas e colunas), mas o tamanho está em pixels. Isso torna simples alinhar uma linha a uma célula específica — passe a linha e a coluna dessa célula — mas o comprimento precisa considerar as larguras das colunas e as alturas das linhas, que variam. Se você precisar de controle total em pixels sobre a posição inicial, bem como o tamanho, TypedLines.AddLine() oferece Top e Left em pixels.
Problemas comuns
A linha não está visível na saída.
Verifique Weight e Color. Um peso 0 ou uma cor que corresponde ao fundo produz uma linha invisível. Também verifique se row e column colocam a linha dentro do intervalo usado da planilha — uma linha ancorada na linha 1000 em uma planilha vazia é desenhada, mas fora da tela.
A ponta de seta está ausente.
EndArrowHeadStyle não foi definido, ou foi definido como LineNoArrow. Atribua ShapeArrowStyleType.LineArrow para mostrar uma ponta de seta no final da linha. Lines.AddLine() não oferece suporte a BeginArrowHeadStyle — para setas nas duas extremidades, use TypedLines.AddLine().
A linha em cotovelo vai em uma direção inesperada.
Um conector em cotovelo dobra uma vez, e a direção da dobra depende dos valores de width e height. Uma largura positiva com uma altura positiva dobra para baixo e para a direita; alterar o sinal de qualquer um dos valores muda a direção da dobra. Experimente com valores pequenos primeiro para confirmar a forma antes de partir para um layout grande.
As linhas se sobrepõem ou se empilham umas sobre as outras.
Cada chamada a AddLine cria uma forma independente na posição especificada. Se duas linhas compartilham a mesma row e column, elas se sobrepõem. Desloque o valor de row em 2 ou mais para cada linha sucessiva, como o exemplo faz.
Perguntas frequentes
Qual é a diferença entre Lines.AddLine() e TypedLines.AddLine()?
Lines.AddLine() posiciona por linha e coluna e oferece suporte a uma ponta de seta apenas no final. TypedLines.AddLine() posiciona por coordenadas em pixels e oferece suporte a pontas de seta nas duas extremidades. Para formas de linha básicas sem setas direcionais, Lines.AddLine() é mais simples. Para conectores que precisam de posicionamento preciso ou setas bidirecionais, consulte Adicionar conectores de seta no Excel em JavaScript (React).
Posso criar uma linha vertical?
Sim. Defina width como 1 e height como um valor positivo. A linha se estende para baixo a partir do ponto de ancoragem.
Quantas linhas uma única planilha pode conter?
Não há um limite rígido na API. Cada linha é um objeto de forma armazenado na coleção de formas da planilha, e a restrição prática é o tamanho do arquivo e o desempenho de renderização quando centenas de formas estão presentes.
As linhas são preservadas se o arquivo for aberto no Excel?
Sim. As linhas são armazenadas como objetos de forma padrão no XML da planilha. O Excel as lê e renderiza nativamente — não são um artefato de renderização específico do Spire.XLS.
Posso recuperar e modificar linhas que já existem em uma pasta de trabalho?
Sim. Percorra a coleção sheet.Shapes para acessar objetos de forma de linha e, em seguida, modifique suas propriedades por meio da interface ILineShape. Para exclusão, use sheet.Shapes.Remove(index).
Veja também
JavaScript(React)로 Excel에 선 도형 삽입
워크시트는 항상 숫자 그리드만 있는 것은 아닙니다. 때로는 캔버스입니다. 데이터 블록 사이에 스케치된 순서도, 팀을 프로젝트에 연결하는 관계 다이어그램, 노트에서 주석이 달린 셀을 가리키는 콜아웃 등이 있습니다. 이 모든 경우에 빠진 요소는 선입니다. 두 상자 사이의 직선, 영역 주위의 곡선 호, 한 번 구부러지고 계속되는 엘보 커넥터 등이 있습니다.
Spire.XLS for JavaScript는 React 앱에 sheet.Lines.AddLine() 메서드를 제공하여 지정된 위치에 선 도형을 삽입할 수 있으며, LineShapeType 열거형을 통해 네 가지 선 유형을 사용할 수 있고 대시 스타일, 색상 및 두께를 완전히 제어할 수 있습니다. 모든 것이 브라우저에서 WebAssembly로 실행됩니다. 백엔드, Excel 자동화, 파일 업로드가 필요 없습니다.
프로젝트 설정에 대해서는 React 프로젝트에 Spire.XLS for JavaScript 통합을 참조하세요. 아래 예제는 패키지가 설치되고 WebAssembly 모듈이 초기화되었다고 가정합니다.
워크시트에 선이 필요할 때
워크시트의 선은 크게 세 가지 목적을 수행하며, 어떤 선 유형을 선택할지는 앞에 놓인 목적에 따라 달라집니다:
| 시나리오 | 선의 역할 | 일반적인 선 유형 |
|---|---|---|
| 데이터 블록 간의 순서도 | 프로세스 단계를 다음 단계로 연결하며, 때로는 굽은 부분이 있음 | 직선 또는 엘보 |
| 관계 다이어그램 | 그리드에 정렬되지 않은 엔터티를 연결 | 곡선 |
| 영역 경계 또는 구분선 | 시트의 한 영역을 다른 영역과 분리 | 직선 |
| 콜아웃 또는 주석 포인터 | 레이블에서 셀로 주의를 끌기 | 화살표가 있는 직선 |
화살표가 있는 경우(선이 방향을 표시해야 하는 경우)는 다른 API인 TypedLines.AddLine()을 사용하며, 양쪽 끝에 화살표 스타일을 지원하고 픽셀 단위로 정확한 위치 지정이 가능합니다. 이는 JavaScript(React)에서 Excel에 화살표 커넥터 추가에서 별도로 다룹니다. 이 문서는 네 가지 핵심 선 모양과 시각적 스타일을 처리하는 Lines.AddLine()에 중점을 둡니다.
필수 조건
Spire.XLS for JavaScript가 설치되고 WebAssembly 모듈이 초기화된 React 프로젝트가 필요하며, window.wasmModule.spirexls에서 접근할 수 있어야 합니다. 샘플은 텍스트 측정을 위해 VFS에 폰트를 로드하고 Excel 2010 버전 플래그로 저장합니다.
네 가지 선 유형
LineShapeType은 네 가지 모양을 제공하며, 이들 간의 차이는 기하학적입니다. 즉, 선이 시작점에서 끝점까지 이동하는 방식입니다:
LineShapeType 값 |
모양 | 어떻게 보이는지 | 사용 시기 |
|---|---|---|---|
Line |
직선 | 시작부터 끝까지 단일 획 | 같은 행이나 열의 두 점을 연결할 때 |
CurveLine |
곡선 | 시작과 끝 사이의 부드러운 호 | 다른 콘텐츠를 우회하거나 비선형 관계를 표시할 때 |
ElbowLine |
엘보 커넥터 | 직각으로 한 번 구부러지는 선 | 직접 정렬되지 않은 순서도 단계 |
LineInv |
반전된 선 | 방향이 반전된 직선 | 미러 레이아웃 또는 오른쪽에서 왼쪽 다이어그램 |
네 가지 모두 동일한 메서드인 sheet.Lines.AddLine()으로 생성되며, lineShapeType 매개변수가 어떤 선을 그릴지 선택합니다. 모양 속성(DashStyle, Color, Weight)은 네 가지 모두에 균일하게 적용됩니다.
워크시트에 선 삽입
이 예제는 각 선 유형을 새 워크시트에 하나씩 삽입하며, 출력에서 네 가지 모양을 구분할 수 있도록 각기 다른 대시 스타일과 색상을 지정합니다. 단계는 다음과 같습니다:
Workbook객체를 만들고 첫 번째 워크시트를 가져옵니다.Worksheet.Lines.AddLine()을 네 번 호출하여 매번 위치 매개변수와 다른LineShapeType을 전달합니다.- 각 선의
DashStyle,Color및Weight를 사용자 지정합니다. Workbook.SaveToFile()을 사용하여 통합 문서를 저장합니다.
function App() {
  const addLineShapes = async () => {
    // Get the Spire.XLS WASM module
    const xlsModule = window.wasmModule?.spirexls;

    // Check whether the module is ready
    if (!xlsModule) {
      alert('Spire.Xls is not ready yet');
      return;
    }

    // Load the font into the VFS for text measurement and column auto-fit
    await window.spire.FetchFileToVFS('ARIAL.TTF', '/Library/Fonts/', `${process.env.PUBLIC_URL}/font/`);

    // Create a new workbook and get the first worksheet
    const workbook = new xlsModule.Workbook();
    const sheet = workbook.Worksheets.get(0);

    // Add a straight line - solid, CadetBlue, weight 2, with arrow
    let line1 = sheet.Lines.AddLine({ row: 10, column: 2, width: 200, height: 1, lineShapeType: xlsModule.LineShapeType.Line });
    line1.DashStyle = xlsModule.ShapeDashLineStyleType.Solid;
    line1.Color = xlsModule.Color.get_CadetBlue();
    line1.Weight = 2;
    line1.EndArrowHeadStyle = xlsModule.ShapeArrowStyleType.LineArrow;

    // Add a curved line - dotted, OrangeRed, weight 2
    let line2 = sheet.Lines.AddLine({ row: 12, column: 2, width: 200, height: 1, lineShapeType: xlsModule.LineShapeType.CurveLine });
    line2.DashStyle = xlsModule.ShapeDashLineStyleType.Dotted;
    line2.Color = xlsModule.Color.get_OrangeRed();
    line2.Weight = 2;

    // Add an elbow connector - DashDotDot, Purple, weight 2
    let line3 = sheet.Lines.AddLine({ row: 14, column: 2, width: 200, height: 1, lineShapeType: xlsModule.LineShapeType.ElbowLine });
    line3.DashStyle = xlsModule.ShapeDashLineStyleType.DashDotDot;
    line3.Color = xlsModule.Color.get_Purple();
    line3.Weight = 2;

    // Add an inverted line - Dashed, Green, weight 2
    let line4 = sheet.Lines.AddLine({ row: 16, column: 2, width: 200, height: 1, lineShapeType: xlsModule.LineShapeType.LineInv });
    line4.DashStyle = xlsModule.ShapeDashLineStyleType.Dashed;
    line4.Color = xlsModule.Color.get_Green();
    line4.Weight = 2;

    // Save the workbook
    const outputFileName = 'AddLineShapes.xlsx';
    workbook.SaveToFile({ fileName: outputFileName, version: xlsModule.ExcelVersion.Version2010 });

    // Release resources
    workbook.Dispose();

    // Read the saved file from the VFS and trigger the download
    const fileArray = window.dotnetRuntime.Module.FS.readFile(outputFileName);
    const blob = new Blob([fileArray], { type: 'application/vnd.openxmlformats-officedocument.spreadsheetml.sheet' });
    const url = URL.createObjectURL(blob);
    const a = document.createElement('a');
    a.href = url;
    a.download = outputFileName;
    a.click();
    URL.revokeObjectURL(url);
  };

  return (
    <div style={{ textAlign: 'center', height: '300px' }}>
      <h1>Add Line Shapes</h1>
      <button onClick={addLineShapes}>Start</button>
    </div>
  );
}

export default App;
워크시트에 삽입된 네 가지 선 유형: 직선, 곡선, 엘보, 반전
첫 번째 선은 EndArrowHeadStyle도 설정하여 끝에 화살촉을 추가합니다. Lines.AddLine()은 끝에 단일 화살표 스타일을 지원하지만 시작 부분에는 지원하지 않습니다. 양쪽 끝에 화살표를 사용하거나 픽셀 단위로 정확한 위치 지정이 필요한 경우 대신 TypedLines.AddLine()을 사용하며, 이는 JavaScript(React)에서 Excel에 화살표 커넥터 추가에서 다룹니다.
선 모양 사용자 지정
선의 모양을 제어하는 세 가지 속성이 있으며, 이들은 독립적입니다. 하나를 변경해도 다른 속성이 재설정되지 않습니다:
| 속성 | 제어 대상 | 예시 값 |
|---|---|---|
DashStyle |
선의 대시 패턴 | Solid, Dotted, Dashed, DashDotDot |
Color |
선 색상 | 모든 xlsModule.Color.get_*() 값 |
Weight |
선 두께(포인트) | 1, 2, 3 — 높을수록 두꺼움 |
대시 스타일은 실험해 볼 가치가 있습니다. 실선은 영구적인 연결로 읽히고, 점선은 임시적이거나 선택적인 연결로 읽히며, 파선은 경계로 읽힙니다. 일부 연결이 조건부인 순서도에서 주요 흐름에는 Solid를, 조건부 분기에는 Dashed를 사용하면 범례 없이도 구분을 전달할 수 있습니다.
행과 열로 위치 지정
Lines.AddLine()은 행과 열 좌표, 그리고 너비와 높이를 사용하여 선을 배치합니다:
sheet.Lines.AddLine({ row: 10, column: 2, width: 200, height: 1, lineShapeType: xlsModule.LineShapeType.Line });
row와column은 앵커 포인트(선이 시작되는 위치)를 설정합니다.width는 가로 범위를 픽셀 단위로 설정합니다.height는 세로 범위를 픽셀 단위로 설정합니다.height가1이면 가로선이 생성되고,width가1이면 세로선이 생성됩니다.
이것은 하이브리드 시스템입니다. 앵커는 스프레드시트 단위(행과 열)이지만 크기는 픽셀 단위입니다. 따라서 특정 셀에 선을 정렬하기는 쉽습니다. 해당 셀의 행과 열을 전달하면 됩니다. 그러나 길이는 열 너비와 행 높이를 고려해야 하며, 이는 다양합니다. 크기뿐만 아니라 시작 위치에 대해서도 완전한 픽셀 제어가 필요한 경우 TypedLines.AddLine()은 픽셀 단위의 Top과 Left를 제공합니다.
일반적인 문제
출력에서 선이 보이지 않습니다.
Weight와 Color를 확인하세요. 가중치가 0이거나 배경과 일치하는 색상은 보이지 않는 선을 만듭니다. 또한 row와 column이 워크시트의 사용 범위 내에 선을 배치하는지 확인하세요. 빈 시트의 행 1000에 앵커된 선은 그려지지만 화면 밖에 있습니다.
화살촉이 없습니다.
EndArrowHeadStyle이 설정되지 않았거나 LineNoArrow로 설정되었습니다. 선 끝에 화살촉을 표시하려면 ShapeArrowStyleType.LineArrow를 할당하세요. Lines.AddLine()은 BeginArrowHeadStyle을 지원하지 않습니다. 양쪽 끝에 화살표를 사용하려면 TypedLines.AddLine()을 사용하세요.
엘보 선이 예상치 못한 방향으로 갑니다.
엘보 커넥터는 한 번 구부러지며, 구부러지는 방향은 width와 height 값에 따라 달라집니다. 양수 너비와 양수 높이는 오른쪽 아래로 구부러집니다. 어느 한 값의 부호를 바꾸면 구부러지는 방향이 바뀝니다. 큰 레이아웃을 적용하기 전에 작은 값으로 실험하여 모양을 확인하세요.
선이 겹치거나 서로 위에 쌓입니다.
AddLine을 호출할 때마다 지정된 위치에 독립적인 도형이 생성됩니다. 두 선이 동일한 row와 column을 공유하면 겹칩니다. 예제에서처럼 각 연속 선에 대해 row 값을 2 이상씩 오프셋하세요.
FAQ
Lines.AddLine()과 TypedLines.AddLine()의 차이점은 무엇인가요?
Lines.AddLine()은 행과 열로 위치를 지정하고 끝에만 화살촉을 지원합니다. TypedLines.AddLine()은 픽셀 좌표로 위치를 지정하고 양쪽 끝에 화살촉을 지원합니다. 방향 화살표가 없는 기본 선 모양에는 Lines.AddLine()이 더 간단합니다. 정밀한 배치나 양방향 화살표가 필요한 커넥터는 JavaScript(React)에서 Excel에 화살표 커넥터 추가를 참조하세요.
세로선을 만들 수 있나요?
예. width를 1로 설정하고 height를 양수로 설정하세요. 선은 앵커 포인트에서 아래쪽으로 확장됩니다.
단일 워크시트에 몇 개의 선을 넣을 수 있나요?
API에는 엄격한 제한이 없습니다. 각 선은 워크시트의 도형 컬렉션에 저장되는 도형 객체이며, 실제 제약은 수백 개의 도형이 있을 때 파일 크기와 렌더링 성능입니다.
파일을 Excel에서 열면 선이 유지되나요?
예. 선은 워크시트 XML에 표준 도형 객체로 저장됩니다. Excel은 이를 기본적으로 읽고 렌더링합니다. 이는 Spire.XLS에 특정된 렌더링 결과물이 아닙니다.
통합 문서에 이미 존재하는 선을 검색하고 수정할 수 있나요?
예. sheet.Shapes 컬렉션을 순회하여 선 도형 객체에 액세스한 다음 ILineShape 인터페이스를 통해 해당 속성을 수정합니다. 삭제하려면 sheet.Shapes.Remove(index)를 사용하세요.
참조 항목
Inserisci forme di linee in Excel in JavaScript (React)
Indice dei contenuti
Un foglio di lavoro non è sempre solo una griglia di numeri. A volte è una tela — un diagramma di flusso abbozzato tra blocchi di dati, un diagramma di relazioni che collega team a progetti, una nota che punta da un'annotazione alla cella che essa commenta. In ognuno di questi casi l'elemento mancante è una linea: un tratto rettilineo tra due caselle, un arco curvo attorno a una regione, un connettore a gomito che si piega una volta e prosegue.
Spire.XLS for JavaScript offre a un'app React il metodo sheet.Lines.AddLine() per inserire forme di linea in una posizione specificata, con quattro tipi di linea disponibili tramite l'enum LineShapeType e il pieno controllo su stile del tratteggio, colore e spessore. Tutto viene eseguito nel browser su WebAssembly — nessun backend, nessuna automazione di Excel, nessun caricamento di file.
Per la configurazione del progetto, consulta Integrating Spire.XLS for JavaScript in a React Project. Gli esempi seguenti presuppongono che il pacchetto sia installato e che il modulo WebAssembly sia stato inizializzato.
Quando un foglio di lavoro ha bisogno di linee
Le linee in un foglio di lavoro servono tre scopi generali, e il tipo di linea da utilizzare dipende da quale di essi ti trovi di fronte:
| Scenario | Cosa fa la linea | Tipo di linea tipico |
|---|---|---|
| Diagramma di flusso tra blocchi di dati | Collega un passaggio di processo a quello successivo, a volte con una piega | Retta o a gomito |
| Diagramma di relazioni | Collega entità che non sono allineate in una griglia | Curva |
| Confine o divisore di regione | Separa un'area del foglio da un'altra | Retta |
| Indicatore di nota o annotazione | Attira l'attenzione da un'etichetta a una cella | Retta con punta di freccia |
Il caso della punta di freccia — in cui la linea deve mostrare la direzione — utilizza un'API diversa, TypedLines.AddLine(), che supporta stili di freccia su entrambe le estremità e un posizionamento preciso al pixel. Questo è trattato separatamente in Add Arrow Connectors in Excel in JavaScript (React). Questo articolo si concentra su Lines.AddLine(), che gestisce le quattro forme di linea principali e la loro stilizzazione visiva.
Prerequisiti
È necessario un progetto React con Spire.XLS for JavaScript installato e il modulo WebAssembly inizializzato, accessibile all'indirizzo window.wasmModule.spirexls. L'esempio carica un font nel VFS per la misurazione del testo e salva con il flag della versione Excel 2010.
I quattro tipi di linea
LineShapeType espone quattro forme, e la differenza tra esse è geometrica — come la linea si sposta dal suo inizio alla sua fine:
Valore di LineShapeType |
Forma | Aspetto | Utilizzalo quando |
|---|---|---|---|
Line |
Linea retta | Un singolo tratto dall'inizio alla fine | Colleghi due punti sulla stessa riga o colonna |
CurveLine |
Linea curva | Un arco uniforme tra inizio e fine | Devi aggirare altri contenuti o mostrare una relazione non lineare |
ElbowLine |
Connettore a gomito | Una linea che si piega una volta ad angolo retto | Passaggi di diagramma di flusso non direttamente allineati |
LineInv |
Linea invertita | Una linea retta con orientamento invertito | Layout speculari o diagrammi da destra a sinistra |
Tutte e quattro vengono create dallo stesso metodo — sheet.Lines.AddLine() — con il parametro lineShapeType che seleziona quale viene disegnata. Le proprietà di aspetto (DashStyle, Color, Weight) si applicano uniformemente a tutte e quattro.
Inserire linee in un foglio di lavoro
L'esempio inserisce uno di ciascun tipo di linea in un nuovo foglio di lavoro, ognuno con uno stile di tratteggio e un colore distinti in modo che le quattro forme siano distinguibili nell'output. I passaggi sono:
- Creare un oggetto
Workbooke ottenere il primo foglio di lavoro. - Chiamare
Worksheet.Lines.AddLine()quattro volte, passando i parametri di posizione e un diversoLineShapeTypeogni volta. - Personalizzare
DashStyle,ColoreWeightdi ciascuna linea. - Salvare la cartella di lavoro con
Workbook.SaveToFile().
function App() {
  const addLineShapes = async () => {
    // Get the Spire.XLS WASM module
    const xlsModule = window.wasmModule?.spirexls;

    // Check whether the module is ready
    if (!xlsModule) {
      alert('Spire.Xls is not ready yet');
      return;
    }

    // Load the font into the VFS for text measurement and column auto-fit
    await window.spire.FetchFileToVFS('ARIAL.TTF', '/Library/Fonts/', `${process.env.PUBLIC_URL}/font/`);

    // Create a new workbook and get the first worksheet
    const workbook = new xlsModule.Workbook();
    const sheet = workbook.Worksheets.get(0);

    // Add a straight line - solid, CadetBlue, weight 2, with arrow
    let line1 = sheet.Lines.AddLine({ row: 10, column: 2, width: 200, height: 1, lineShapeType: xlsModule.LineShapeType.Line });
    line1.DashStyle = xlsModule.ShapeDashLineStyleType.Solid;
    line1.Color = xlsModule.Color.get_CadetBlue();
    line1.Weight = 2;
    line1.EndArrowHeadStyle = xlsModule.ShapeArrowStyleType.LineArrow;

    // Add a curved line - dotted, OrangeRed, weight 2
    let line2 = sheet.Lines.AddLine({ row: 12, column: 2, width: 200, height: 1, lineShapeType: xlsModule.LineShapeType.CurveLine });
    line2.DashStyle = xlsModule.ShapeDashLineStyleType.Dotted;
    line2.Color = xlsModule.Color.get_OrangeRed();
    line2.Weight = 2;

    // Add an elbow connector - DashDotDot, Purple, weight 2
    let line3 = sheet.Lines.AddLine({ row: 14, column: 2, width: 200, height: 1, lineShapeType: xlsModule.LineShapeType.ElbowLine });
    line3.DashStyle = xlsModule.ShapeDashLineStyleType.DashDotDot;
    line3.Color = xlsModule.Color.get_Purple();
    line3.Weight = 2;

    // Add an inverted line - Dashed, Green, weight 2
    let line4 = sheet.Lines.AddLine({ row: 16, column: 2, width: 200, height: 1, lineShapeType: xlsModule.LineShapeType.LineInv });
    line4.DashStyle = xlsModule.ShapeDashLineStyleType.Dashed;
    line4.Color = xlsModule.Color.get_Green();
    line4.Weight = 2;

    // Save the workbook
    const outputFileName = 'AddLineShapes.xlsx';
    workbook.SaveToFile({ fileName: outputFileName, version: xlsModule.ExcelVersion.Version2010 });

    // Release resources
    workbook.Dispose();

    // Read the saved file from the VFS and trigger the download
    const fileArray = window.dotnetRuntime.Module.FS.readFile(outputFileName);
    const blob = new Blob([fileArray], { type: 'application/vnd.openxmlformats-officedocument.spreadsheetml.sheet' });
    const url = URL.createObjectURL(blob);
    const a = document.createElement('a');
    a.href = url;
    a.download = outputFileName;
    a.click();
    URL.revokeObjectURL(url);
  };

  return (
    <div style={{ textAlign: 'center', height: '300px' }}>
      <h1>Add Line Shapes</h1>
      <button onClick={addLineShapes}>Start</button>
    </div>
  );
}

export default App;
Quattro tipi di linea inseriti in un foglio di lavoro: retta, curva, a gomito e invertita
La prima linea imposta anche EndArrowHeadStyle, che le conferisce una punta di freccia all'estremità finale — Lines.AddLine() supporta un singolo stile di freccia all'estremità finale, ma non all'inizio. Per frecce su entrambe le estremità o un posizionamento preciso al pixel, usa invece TypedLines.AddLine(), trattato in Add Arrow Connectors in Excel in JavaScript (React).
Personalizzare l'aspetto delle linee
Tre proprietà controllano l'aspetto di una linea, e sono indipendenti — modificarne una non reimposta le altre:
| Proprietà | Cosa controlla | Valori di esempio |
|---|---|---|
DashStyle |
Il motivo del tratteggio del tratto | Solid, Dotted, Dashed, DashDotDot |
Color |
Il colore del tratto | Qualsiasi valore xlsModule.Color.get_*() |
Weight |
Lo spessore del tratto, in punti | 1, 2, 3 — un valore più alto è più spesso |
Lo stile del tratteggio è quello che vale la pena sperimentare. Una linea continua si legge come una connessione permanente; una linea punteggiata si legge come provvisoria o opzionale; una linea tratteggiata si legge come un confine. In un diagramma di flusso in cui alcune connessioni sono condizionali, usare Solid per il flusso principale e Dashed per i rami condizionali comunica la distinzione senza una legenda.
Posizionamento per riga e colonna
Lines.AddLine() posiziona una linea usando coordinate di riga e colonna, più una larghezza e un'altezza:
sheet.Lines.AddLine({ row: 10, column: 2, width: 200, height: 1, lineShapeType: xlsModule.LineShapeType.Line });
rowecolumnimpostano il punto di ancoraggio — dove inizia la linea.widthimposta l'estensione orizzontale in pixel.heightimposta l'estensione verticale in pixel. Un'altezza di1produce una linea orizzontale; una larghezza di1produce una linea verticale.
Questo è un sistema ibrido: l'ancoraggio è in unità del foglio di calcolo (righe e colonne), ma la dimensione è in pixel. Ciò rende semplice allineare una linea a una cella specifica — passa la riga e la colonna di quella cella — ma la lunghezza deve tenere conto delle larghezze delle colonne e delle altezze delle righe, che variano. Se hai bisogno del pieno controllo in pixel sia sulla posizione iniziale che sulla dimensione, TypedLines.AddLine() offre Top e Left in pixel.
Problemi comuni
La linea non è visibile nell'output.
Controlla Weight e Color. Uno spessore di 0 o un colore che corrisponde allo sfondo producono una linea invisibile. Verifica anche che row e column collochino la linea all'interno dell'intervallo utilizzato del foglio di lavoro — una linea ancorata alla riga 1000 su un foglio vuoto viene disegnata ma fuori dallo schermo.
Manca la punta di freccia.
EndArrowHeadStyle non è stato impostato, oppure è stato impostato a LineNoArrow. Assegna ShapeArrowStyleType.LineArrow per mostrare una punta di freccia all'estremità della linea. Lines.AddLine() non supporta BeginArrowHeadStyle — per frecce su entrambe le estremità, usa TypedLines.AddLine().
La linea a gomito va in una direzione inaspettata.
Un connettore a gomito si piega una volta, e la direzione della piega dipende dai valori di width e height. Una larghezza positiva con un'altezza positiva si piega verso il basso a destra; cambiare il segno di uno dei due valori cambia la direzione della piega. Sperimenta prima con valori piccoli per confermare la forma prima di impegnarti in un layout grande.
Le linee si sovrappongono o si impilano l'una sull'altra.
Ogni chiamata a AddLine crea una forma indipendente nella posizione specificata. Se due linee condividono la stessa row e column, si sovrappongono. Sfalsa il valore di row di 2 o più per ogni linea successiva, come fa l'esempio.
Domande frequenti
Qual è la differenza tra Lines.AddLine() e TypedLines.AddLine()?
Lines.AddLine() posiziona per riga e colonna e supporta una punta di freccia solo all'estremità finale. TypedLines.AddLine() posiziona per coordinate in pixel e supporta punte di freccia su entrambe le estremità. Per forme di linea di base senza frecce direzionali, Lines.AddLine() è più semplice. Per connettori che richiedono un posizionamento preciso o frecce bidirezionali, consulta Add Arrow Connectors in Excel in JavaScript (React).
Posso creare una linea verticale?
Sì. Imposta width a 1 e height a un valore positivo. La linea si estende verso il basso dal punto di ancoraggio.
Quante linee può contenere un singolo foglio di lavoro?
Non c'è un limite rigido nell'API. Ogni linea è un oggetto forma memorizzato nella raccolta di forme del foglio di lavoro, e il vincolo pratico è la dimensione del file e le prestazioni di rendering quando sono presenti centinaia di forme.
Le linee sopravvivono se il file viene aperto in Excel?
Sì. Le linee vengono memorizzate come oggetti forma standard nell'XML del foglio di lavoro. Excel le legge e le renderizza nativamente — non sono un artefatto di rendering specifico di Spire.XLS.
Posso recuperare e modificare linee già esistenti in una cartella di lavoro?
Sì. Attraversa la raccolta sheet.Shapes per accedere agli oggetti forma di linea, quindi modifica le loro proprietà tramite l'interfaccia ILineShape. Per l'eliminazione, usa sheet.Shapes.Remove(index).
Vedi anche
Insérer des formes de ligne dans Excel en JavaScript (React)
Table des matières
Une feuille de calcul n'est pas toujours qu'une simple grille de nombres. Parfois, c'est une toile — un organigramme esquissé entre des blocs de données, un diagramme de relations reliant des équipes à des projets, une légende pointant d'une note vers la cellule qu'elle annote. Dans chacun de ces cas, l'élément manquant est une ligne : un trait droit entre deux cases, un arc courbe autour d'une zone, un connecteur coudé qui plie une fois puis continue.
Spire.XLS for JavaScript offre à une application React la méthode sheet.Lines.AddLine() pour insérer des formes de ligne à une position spécifiée, avec quatre types de lignes disponibles via l'énumération LineShapeType et un contrôle total sur le style de tiret, la couleur et l'épaisseur. Tout s'exécute dans le navigateur sur WebAssembly — pas de backend, pas d'automatisation Excel, pas de téléversement de fichier.
Pour la configuration du projet, consultez Intégrer Spire.XLS for JavaScript dans un projet React. Les exemples ci-dessous supposent que le package est installé et que le module WebAssembly a été initialisé.
Quand une feuille de calcul a besoin de lignes
Les lignes dans une feuille de calcul répondent à trois grands objectifs, et le type de ligne que vous choisissez dépend de celui qui se présente à vous :
| Scénario | Ce que fait la ligne | Type de ligne typique |
|---|---|---|
| Organigramme entre des blocs de données | Relie une étape de processus à la suivante, parfois avec un coude | Droite ou coudée |
| Diagramme de relations | Relie des entités qui ne sont pas alignées dans une grille | Courbe |
| Limite de zone ou séparateur | Sépare une zone de la feuille d'une autre | Droite |
| Légende ou pointeur d'annotation | Attire l'attention d'une étiquette vers une cellule | Droite avec une pointe de flèche |
Le cas de la pointe de flèche — où la ligne doit indiquer une direction — utilise une API différente, TypedLines.AddLine(), qui prend en charge des styles de flèche aux deux extrémités et un positionnement précis au pixel près. Cela est traité séparément dans Ajouter des connecteurs fléchés dans Excel en JavaScript (React). Cet article se concentre sur Lines.AddLine(), qui gère les quatre formes de ligne principales et leur style visuel.
Prérequis
Vous avez besoin d'un projet React avec Spire.XLS for JavaScript installé et le module WebAssembly initialisé, accessible à window.wasmModule.spirexls. L'exemple charge une police dans le VFS pour la mesure du texte et enregistre avec l'indicateur de version Excel 2010.
Les quatre types de lignes
LineShapeType expose quatre formes, et la différence entre elles est géométrique — la manière dont la ligne se déplace de son début à sa fin :
Valeur de LineShapeType |
Forme | À quoi cela ressemble | Utilisez-la quand |
|---|---|---|---|
Line |
Ligne droite | Un seul trait du début à la fin | Vous reliez deux points sur la même ligne ou la même colonne |
CurveLine |
Ligne courbe | Un arc lisse entre le début et la fin | Vous contournez d'autres contenus ou montrez une relation non linéaire |
ElbowLine |
Connecteur coudé | Une ligne qui plie une fois à angle droit | Vous reliez des étapes d'organigramme qui ne sont pas directement alignées |
LineInv |
Ligne inversée | Une ligne droite avec une orientation inversée | Vous créez des mises en page en miroir ou des diagrammes de droite à gauche |
Les quatre sont créées par la même méthode — sheet.Lines.AddLine() — le paramètre lineShapeType déterminant celle qui est dessinée. Les propriétés d'apparence (DashStyle, Color, Weight) s'appliquent uniformément aux quatre.
Insérer des lignes dans une feuille de calcul
L'exemple insère un exemplaire de chaque type de ligne dans une nouvelle feuille de calcul, chacun avec un style de tiret et une couleur distincts afin que les quatre formes soient reconnaissables dans le résultat. Les étapes sont les suivantes :
- Créez un objet
Workbooket récupérez la première feuille de calcul. - Appelez
Worksheet.Lines.AddLine()quatre fois, en passant des paramètres de position et unLineShapeTypedifférent à chaque fois. - Personnalisez le
DashStyle, laColoret leWeightde chaque ligne. - Enregistrez le classeur avec
Workbook.SaveToFile().
function App() {
  const addLineShapes = async () => {
    // Get the Spire.XLS WASM module
    const xlsModule = window.wasmModule?.spirexls;

    // Check whether the module is ready
    if (!xlsModule) {
      alert('Spire.Xls is not ready yet');
      return;
    }

    // Load the font into the VFS for text measurement and column auto-fit
    await window.spire.FetchFileToVFS('ARIAL.TTF', '/Library/Fonts/', `${process.env.PUBLIC_URL}/font/`);

    // Create a new workbook and get the first worksheet
    const workbook = new xlsModule.Workbook();
    const sheet = workbook.Worksheets.get(0);

    // Add a straight line - solid, CadetBlue, weight 2, with arrow
    let line1 = sheet.Lines.AddLine({ row: 10, column: 2, width: 200, height: 1, lineShapeType: xlsModule.LineShapeType.Line });
    line1.DashStyle = xlsModule.ShapeDashLineStyleType.Solid;
    line1.Color = xlsModule.Color.get_CadetBlue();
    line1.Weight = 2;
    line1.EndArrowHeadStyle = xlsModule.ShapeArrowStyleType.LineArrow;

    // Add a curved line - dotted, OrangeRed, weight 2
    let line2 = sheet.Lines.AddLine({ row: 12, column: 2, width: 200, height: 1, lineShapeType: xlsModule.LineShapeType.CurveLine });
    line2.DashStyle = xlsModule.ShapeDashLineStyleType.Dotted;
    line2.Color = xlsModule.Color.get_OrangeRed();
    line2.Weight = 2;

    // Add an elbow connector - DashDotDot, Purple, weight 2
    let line3 = sheet.Lines.AddLine({ row: 14, column: 2, width: 200, height: 1, lineShapeType: xlsModule.LineShapeType.ElbowLine });
    line3.DashStyle = xlsModule.ShapeDashLineStyleType.DashDotDot;
    line3.Color = xlsModule.Color.get_Purple();
    line3.Weight = 2;

    // Add an inverted line - Dashed, Green, weight 2
    let line4 = sheet.Lines.AddLine({ row: 16, column: 2, width: 200, height: 1, lineShapeType: xlsModule.LineShapeType.LineInv });
    line4.DashStyle = xlsModule.ShapeDashLineStyleType.Dashed;
    line4.Color = xlsModule.Color.get_Green();
    line4.Weight = 2;

    // Save the workbook
    const outputFileName = 'AddLineShapes.xlsx';
    workbook.SaveToFile({ fileName: outputFileName, version: xlsModule.ExcelVersion.Version2010 });

    // Release resources
    workbook.Dispose();

    // Read the saved file from the VFS and trigger the download
    const fileArray = window.dotnetRuntime.Module.FS.readFile(outputFileName);
    const blob = new Blob([fileArray], { type: 'application/vnd.openxmlformats-officedocument.spreadsheetml.sheet' });
    const url = URL.createObjectURL(blob);
    const a = document.createElement('a');
    a.href = url;
    a.download = outputFileName;
    a.click();
    URL.revokeObjectURL(url);
  };

  return (
    <div style={{ textAlign: 'center', height: '300px' }}>
      <h1>Add Line Shapes</h1>
      <button onClick={addLineShapes}>Start</button>
    </div>
  );
}

export default App;
Quatre types de lignes insérés dans une feuille de calcul : droite, courbe, coudée et inversée
La première ligne définit également EndArrowHeadStyle, ce qui lui donne une pointe de flèche à la fin — Lines.AddLine() prend en charge un seul style de flèche à la fin, mais pas au début. Pour des flèches aux deux extrémités ou un positionnement précis au pixel près, utilisez plutôt TypedLines.AddLine(), traité dans Ajouter des connecteurs fléchés dans Excel en JavaScript (React).
Personnaliser l'apparence des lignes
Trois propriétés contrôlent l'apparence d'une ligne, et elles sont indépendantes — modifier l'une ne réinitialise pas les autres :
| Propriété | Ce qu'elle contrôle | Exemples de valeurs |
|---|---|---|
DashStyle |
Le motif de tirets du trait | Solid, Dotted, Dashed, DashDotDot |
Color |
La couleur du trait | Toute valeur xlsModule.Color.get_*() |
Weight |
L'épaisseur du trait, en points | 1, 2, 3 — plus la valeur est élevée, plus le trait est épais |
Le style de tiret est celui qui vaut la peine d'être expérimenté. Une ligne pleine se lit comme une connexion permanente ; une ligne pointillée se lit comme une connexion provisoire ou facultative ; une ligne en tirets se lit comme une limite. Dans un organigramme où certaines connexions sont conditionnelles, utiliser Solid pour le flux principal et Dashed pour les branches conditionnelles communique la distinction sans légende.
Positionnement par ligne et colonne
Lines.AddLine() place une ligne en utilisant des coordonnées de ligne et de colonne, plus une largeur et une hauteur :
sheet.Lines.AddLine({ row: 10, column: 2, width: 200, height: 1, lineShapeType: xlsModule.LineShapeType.Line });
rowetcolumndéfinissent le point d'ancrage — là où la ligne commence.widthdéfinit l'étendue horizontale en pixels.heightdéfinit l'étendue verticale en pixels. Une hauteur de1produit une ligne horizontale ; une largeur de1produit une ligne verticale.
Il s'agit d'un système hybride : l'ancre est exprimée en unités de feuille de calcul (lignes et colonnes), mais la taille est en pixels. Cela permet d'aligner facilement une ligne avec une cellule spécifique — passez la ligne et la colonne de cette cellule — mais la longueur doit tenir compte des largeurs de colonnes et des hauteurs de lignes, qui varient. Si vous avez besoin d'un contrôle total au pixel près sur la position de départ ainsi que sur la taille, TypedLines.AddLine() propose Top et Left en pixels.
Problèmes courants
La ligne n'est pas visible dans le résultat.
Vérifiez Weight et Color. Une épaisseur de 0 ou une couleur identique à l'arrière-plan produit une ligne invisible. Vérifiez également que row et column placent la ligne dans la plage utilisée de la feuille de calcul — une ligne ancrée à la ligne 1000 sur une feuille vide est dessinée mais hors écran.
La pointe de flèche est absente.
EndArrowHeadStyle n'a pas été défini, ou a été défini sur LineNoArrow. Attribuez ShapeArrowStyleType.LineArrow pour afficher une pointe de flèche à la fin de la ligne. Lines.AddLine() ne prend pas en charge BeginArrowHeadStyle — pour des flèches aux deux extrémités, utilisez TypedLines.AddLine().
La ligne coudée va dans une direction inattendue.
Un connecteur coudé plie une fois, et la direction du coude dépend des valeurs de width et height. Une largeur positive avec une hauteur positive plie vers le bas à droite ; changer le signe de l'une ou l'autre valeur change la direction du coude. Expérimentez d'abord avec de petites valeurs pour confirmer la forme avant de vous engager dans une grande mise en page.
Les lignes se chevauchent ou s'empilent les unes sur les autres.
Chaque appel à AddLine crée une forme indépendante à la position spécifiée. Si deux lignes partagent la même row et la même column, elles se chevauchent. Décalez la valeur de row de 2 ou plus pour chaque ligne successive, comme le fait l'exemple.
FAQ
Quelle est la différence entre Lines.AddLine() et TypedLines.AddLine() ?
Lines.AddLine() positionne par ligne et colonne et ne prend en charge une pointe de flèche qu'à la fin. TypedLines.AddLine() positionne par coordonnées en pixels et prend en charge des pointes de flèche aux deux extrémités. Pour des formes de ligne de base sans flèches directionnelles, Lines.AddLine() est plus simple. Pour des connecteurs nécessitant un placement précis ou des flèches bidirectionnelles, consultez Ajouter des connecteurs fléchés dans Excel en JavaScript (React).
Puis-je créer une ligne verticale ?
Oui. Définissez width sur 1 et height sur une valeur positive. La ligne s'étend vers le bas à partir du point d'ancrage.
Combien de lignes une seule feuille de calcul peut-elle contenir ?
Il n'y a pas de limite stricte dans l'API. Chaque ligne est un objet de forme stocké dans la collection de formes de la feuille de calcul, et la contrainte pratique est la taille du fichier et les performances de rendu lorsque des centaines de formes sont présentes.
Les lignes subsistent-elles si le fichier est ouvert dans Excel ?
Oui. Les lignes sont stockées comme des objets de forme standard dans le XML de la feuille de calcul. Excel les lit et les affiche nativement — ce ne sont pas des artefacts de rendu propres à Spire.XLS.
Puis-je récupérer et modifier des lignes qui existent déjà dans un classeur ?
Oui. Parcourez la collection sheet.Shapes pour accéder aux objets de forme de ligne, puis modifiez leurs propriétés via l'interface ILineShape. Pour la suppression, utilisez sheet.Shapes.Remove(index).
Voir aussi
Insertar formas de línea en Excel con JavaScript (React)
Tabla de contenidos
Una hoja de cálculo no siempre es solo una cuadrícula de números. A veces es un lienzo: un diagrama de flujo esbozado entre bloques de datos, un diagrama de relaciones que conecta equipos con proyectos, una llamada que señala desde una nota hasta la celda que anota. En todos estos casos, el elemento que falta es una línea: un trazo recto entre dos cuadros, un arco curvo alrededor de una región, un conector de codo que se dobla una vez y continúa.
Spire.XLS for JavaScript ofrece a una aplicación React el método sheet.Lines.AddLine() para insertar formas de línea en una posición especificada, con cuatro tipos de línea disponibles a través de la enumeración LineShapeType y control total sobre el estilo de guion, el color y el grosor. Todo se ejecuta en el navegador sobre WebAssembly: sin backend, sin automatización de Excel, sin carga de archivos.
Para la configuración del proyecto, consulte Integrar Spire.XLS for JavaScript en un proyecto de React. Los ejemplos a continuación asumen que el paquete está instalado y que el módulo WebAssembly se ha inicializado.
Cuándo una hoja de cálculo necesita líneas
Las líneas en una hoja de cálculo cumplen tres propósitos generales, y el tipo de línea que elija depende de cuál tenga delante:
| Escenario | Qué hace la línea | Tipo de línea típico |
|---|---|---|
| Diagrama de flujo entre bloques de datos | Conecta un paso del proceso con el siguiente, a veces con una curva | Recta o de codo |
| Diagrama de relaciones | Vincula entidades que no están alineadas en una cuadrícula | Curva |
| Límite o separador de región | Separa un área de la hoja de otra | Recta |
| Llamada o puntero de anotación | Atrae la atención desde una etiqueta hacia una celda | Recta con punta de flecha |
El caso de la punta de flecha —donde la línea necesita mostrar dirección— usa una API diferente, TypedLines.AddLine(), que admite estilos de flecha en ambos extremos y un posicionamiento con precisión de píxeles. Eso se trata por separado en Añadir conectores de flecha en Excel en JavaScript (React). Este artículo se centra en Lines.AddLine(), que maneja las cuatro formas de línea principales y su estilo visual.
Requisitos previos
Necesita un proyecto React con Spire.XLS for JavaScript instalado y el módulo WebAssembly inicializado, accesible en window.wasmModule.spirexls. El ejemplo carga una fuente en el VFS para la medición de texto y guarda con el indicador de versión de Excel 2010.
Los cuatro tipos de líneas
LineShapeType expone cuatro formas, y la diferencia entre ellas es geométrica: cómo recorre la línea desde su inicio hasta su final:
Valor de LineShapeType |
Forma | Cómo se ve | Úsela cuando |
|---|---|---|---|
Line |
Línea recta | Un único trazo desde el inicio hasta el final | Conectar dos puntos en la misma fila o columna |
CurveLine |
Línea curva | Un arco suave entre el inicio y el final | Rodear otro contenido o mostrar una relación no lineal |
ElbowLine |
Conector de codo | Una línea que se dobla una vez en ángulo recto | Pasos de un diagrama de flujo que no están alineados directamente |
LineInv |
Línea invertida | Una línea recta con orientación invertida | Diseños reflejados o diagramas de derecha a izquierda |
Las cuatro se crean con el mismo método —sheet.Lines.AddLine()—, y el parámetro lineShapeType selecciona cuál se dibuja. Las propiedades de apariencia (DashStyle, Color, Weight) se aplican a las cuatro por igual.
Insertar líneas en una hoja de cálculo
El ejemplo inserta una de cada tipo de línea en una hoja de cálculo nueva, cada una con un estilo de guion y un color distintos para que las cuatro formas se distingan en el resultado. Los pasos son:
- Cree un objeto
Workbooky obtenga la primera hoja de cálculo. - Llame a
Worksheet.Lines.AddLine()cuatro veces, pasando parámetros de posición y unLineShapeTypediferente cada vez. - Personalice el
DashStyle,ColoryWeightde cada línea. - Guarde el libro con
Workbook.SaveToFile().
function App() {
  const addLineShapes = async () => {
    // Get the Spire.XLS WASM module
    const xlsModule = window.wasmModule?.spirexls;

    // Check whether the module is ready
    if (!xlsModule) {
      alert('Spire.Xls is not ready yet');
      return;
    }

    // Load the font into the VFS for text measurement and column auto-fit
    await window.spire.FetchFileToVFS('ARIAL.TTF', '/Library/Fonts/', `${process.env.PUBLIC_URL}/font/`);

    // Create a new workbook and get the first worksheet
    const workbook = new xlsModule.Workbook();
    const sheet = workbook.Worksheets.get(0);

    // Add a straight line - solid, CadetBlue, weight 2, with arrow
    let line1 = sheet.Lines.AddLine({ row: 10, column: 2, width: 200, height: 1, lineShapeType: xlsModule.LineShapeType.Line });
    line1.DashStyle = xlsModule.ShapeDashLineStyleType.Solid;
    line1.Color = xlsModule.Color.get_CadetBlue();
    line1.Weight = 2;
    line1.EndArrowHeadStyle = xlsModule.ShapeArrowStyleType.LineArrow;

    // Add a curved line - dotted, OrangeRed, weight 2
    let line2 = sheet.Lines.AddLine({ row: 12, column: 2, width: 200, height: 1, lineShapeType: xlsModule.LineShapeType.CurveLine });
    line2.DashStyle = xlsModule.ShapeDashLineStyleType.Dotted;
    line2.Color = xlsModule.Color.get_OrangeRed();
    line2.Weight = 2;

    // Add an elbow connector - DashDotDot, Purple, weight 2
    let line3 = sheet.Lines.AddLine({ row: 14, column: 2, width: 200, height: 1, lineShapeType: xlsModule.LineShapeType.ElbowLine });
    line3.DashStyle = xlsModule.ShapeDashLineStyleType.DashDotDot;
    line3.Color = xlsModule.Color.get_Purple();
    line3.Weight = 2;

    // Add an inverted line - Dashed, Green, weight 2
    let line4 = sheet.Lines.AddLine({ row: 16, column: 2, width: 200, height: 1, lineShapeType: xlsModule.LineShapeType.LineInv });
    line4.DashStyle = xlsModule.ShapeDashLineStyleType.Dashed;
    line4.Color = xlsModule.Color.get_Green();
    line4.Weight = 2;

    // Save the workbook
    const outputFileName = 'AddLineShapes.xlsx';
    workbook.SaveToFile({ fileName: outputFileName, version: xlsModule.ExcelVersion.Version2010 });

    // Release resources
    workbook.Dispose();

    // Read the saved file from the VFS and trigger the download
    const fileArray = window.dotnetRuntime.Module.FS.readFile(outputFileName);
    const blob = new Blob([fileArray], { type: 'application/vnd.openxmlformats-officedocument.spreadsheetml.sheet' });
    const url = URL.createObjectURL(blob);
    const a = document.createElement('a');
    a.href = url;
    a.download = outputFileName;
    a.click();
    URL.revokeObjectURL(url);
  };

  return (
    <div style={{ textAlign: 'center', height: '300px' }}>
      <h1>Add Line Shapes</h1>
      <button onClick={addLineShapes}>Start</button>
    </div>
  );
}

export default App;
Cuatro tipos de líneas insertadas en una hoja de cálculo: recta, curva, de codo e invertida
La primera línea también establece EndArrowHeadStyle, lo que le da una punta de flecha al final; Lines.AddLine() admite un solo estilo de flecha al final, pero no al principio. Para flechas en ambos extremos o un posicionamiento con precisión de píxeles, use TypedLines.AddLine() en su lugar, tratado en Añadir conectores de flecha en Excel en JavaScript (React).
Personalizar la apariencia de las líneas
Tres propiedades controlan el aspecto de una línea, y son independientes: cambiar una no restablece las otras:
| Propiedad | Qué controla | Valores de ejemplo |
|---|---|---|
DashStyle |
El patrón de guiones del trazo | Solid, Dotted, Dashed, DashDotDot |
Color |
El color del trazo | Cualquier valor de xlsModule.Color.get_*() |
Weight |
El grosor del trazo, en puntos | 1, 2, 3: cuanto mayor, más grueso |
El estilo de guion es el que vale la pena experimentar. Una línea continua se interpreta como una conexión permanente; una línea punteada se interpreta como una conexión tentativa u opcional; una línea discontinua se interpreta como un límite. En un diagrama de flujo donde algunas conexiones son condicionales, usar Solid para el flujo principal y Dashed para las ramas condicionales comunica la distinción sin necesidad de una leyenda.
Posicionamiento por fila y columna
Lines.AddLine() coloca una línea usando coordenadas de fila y columna, además de un ancho y un alto:
sheet.Lines.AddLine({ row: 10, column: 2, width: 200, height: 1, lineShapeType: xlsModule.LineShapeType.Line });
rowycolumnestablecen el punto de anclaje: donde comienza la línea.widthestablece la extensión horizontal en píxeles.heightestablece la extensión vertical en píxeles. Un alto de1produce una línea horizontal; un ancho de1produce una vertical.
Se trata de un sistema híbrido: el anclaje está en unidades de hoja de cálculo (filas y columnas), pero el tamaño está en píxeles. Eso hace que sea sencillo alinear una línea con una celda específica —pase la fila y la columna de esa celda—, pero la longitud debe tener en cuenta los anchos de columna y las alturas de fila, que varían. Si necesita un control total en píxeles sobre la posición inicial además del tamaño, TypedLines.AddLine() ofrece Top y Left en píxeles.
Problemas comunes
La línea no es visible en el resultado.
Compruebe Weight y Color. Un grosor de 0 o un color que coincida con el fondo producen una línea invisible. Verifique también que row y column sitúen la línea dentro del rango usado de la hoja de cálculo: una línea anclada en la fila 1000 en una hoja vacía se dibuja, pero fuera de la pantalla.
Falta la punta de flecha.
No se estableció EndArrowHeadStyle, o se estableció en LineNoArrow. Asigne ShapeArrowStyleType.LineArrow para mostrar una punta de flecha al final de la línea. Lines.AddLine() no admite BeginArrowHeadStyle; para flechas en ambos extremos, use TypedLines.AddLine().
La línea de codo va en una dirección inesperada.
Un conector de codo se dobla una vez, y la dirección del doblez depende de los valores de width y height. Un ancho positivo con un alto positivo se dobla hacia abajo y a la derecha; cambiar el signo de cualquiera de los dos valores cambia la dirección del doblez. Experimente primero con valores pequeños para confirmar la forma antes de comprometerse con un diseño grande.
Las líneas se superponen o se apilan unas sobre otras.
Cada llamada a AddLine crea una forma independiente en la posición especificada. Si dos líneas comparten la misma row y column, se superponen. Desplace el valor de row en 2 o más para cada línea sucesiva, como hace el ejemplo.
Preguntas frecuentes
¿Cuál es la diferencia entre Lines.AddLine() y TypedLines.AddLine()?
Lines.AddLine() posiciona por fila y columna y solo admite una punta de flecha al final. TypedLines.AddLine() posiciona por coordenadas de píxeles y admite puntas de flecha en ambos extremos. Para formas de línea básicas sin flechas direccionales, Lines.AddLine() es más sencillo. Para conectores que necesitan una ubicación precisa o flechas bidireccionales, consulte Añadir conectores de flecha en Excel en JavaScript (React).
¿Puedo crear una línea vertical?
Sí. Establezca width en 1 y height en un valor positivo. La línea se extiende hacia abajo desde el punto de anclaje.
¿Cuántas líneas puede contener una sola hoja de cálculo?
No hay un límite estricto en la API. Cada línea es un objeto de forma almacenado en la colección de formas de la hoja de cálculo, y la limitación práctica es el tamaño del archivo y el rendimiento de representación cuando hay cientos de formas.
¿Las líneas se conservan si el archivo se abre en Excel?
Sí. Las líneas se almacenan como objetos de forma estándar en el XML de la hoja de cálculo. Excel las lee y las representa de forma nativa: no son un artefacto de representación específico de Spire.XLS.
¿Puedo recuperar y modificar líneas que ya existen en un libro?
Sí. Recorra la colección sheet.Shapes para acceder a los objetos de forma de línea y, a continuación, modifique sus propiedades a través de la interfaz ILineShape. Para eliminarlas, use sheet.Shapes.Remove(index).
Véase también
Linienformen in Excel mit JavaScript (React) einfügen
Ein Arbeitsblatt ist nicht immer nur ein Raster aus Zahlen. Manchmal ist es eine Leinwand – ein zwischen Datenblöcken skizziertes Flussdiagramm, ein Beziehungsdiagramm, das Teams mit Projekten verbindet, ein Callout, der von einer Notiz auf die Zelle zeigt, die er kommentiert. In all diesen Fällen ist das fehlende Element eine Linie: ein gerader Strich zwischen zwei Kästen, ein geschwungener Bogen um einen Bereich, ein Ellbogen-Verbinder, der einmal abknickt und weiterläuft.
Spire.XLS for JavaScript bietet einer React-App die Methode sheet.Lines.AddLine() zum Einfügen von Linienformen an einer bestimmten Position, mit vier Linientypen, die über die Enumeration LineShapeType verfügbar sind, und voller Kontrolle über Strichstil, Farbe und Stärke. Alles läuft im Browser auf WebAssembly – kein Backend, keine Excel-Automatisierung, kein Datei-Upload.
Zur Projekteinrichtung siehe Integrating Spire.XLS for JavaScript in a React Project. Die folgenden Beispiele setzen voraus, dass das Paket installiert und das WebAssembly-Modul initialisiert wurde.
Wann ein Arbeitsblatt Linien benötigt
Linien in einem Arbeitsblatt dienen drei übergeordneten Zwecken, und der Linientyp, zu dem Sie greifen, hängt davon ab, welcher davon gerade vor Ihnen liegt:
| Szenario | Was die Linie bewirkt | Typischer Linientyp |
|---|---|---|
| Flussdiagramm zwischen Datenblöcken | Verbindet einen Prozessschritt mit dem nächsten, manchmal mit einer Biegung | Gerade oder Ellbogen |
| Beziehungsdiagramm | Verbindet Entitäten, die nicht in einem Raster ausgerichtet sind | Geschwungen |
| Bereichsgrenze oder Trennlinie | Trennt einen Bereich des Blatts von einem anderen | Gerade |
| Callout- oder Anmerkungszeiger | Lenkt die Aufmerksamkeit von einer Beschriftung auf eine Zelle | Gerade mit Pfeilspitze |
Der Fall mit der Pfeilspitze – bei dem die Linie eine Richtung anzeigen muss – verwendet eine andere API, TypedLines.AddLine(), die Pfeilstile an beiden Enden und pixelgenaue Positionierung unterstützt. Dies wird separat behandelt in Add Arrow Connectors in Excel in JavaScript (React). Dieser Artikel konzentriert sich auf Lines.AddLine(), das die vier grundlegenden Linienformen und ihre visuelle Gestaltung abdeckt.
Voraussetzungen
Sie benötigen ein React-Projekt mit installiertem Spire.XLS for JavaScript und initialisiertem WebAssembly-Modul, erreichbar unter window.wasmModule.spirexls. Das Beispiel lädt eine Schriftart in das VFS zur Textmessung und speichert mit dem Excel-2010-Versionsflag.
Die vier Linientypen
LineShapeType stellt vier Formen bereit, und der Unterschied zwischen ihnen ist geometrisch – wie die Linie von ihrem Anfang zu ihrem Ende verläuft:
LineShapeType-Wert |
Form | Wie sie aussieht | Wann Sie dazu greifen |
|---|---|---|---|
Line |
Gerade Linie | Ein einzelner Strich von Anfang bis Ende | Verbinden zweier Punkte in derselben Zeile oder Spalte |
CurveLine |
Geschwungene Linie | Ein sanfter Bogen zwischen Anfang und Ende | Um andere Inhalte herumführen oder eine nichtlineare Beziehung darstellen |
ElbowLine |
Ellbogen-Verbinder | Eine Linie, die einmal im rechten Winkel abknickt | Flussdiagrammschritte, die nicht direkt ausgerichtet sind |
LineInv |
Umgekehrte Linie | Eine gerade Linie mit umgekehrter Ausrichtung | Spiegel-Layouts oder Rechts-nach-links-Diagramme |
Alle vier werden durch dieselbe Methode erstellt – sheet.Lines.AddLine() –, wobei der Parameter lineShapeType auswählt, welche gezeichnet wird. Die Erscheinungseigenschaften (DashStyle, Color, Weight) gelten für alle vier gleichermaßen.
Linien in ein Arbeitsblatt einfügen
Das Beispiel fügt je einen Vertreter jedes Linientyps in ein neues Arbeitsblatt ein, jeder mit einem eigenen Strichstil und einer eigenen Farbe, damit die vier Formen in der Ausgabe unterscheidbar sind. Die Schritte sind:
- Ein
Workbook-Objekt erstellen und das erste Arbeitsblatt abrufen. Worksheet.Lines.AddLine()viermal aufrufen und dabei jeweils Positionsparameter und einen anderenLineShapeTypeübergeben.DashStyle,ColorundWeightjeder Linie anpassen.- Die Arbeitsmappe mit
Workbook.SaveToFile()speichern.
function App() {
  const addLineShapes = async () => {
    // Get the Spire.XLS WASM module
    const xlsModule = window.wasmModule?.spirexls;

    // Check whether the module is ready
    if (!xlsModule) {
      alert('Spire.Xls is not ready yet');
      return;
    }

    // Load the font into the VFS for text measurement and column auto-fit
    await window.spire.FetchFileToVFS('ARIAL.TTF', '/Library/Fonts/', `${process.env.PUBLIC_URL}/font/`);

    // Create a new workbook and get the first worksheet
    const workbook = new xlsModule.Workbook();
    const sheet = workbook.Worksheets.get(0);

    // Add a straight line - solid, CadetBlue, weight 2, with arrow
    let line1 = sheet.Lines.AddLine({ row: 10, column: 2, width: 200, height: 1, lineShapeType: xlsModule.LineShapeType.Line });
    line1.DashStyle = xlsModule.ShapeDashLineStyleType.Solid;
    line1.Color = xlsModule.Color.get_CadetBlue();
    line1.Weight = 2;
    line1.EndArrowHeadStyle = xlsModule.ShapeArrowStyleType.LineArrow;

    // Add a curved line - dotted, OrangeRed, weight 2
    let line2 = sheet.Lines.AddLine({ row: 12, column: 2, width: 200, height: 1, lineShapeType: xlsModule.LineShapeType.CurveLine });
    line2.DashStyle = xlsModule.ShapeDashLineStyleType.Dotted;
    line2.Color = xlsModule.Color.get_OrangeRed();
    line2.Weight = 2;

    // Add an elbow connector - DashDotDot, Purple, weight 2
    let line3 = sheet.Lines.AddLine({ row: 14, column: 2, width: 200, height: 1, lineShapeType: xlsModule.LineShapeType.ElbowLine });
    line3.DashStyle = xlsModule.ShapeDashLineStyleType.DashDotDot;
    line3.Color = xlsModule.Color.get_Purple();
    line3.Weight = 2;

    // Add an inverted line - Dashed, Green, weight 2
    let line4 = sheet.Lines.AddLine({ row: 16, column: 2, width: 200, height: 1, lineShapeType: xlsModule.LineShapeType.LineInv });
    line4.DashStyle = xlsModule.ShapeDashLineStyleType.Dashed;
    line4.Color = xlsModule.Color.get_Green();
    line4.Weight = 2;

    // Save the workbook
    const outputFileName = 'AddLineShapes.xlsx';
    workbook.SaveToFile({ fileName: outputFileName, version: xlsModule.ExcelVersion.Version2010 });

    // Release resources
    workbook.Dispose();

    // Read the saved file from the VFS and trigger the download
    const fileArray = window.dotnetRuntime.Module.FS.readFile(outputFileName);
    const blob = new Blob([fileArray], { type: 'application/vnd.openxmlformats-officedocument.spreadsheetml.sheet' });
    const url = URL.createObjectURL(blob);
    const a = document.createElement('a');
    a.href = url;
    a.download = outputFileName;
    a.click();
    URL.revokeObjectURL(url);
  };

  return (
    <div style={{ textAlign: 'center', height: '300px' }}>
      <h1>Add Line Shapes</h1>
      <button onClick={addLineShapes}>Start</button>
    </div>
  );
}

export default App;
Vier Linientypen, die in ein Arbeitsblatt eingefügt wurden: gerade, geschwungen, Ellbogen und umgekehrt
Die erste Linie legt außerdem EndArrowHeadStyle fest, wodurch sie am Ende eine Pfeilspitze erhält – Lines.AddLine() unterstützt einen einzelnen Pfeilstil am Ende, aber nicht am Anfang. Für Pfeile an beiden Enden oder pixelgenaue Positionierung verwenden Sie stattdessen TypedLines.AddLine(), behandelt in Add Arrow Connectors in Excel in JavaScript (React).
Das Erscheinungsbild von Linien anpassen
Drei Eigenschaften steuern, wie eine Linie aussieht, und sie sind unabhängig voneinander – das Ändern einer setzt die anderen nicht zurück:
| Eigenschaft | Was sie steuert | Beispielwerte |
|---|---|---|
DashStyle |
Das Strichmuster des Linienzugs | Solid, Dotted, Dashed, DashDotDot |
Color |
Die Farbe des Linienzugs | Jeder xlsModule.Color.get_*()-Wert |
Weight |
Die Dicke des Linienzugs in Punkten | 1, 2, 3 – höher ist dicker |
Der Strichstil ist derjenige, mit dem es sich zu experimentieren lohnt. Eine durchgezogene Linie wirkt wie eine dauerhafte Verbindung; eine gepunktete Linie wirkt wie eine vorläufige oder optionale; eine gestrichelte Linie wirkt wie eine Grenze. In einem Flussdiagramm, in dem einige Verbindungen bedingt sind, vermittelt die Verwendung von Solid für den Hauptfluss und Dashed für die bedingten Verzweigungen den Unterschied ohne Legende.
Positionierung nach Zeile und Spalte
Lines.AddLine() platziert eine Linie anhand von Zeilen- und Spaltenkoordinaten sowie einer Breite und Höhe:
sheet.Lines.AddLine({ row: 10, column: 2, width: 200, height: 1, lineShapeType: xlsModule.LineShapeType.Line });
rowundcolumnlegen den Ankerpunkt fest – wo die Linie beginnt.widthlegt die horizontale Ausdehnung in Pixeln fest.heightlegt die vertikale Ausdehnung in Pixeln fest. Eine Höhe von1erzeugt eine horizontale Linie; eine Breite von1erzeugt eine vertikale.
Dies ist ein hybrides System: Der Anker wird in Tabellenkalkulationseinheiten (Zeilen und Spalten) angegeben, die Größe jedoch in Pixeln. Das macht es einfach, eine Linie an einer bestimmten Zelle auszurichten – übergeben Sie einfach deren Zeile und Spalte –, aber die Länge muss Spaltenbreiten und Zeilenhöhen berücksichtigen, die variieren. Wenn Sie volle pixelgenaue Kontrolle sowohl über die Startposition als auch über die Größe benötigen, bietet TypedLines.AddLine() Top und Left in Pixeln.
Häufige Probleme
Die Linie ist in der Ausgabe nicht sichtbar.
Prüfen Sie Weight und Color. Eine Stärke von 0 oder eine Farbe, die dem Hintergrund entspricht, erzeugt eine unsichtbare Linie. Vergewissern Sie sich außerdem, dass row und column die Linie innerhalb des verwendeten Bereichs des Arbeitsblatts platzieren – eine in Zeile 1000 auf einem leeren Blatt verankerte Linie wird gezeichnet, liegt aber außerhalb des sichtbaren Bereichs.
Die Pfeilspitze fehlt.
EndArrowHeadStyle wurde nicht festgelegt oder auf LineNoArrow gesetzt. Weisen Sie ShapeArrowStyleType.LineArrow zu, um am Ende der Linie eine Pfeilspitze anzuzeigen. Lines.AddLine() unterstützt BeginArrowHeadStyle nicht – für Pfeile an beiden Enden verwenden Sie TypedLines.AddLine().
Die Ellbogen-Linie verläuft in eine unerwartete Richtung.
Ein Ellbogen-Verbinder knickt einmal ab, und die Richtung der Biegung hängt von den Werten für width und height ab. Eine positive Breite mit einer positiven Höhe knickt nach rechts unten ab; ändert man das Vorzeichen eines der beiden Werte, ändert sich die Biegerichtung. Experimentieren Sie zunächst mit kleinen Werten, um die Form zu bestätigen, bevor Sie sich auf ein großes Layout festlegen.
Linien überlappen oder stapeln sich übereinander.
Jeder Aufruf von AddLine erzeugt eine unabhängige Form an der angegebenen Position. Wenn zwei Linien dieselbe row und column teilen, überlappen sie sich. Versetzen Sie den row-Wert für jede nachfolgende Linie um 2 oder mehr, wie es das Beispiel tut.
FAQ
Was ist der Unterschied zwischen Lines.AddLine() und TypedLines.AddLine()?
Lines.AddLine() positioniert nach Zeile und Spalte und unterstützt eine Pfeilspitze nur am Ende. TypedLines.AddLine() positioniert nach Pixelkoordinaten und unterstützt Pfeilspitzen an beiden Enden. Für einfache Linienformen ohne Richtungspfeile ist Lines.AddLine() einfacher. Für Verbinder, die eine präzise Platzierung oder bidirektionale Pfeile benötigen, siehe Add Arrow Connectors in Excel in JavaScript (React).
Kann ich eine vertikale Linie erstellen?
Ja. Setzen Sie width auf 1 und height auf einen positiven Wert. Die Linie erstreckt sich vom Ankerpunkt nach unten.
Wie viele Linien kann ein einzelnes Arbeitsblatt enthalten?
In der API gibt es keine feste Grenze. Jede Linie ist ein Formobjekt, das in der Formensammlung des Arbeitsblatts gespeichert ist, und die praktische Einschränkung sind Dateigröße und Rendering-Leistung, wenn Hunderte von Formen vorhanden sind.
Bleiben die Linien erhalten, wenn die Datei in Excel geöffnet wird?
Ja. Linien werden als Standard-Formobjekte im XML des Arbeitsblatts gespeichert. Excel liest und rendert sie nativ – sie sind kein Rendering-Artefakt, das spezifisch für Spire.XLS ist.
Kann ich Linien abrufen und ändern, die bereits in einer Arbeitsmappe vorhanden sind?
Ja. Durchlaufen Sie die Sammlung sheet.Shapes, um auf Linienformobjekte zuzugreifen, und ändern Sie anschließend deren Eigenschaften über die Schnittstelle ILineShape. Zum Löschen verwenden Sie sheet.Shapes.Remove(index).
Siehe auch
Вставка линий (фигур) в Excel на JavaScript (React)
Лист — это не всегда просто сетка чисел. Иногда это холст — блок-схема, набросанная между блоками данных, диаграмма связей, соединяющая команды с проектами, выноска, указывающая от примечания к ячейке, которую оно поясняет. Во всех этих случаях недостающий элемент — это линия: прямая черта между двумя блоками, изогнутая дуга вокруг области, угловой соединитель, который один раз изгибается и продолжается.
Spire.XLS for JavaScript предоставляет React-приложению метод sheet.Lines.AddLine() для вставки фигур-линий в заданной позиции, с четырьмя типами линий, доступными через перечисление LineShapeType, и полным контролем над стилем штриха, цветом и толщиной. Всё работает в браузере на WebAssembly — без серверной части, без автоматизации Excel, без загрузки файлов.
По настройке проекта см. Интеграция Spire.XLS for JavaScript в проект React. Приведённые ниже примеры предполагают, что пакет установлен, а модуль WebAssembly инициализирован.
Когда на листе нужны линии
Линии на листе служат трём основным целям, и выбор типа линии зависит от того, с какой из них вы имеете дело:
| Сценарий | Что делает линия | Типичный тип линии |
|---|---|---|
| Блок-схема между блоками данных | Соединяет этап процесса со следующим, иногда с изгибом | Прямая или угловая |
| Диаграмма связей | Связывает сущности, не выровненные по сетке | Изогнутая |
| Граница области или разделитель | Отделяет одну область листа от другой | Прямая |
| Выноска или указатель-аннотация | Привлекает внимание от подписи к ячейке | Прямая со стрелкой на конце |
Случай со стрелкой — когда линия должна показывать направление — использует другой API, TypedLines.AddLine(), который поддерживает стили стрелок на обоих концах и позиционирование с точностью до пикселя. Это рассматривается отдельно в статье Добавление соединителей со стрелками в Excel на JavaScript (React). Данная статья посвящена Lines.AddLine(), который работает с четырьмя основными формами линий и их визуальным оформлением.
Предварительные требования
Вам нужен проект React с установленным Spire.XLS for JavaScript и инициализированным модулем WebAssembly, доступным по адресу window.wasmModule.spirexls. Пример загружает шрифт в VFS для измерения текста и сохраняет файл с флагом версии Excel 2010.
Четыре типа линий
LineShapeType предоставляет четыре фигуры, и разница между ними геометрическая — как линия проходит от начала до конца:
Значение LineShapeType |
Форма | Как выглядит | Когда её выбирать |
|---|---|---|---|
Line |
Прямая линия | Одна черта от начала до конца | Соединение двух точек в одной строке или столбце |
CurveLine |
Изогнутая линия | Плавная дуга между началом и концом | Обход другого содержимого или отображение нелинейной связи |
ElbowLine |
Угловой соединитель | Линия, которая один раз изгибается под прямым углом | Этапы блок-схемы, которые не выровнены напрямую |
LineInv |
Инвертированная линия | Прямая линия с инвертированной ориентацией | Зеркальные макеты или диаграммы с направлением справа налево |
Все четыре создаются одним и тем же методом — sheet.Lines.AddLine() — при этом параметр lineShapeType определяет, какая именно будет нарисована. Свойства внешнего вида (DashStyle, Color, Weight) применяются ко всем четырём одинаково.
Вставка линий на лист
В примере на новый лист вставляется по одной линии каждого типа, каждая с отдельным стилем штриха и цветом, чтобы четыре фигуры различались в выводе. Шаги следующие:
- Создайте объект
Workbookи получите первый лист. - Вызовите
Worksheet.Lines.AddLine()четыре раза, передавая параметры позиции и каждый раз другойLineShapeType. - Настройте
DashStyle,ColorиWeightдля каждой линии. - Сохраните книгу с помощью
Workbook.SaveToFile().
function App() {
  const addLineShapes = async () => {
    // Get the Spire.XLS WASM module
    const xlsModule = window.wasmModule?.spirexls;

    // Check whether the module is ready
    if (!xlsModule) {
      alert('Spire.Xls is not ready yet');
      return;
    }

    // Load the font into the VFS for text measurement and column auto-fit
    await window.spire.FetchFileToVFS('ARIAL.TTF', '/Library/Fonts/', `${process.env.PUBLIC_URL}/font/`);

    // Create a new workbook and get the first worksheet
    const workbook = new xlsModule.Workbook();
    const sheet = workbook.Worksheets.get(0);

    // Add a straight line - solid, CadetBlue, weight 2, with arrow
    let line1 = sheet.Lines.AddLine({ row: 10, column: 2, width: 200, height: 1, lineShapeType: xlsModule.LineShapeType.Line });
    line1.DashStyle = xlsModule.ShapeDashLineStyleType.Solid;
    line1.Color = xlsModule.Color.get_CadetBlue();
    line1.Weight = 2;
    line1.EndArrowHeadStyle = xlsModule.ShapeArrowStyleType.LineArrow;

    // Add a curved line - dotted, OrangeRed, weight 2
    let line2 = sheet.Lines.AddLine({ row: 12, column: 2, width: 200, height: 1, lineShapeType: xlsModule.LineShapeType.CurveLine });
    line2.DashStyle = xlsModule.ShapeDashLineStyleType.Dotted;
    line2.Color = xlsModule.Color.get_OrangeRed();
    line2.Weight = 2;

    // Add an elbow connector - DashDotDot, Purple, weight 2
    let line3 = sheet.Lines.AddLine({ row: 14, column: 2, width: 200, height: 1, lineShapeType: xlsModule.LineShapeType.ElbowLine });
    line3.DashStyle = xlsModule.ShapeDashLineStyleType.DashDotDot;
    line3.Color = xlsModule.Color.get_Purple();
    line3.Weight = 2;

    // Add an inverted line - Dashed, Green, weight 2
    let line4 = sheet.Lines.AddLine({ row: 16, column: 2, width: 200, height: 1, lineShapeType: xlsModule.LineShapeType.LineInv });
    line4.DashStyle = xlsModule.ShapeDashLineStyleType.Dashed;
    line4.Color = xlsModule.Color.get_Green();
    line4.Weight = 2;

    // Save the workbook
    const outputFileName = 'AddLineShapes.xlsx';
    workbook.SaveToFile({ fileName: outputFileName, version: xlsModule.ExcelVersion.Version2010 });

    // Release resources
    workbook.Dispose();

    // Read the saved file from the VFS and trigger the download
    const fileArray = window.dotnetRuntime.Module.FS.readFile(outputFileName);
    const blob = new Blob([fileArray], { type: 'application/vnd.openxmlformats-officedocument.spreadsheetml.sheet' });
    const url = URL.createObjectURL(blob);
    const a = document.createElement('a');
    a.href = url;
    a.download = outputFileName;
    a.click();
    URL.revokeObjectURL(url);
  };

  return (
    <div style={{ textAlign: 'center', height: '300px' }}>
      <h1>Add Line Shapes</h1>
      <button onClick={addLineShapes}>Start</button>
    </div>
  );
}

export default App;
Четыре типа линий, вставленных на лист: прямая, изогнутая, угловая и инвертированная
Первая линия также задаёт EndArrowHeadStyle, что добавляет ей стрелку на конце — Lines.AddLine() поддерживает один стиль стрелки на конце, но не в начале. Для стрелок на обоих концах или позиционирования с точностью до пикселя используйте вместо этого TypedLines.AddLine(), что рассматривается в статье Добавление соединителей со стрелками в Excel на JavaScript (React).
Настройка внешнего вида линий
Внешний вид линии определяют три свойства, и они независимы — изменение одного не сбрасывает остальные:
| Свойство | Что оно контролирует | Примеры значений |
|---|---|---|
DashStyle |
Шаблон штриха линии | Solid, Dotted, Dashed, DashDotDot |
Color |
Цвет линии | Любое значение xlsModule.Color.get_*() |
Weight |
Толщина линии в пунктах | 1, 2, 3 — чем больше, тем толще |
Стиль штриха — то, с чем стоит экспериментировать. Сплошная линия воспринимается как постоянная связь; пунктирная линия — как предварительная или необязательная; штриховая линия — как граница. В блок-схеме, где некоторые связи условны, использование Solid для основного потока и Dashed для условных ветвей передаёт это различие без легенды.
Позиционирование по строке и столбцу
Lines.AddLine() размещает линию, используя координаты строки и столбца, а также ширину и высоту:
sheet.Lines.AddLine({ row: 10, column: 2, width: 200, height: 1, lineShapeType: xlsModule.LineShapeType.Line });
rowиcolumnзадают точку привязки — место начала линии.widthзадаёт горизонтальную протяжённость в пикселях.heightзадаёт вертикальную протяжённость в пикселях. Высота1даёт горизонтальную линию; ширина1даёт вертикальную.
Это гибридная система: привязка задаётся в единицах таблицы (строки и столбцы), а размер — в пикселях. Это упрощает выравнивание линии по конкретной ячейке — передайте строку и столбец этой ячейки — но при определении длины нужно учитывать ширину столбцов и высоту строк, которые различаются. Если вам нужен полный пиксельный контроль как над начальной позицией, так и над размером, TypedLines.AddLine() предлагает Top и Left в пикселях.
Типичные проблемы
Линия не видна в выводе.
Проверьте Weight и Color. Толщина 0 или цвет, совпадающий с фоном, делают линию невидимой. Также убедитесь, что row и column размещают линию в пределах используемого диапазона листа — линия, привязанная к строке 1000 на пустом листе, рисуется, но оказывается за пределами экрана.
Отсутствует стрелка.
Свойство EndArrowHeadStyle не задано или установлено в LineNoArrow. Присвойте ShapeArrowStyleType.LineArrow, чтобы показать стрелку на конце линии. Lines.AddLine() не поддерживает BeginArrowHeadStyle — для стрелок на обоих концах используйте TypedLines.AddLine().
Угловая линия идёт в неожиданном направлении.
Угловой соединитель изгибается один раз, и направление изгиба зависит от значений width и height. Положительная ширина с положительной высотой даёт изгиб вниз-вправо; изменение знака любого из значений меняет направление изгиба. Сначала поэкспериментируйте с небольшими значениями, чтобы убедиться в форме, прежде чем переходить к большому макету.
Линии перекрываются или накладываются друг на друга.
Каждый вызов AddLine создаёт независимую фигуру в указанной позиции. Если две линии имеют одинаковые row и column, они перекрываются. Смещайте значение row на 2 или более для каждой последующей линии, как это сделано в примере.
Часто задаваемые вопросы
В чём разница между Lines.AddLine() и TypedLines.AddLine()?
Lines.AddLine() позиционирует по строке и столбцу и поддерживает стрелку только на конце. TypedLines.AddLine() позиционирует по пиксельным координатам и поддерживает стрелки на обоих концах. Для базовых форм линий без направляющих стрелок Lines.AddLine() проще. Для соединителей, которым нужно точное размещение или двунаправленные стрелки, см. Добавление соединителей со стрелками в Excel на JavaScript (React).
Можно ли создать вертикальную линию?
Да. Задайте width равным 1, а height — положительным значением. Линия простирается вниз от точки привязки.
Сколько линий может содержать один лист?
В API нет жёсткого ограничения. Каждая линия — это объект-фигура, хранящийся в коллекции фигур листа, а практическое ограничение — размер файла и производительность отрисовки при наличии сотен фигур.
Сохранятся ли линии, если файл открыть в Excel?
Да. Линии хранятся как стандартные объекты-фигуры в XML листа. Excel читает и отображает их нативно — это не артефакт отрисовки, специфичный для Spire.XLS.
Можно ли получить и изменить линии, уже существующие в книге?
Да. Пройдите по коллекции sheet.Shapes, чтобы получить доступ к объектам-фигурам линий, затем измените их свойства через интерфейс ILineShape. Для удаления используйте sheet.Shapes.Remove(index).