When a process, hierarchy, or cycle is written as a list of sentences, readers have to compare line after line to work out the order and the relationships. A SmartArt graphic arranges the nodes according to a layout and draws the connections directly, and it re-flows as nodes are added to it. Drawing the same diagram by hand in PowerPoint is slow and makes consistent spacing and alignment hard to keep.
This article uses Spire.Presentation for JavaScript to create and adjust SmartArt graphics in PowerPoint in the browser. The whole process runs locally on the user's device through WebAssembly, requires no Office installation and no back-end service, and the presentation never leaves the browser.
The article covers two features:
For installation and project configuration, see Integrating Spire.Presentation for JavaScript in a React Project. The examples below assume that Spire.Presentation for JavaScript is installed and the WebAssembly module has been initialized.
Create SmartArt Graphics in PowerPoint
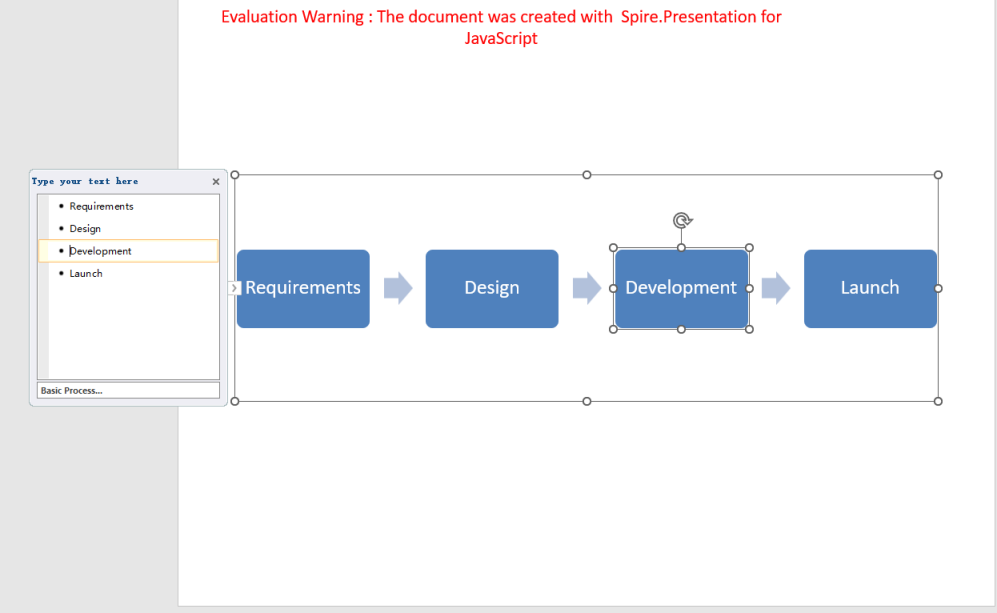
To create SmartArt graphics in PowerPoint, start by choosing a layout that matches the relationship in the content, then write the text into the nodes. The layout decides how the nodes are arranged and where the connectors run; it is specified once at creation, and only the node text needs to be maintained afterwards. Once inserted, the graphic can still be moved and resized like any other shape.
| What you write | What you get |
|---|---|
slide.Shapes.AppendSmartArt(x, y, width, height, layoutType) |
Adds a SmartArt graphic of the given layout at the specified position and size |
smartArt.Nodes.Count |
The number of nodes currently in the graphic |
smartArt.Nodes.RemoveNode({ index: i }) |
Removes the node at index i |
smartArt.Nodes.AddNode() |
Appends a node to the end of the node collection |
node.TextFrame.Text |
Sets or reads the text of a node |
The steps are:
- Get the Spire.Presentation WASM module, make sure it is ready, and load the font file and the presentation into the VFS.
- Create a
Presentationobject, callLoadFromFile()to load the presentation, and useSlides.get_Item()to get the slide that will hold the graphic. - Call
Shapes.AppendSmartArt()with the position, size, and aSmartArtLayoutTypeto get theISmartArtobject. - Walk from
Nodes.Countdownwards and callNodes.RemoveNode()to remove the placeholder nodes that come with the layout. - Call
Nodes.AddNode()in order and write the text throughTextFrame.Text. - Call
Presentation.SaveToFile()to save the result, release the presentation withDispose(), then read the file from the VFS and trigger the download.
The code for creating SmartArt graphics in PowerPoint is shown below:
function App() {
  const createSmartArt = async () => {
    // Get the Spire.Presentation WASM module
    const pptModule = window.wasmModule?.spirepresentation;

    // Check that the module is ready
    if (!pptModule) {
      alert('Spire.Presentation is not ready yet');
      return;
    }

    // Load the font and the presentation into the VFS
    await window.spire.FetchFileToVFS('ARIAL.TTF', '/Library/Fonts/', `${process.env.PUBLIC_URL}/font/`);
    const inputFileName = 'SmartArt.pptx';
    await window.spire.FetchFileToVFS(inputFileName, '', `${process.env.PUBLIC_URL}data/`);

    // Load the presentation and get the first slide
    const ppt = new pptModule.Presentation();
    ppt.LoadFromFile(inputFileName);
    const slide = ppt.Slides.get_Item(0);

    // Add a process-layout SmartArt at the specified position and size
    const smartArt = slide.Shapes.AppendSmartArt(50, 160, 620, 200, pptModule.SmartArtLayoutType.BasicProcess);

    // Remove the placeholder nodes that come with the layout
    for (let i = smartArt.Nodes.Count - 1; i >= 0; i--) {
      smartArt.Nodes.RemoveNode({ index: i });
    }

    // Add the nodes in process order and write their text
    const steps = ['Requirements', 'Design', 'Development', 'Launch'];
    for (const text of steps) {
      const node = smartArt.Nodes.AddNode();
      node.TextFrame.Text = text;
    }

    // Save the result file
    const outputFileName = 'CreateSmartArt.pptx';
    ppt.SaveToFile({ file: outputFileName, fileFormat: pptModule.FileFormat.Pptx2013 });
    ppt.Dispose();

    // Read the generated file from the VFS and trigger the download
    const fileArray = window.dotnetRuntime.Module.FS.readFile(outputFileName);
    const blob = new Blob([fileArray], { type: 'application/vnd.openxmlformats-officedocument.presentationml.presentation' });
    const url = URL.createObjectURL(blob);
    const a = document.createElement('a');
    a.href = url;
    a.download = outputFileName;
    a.click();
    URL.revokeObjectURL(url);
  };

  return (
    <div style={{ textAlign: 'center', height: '300px' }}>
      <h1>Create SmartArt Graphics</h1>
      <button onClick={createSmartArt}>
        Create SmartArt
      </button>
    </div>
  );
}

export default App;
Presentation after creating a SmartArt graphic in PowerPoint:
Add Nodes to a SmartArt Graphic
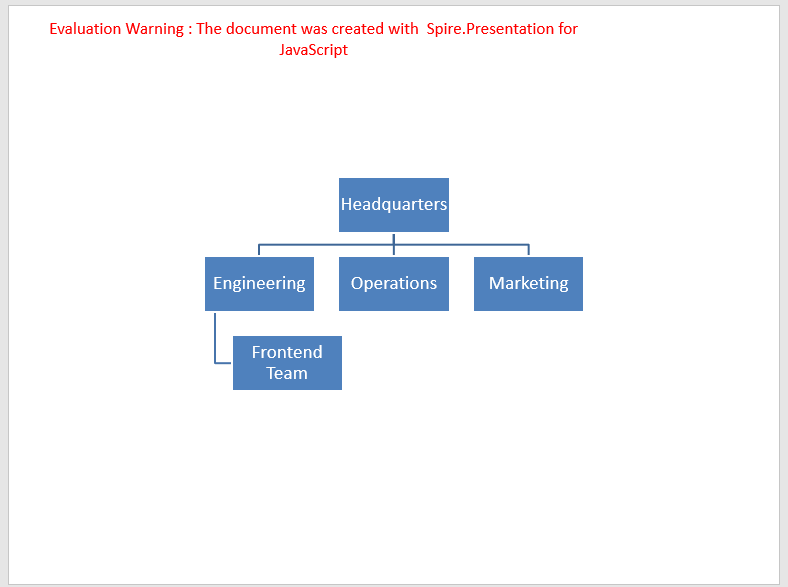
When you add nodes to a SmartArt graphic, you can build the hierarchy level by level: add a top-level node first, then add subordinate nodes to its child node collection, or insert one at a given position so the new node lands in the right order. The text and reporting relations of the existing nodes stay as they are, and the graphic re-flows around the new node count.
| What you write | What you get |
|---|---|
smartArt.Nodes.AddNode() |
Adds a node at the top level of the graphic |
node.ChildNodes.AddNode() |
Appends a child node under the specified node |
node.ChildNodes.AddNodeByPosition(position) |
Inserts a child node at the specified position under the node and shifts the following children back |
node.TextFrame.Text |
Sets the text of the new node |
The steps are:
- Get the Spire.Presentation WASM module, make sure it is ready, and load the font file and the presentation into the VFS.
- Create a
Presentationobject, callLoadFromFile()to load the presentation, useSlides.get_Item()to get the slide, and add an organization-chart SmartArt withShapes.AppendSmartArt(). - Iterate the node collection backwards and clear the placeholder nodes that come with the layout with
Nodes.RemoveNode(). - Call
Nodes.AddNode()to add the top-level node and write its text withTextFrame.Text. - Add departments under the top-level node with
ChildNodes.AddNode(), then insert one at a given position withChildNodes.AddNodeByPosition(). - Call
AddNode()on a department'sChildNodesto add the next level. - Call
Presentation.SaveToFile()to save the result, release the presentation withDispose(), then read the file from the VFS and trigger the download.
The code for adding nodes to a SmartArt graphic is shown below:
function App() {
  const addNodes = async () => {
    // Get the Spire.Presentation WASM module
    const pptModule = window.wasmModule?.spirepresentation;

    // Check that the module is ready
    if (!pptModule) {
      alert('Spire.Presentation is not ready yet');
      return;
    }

    // Load the font and the presentation into the VFS
    await window.spire.FetchFileToVFS('ARIAL.TTF', '/Library/Fonts/', `${process.env.PUBLIC_URL}/font/`);
    const inputFileName = 'SmartArt.pptx';
    await window.spire.FetchFileToVFS(inputFileName, '', `${process.env.PUBLIC_URL}data/`);

    // Load the presentation and get the first slide
    const ppt = new pptModule.Presentation();
    ppt.LoadFromFile(inputFileName);
    const slide = ppt.Slides.get_Item(0);

    // Add an organization-chart SmartArt and clear its placeholder nodes
    const smartArt = slide.Shapes.AppendSmartArt(50, 160, 620, 200, pptModule.SmartArtLayoutType.OrganizationChart);
    for (let i = smartArt.Nodes.Count - 1; i >= 0; i--) {
      smartArt.Nodes.RemoveNode({ index: i });
    }

    // Top-level node
    const root = smartArt.Nodes.AddNode();
    root.TextFrame.Text = 'Headquarters';

    // Add departments under the top-level node
    const dev = root.ChildNodes.AddNode();
    dev.TextFrame.Text = 'Engineering';
    const mkt = root.ChildNodes.AddNode();
    mkt.TextFrame.Text = 'Marketing';

    // Insert a department at a given position
    const ops = root.ChildNodes.AddNodeByPosition(1);
    ops.TextFrame.Text = 'Operations';

    // Add a team under the engineering department
    const team = dev.ChildNodes.AddNode();
    team.TextFrame.Text = 'Frontend Team';

    // Save the result file
    const outputFileName = 'AddSmartArtNodes.pptx';
    ppt.SaveToFile({ file: outputFileName, fileFormat: pptModule.FileFormat.Pptx2013 });
    ppt.Dispose();

    // Read the generated file from the VFS and trigger the download
    const fileArray = window.dotnetRuntime.Module.FS.readFile(outputFileName);
    const blob = new Blob([fileArray], { type: 'application/vnd.openxmlformats-officedocument.presentationml.presentation' });
    const url = URL.createObjectURL(blob);
    const a = document.createElement('a');
    a.href = url;
    a.download = outputFileName;
    a.click();
    URL.revokeObjectURL(url);
  };

  return (
    <div style={{ textAlign: 'center', height: '300px' }}>
      <h1>Add SmartArt Nodes</h1>
      <button onClick={addNodes}>
        Add Nodes
      </button>
    </div>
  );
}

export default App;
Presentation after adding nodes to the SmartArt graphic:
FAQ
What is the difference between Nodes and ChildNodes
Cause: Nodes returns the nodes at every level of the graphic, while ChildNodes returns only the direct children of one node. The two collections serve different purposes.
Solution: Use Nodes to walk the whole graphic, and a node's ChildNodes to read, add, or remove its direct children:
// Every node in the graphic
for (let i = 0; i < smartArt.Nodes.Count; i++) {
  console.log(smartArt.Nodes.get_Item(i).TextFrame.Text);
}

// The direct children of one node
const root = smartArt.Nodes.get_Item(0);
for (let i = 0; i < root.ChildNodes.Count; i++) {
  console.log(root.ChildNodes.get_Item(i).TextFrame.Text);
}
Why does a node added as a child end up at the top level
Cause: smartArt.Nodes.AddNode() adds a node at the top level of the graphic instead of under the current node. On an organization chart the new node becomes another top-level node and stays at level 0.
Solution: To add a node as a subordinate, call ChildNodes.AddNode() on that node; to insert it at a position, use ChildNodes.AddNodeByPosition():
const root = smartArt.Nodes.get_Item(0);
const child = root.ChildNodes.AddNode();
child.TextFrame.Text = 'New node';
Get a Free License
If you wish to delete the evaluation message from the resulting documents, or to get rid of function limitations, please contact sales to obtain a valid 30-day temporary license.
