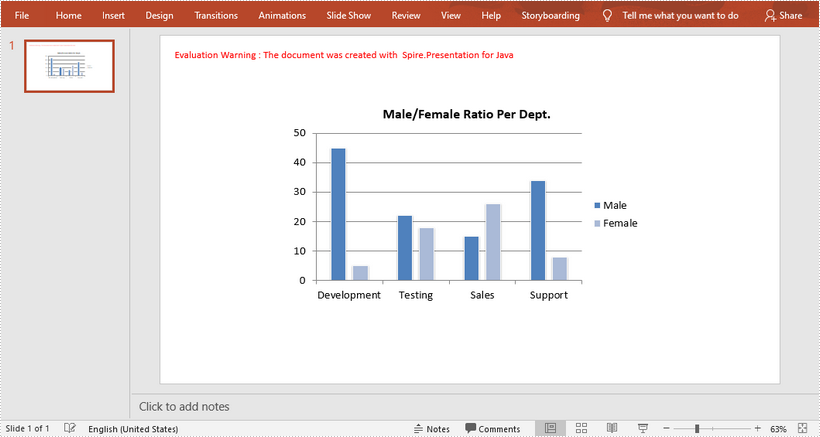
This article shows you how to create a chart in PowerPoint using the data from an existing Excel document. This solution relies on Spire.Office.jar. Please download the latest version from here and add it as a dependency in your project.
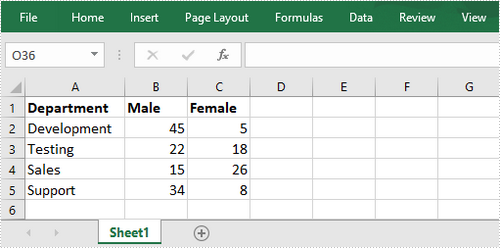
Below is a screenshot of the Excel document.
import com.spire.presentation.FileFormat;
import com.spire.presentation.Presentation;
import com.spire.presentation.SlideSizeType;
import com.spire.presentation.charts.ChartStyle;
import com.spire.presentation.charts.ChartType;
import com.spire.presentation.charts.IChart;
import com.spire.xls.Workbook;
import com.spire.xls.Worksheet;

import java.awt.geom.Rectangle2D;

public class CreateChartFromExcelData {

    public static void main(String[] args) throws Exception {

        //Create a Presentation object
        Presentation presentation = new Presentation();
        presentation.getSlideSize().setType(SlideSizeType.SCREEN_16_X_9);

        //Add a clustered column chart to slide
        Rectangle2D rect = new Rectangle2D.Float(200, 100, 550, 320);
        IChart chart = presentation.getSlides().get(0).getShapes().appendChart(ChartType.COLUMN_CLUSTERED,rect);

        //Clear the default dummy data
        chart.getChartData().clear(0,0,5,5 );

        //Load an existing Excel file to Workbook object
        Workbook wb = new Workbook();
        wb.loadFromFile("C:\\Users\\Administrator\\Desktop\\data.xlsx");

        //Get the first worksheet
        Worksheet sheet = wb.getWorksheets().get(0);

        //Import data from the sheet to chart table
        for (int r = 0; r < sheet.getAllocatedRange().getRowCount(); r++)
        {
            for (int c = 0; c < sheet.getAllocatedRange().getColumnCount(); c++)
            {
                chart.getChartData().get(r,c).setValue(sheet.getCellRange(r+1, c+1).getValue2());
            }
        }

        //Add chart title
        chart.getChartTitle().getTextProperties().setText("Male/Female Ratio Per Dept.");
        chart.getChartTitle().getTextProperties().isCentered(true);
        chart.getChartTitle().setHeight(25f);
        chart.hasTitle(true);

        //Set the series label
        chart.getSeries().setSeriesLabel(chart.getChartData().get("B1","C1"));

        //Set the category labels
        chart.getCategories().setCategoryLabels(chart.getChartData().get("A2","A5"));

        //Set the series values
        chart.getSeries().get(0).setValues(chart.getChartData().get("B2","B5"));
        chart.getSeries().get(1).setValues(chart.getChartData().get("C2", "C5"));

        //Apply built-in chart style
        chart.setChartStyle(ChartStyle.STYLE_11);

        //Set overlap
        chart.setOverLap(-50);

        //Set gap width
        chart.setGapWidth(200);

        //Save to file
        presentation.saveToFile("output/Chart.pptx", FileFormat.PPTX_2013);
    }
}