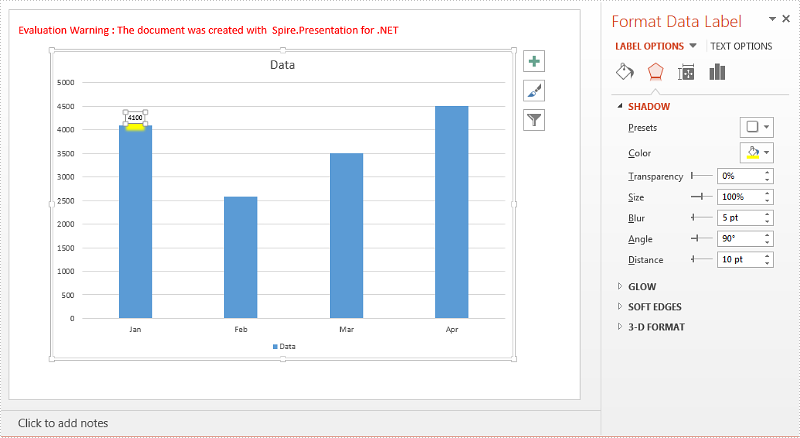
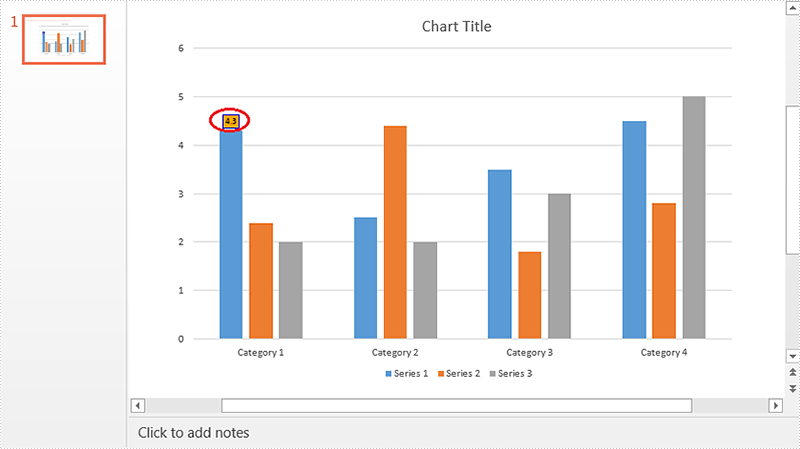
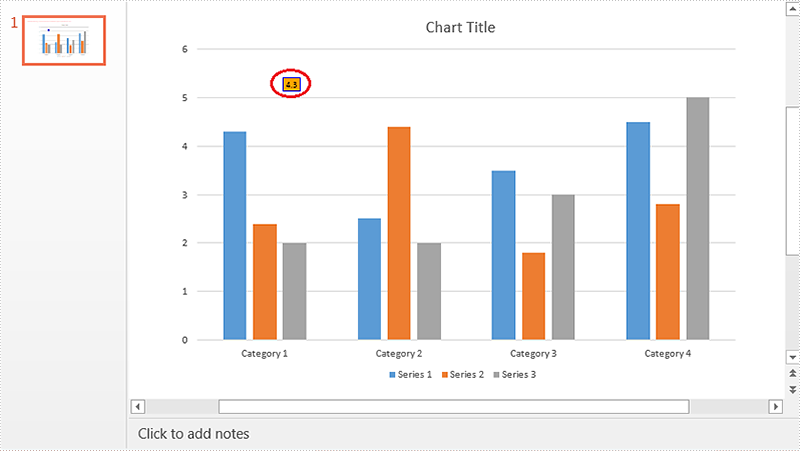
Add Shadow Effect to Chart DataLabels in PowerPoint in C#
Adding shadow effect is one of the good ways to make a data label stand out on your chart. This article is going to show you how to add shadow effect to a chart data label in PowerPoint using Spire.Presentation.
Detail steps:
Step 1: Initialize a Presentation object and load the PowerPoint file.
Presentation ppt = new Presentation();
ppt.LoadFromFile(@"test.pptx");
Step 2: Get the chart.
IChart chart = ppt.Slides[0].Shapes[0] as IChart;
Step 3: Add a data label to the first chart series.
ChartDataLabelCollection dataLabels = chart.Series[0].DataLabels;
ChartDataLabel Label = dataLabels.Add();
Label.LabelValueVisible = true;
Step 4: Add outer shadow effect to the data label.
Label.Effect.OuterShadowEffect = new OuterShadowEffect();
//Set shadow color
Label.Effect.OuterShadowEffect.ColorFormat.Color = Color.Yellow;
//Set blur
Label.Effect.OuterShadowEffect.BlurRadius = 5;
//Set distance
Label.Effect.OuterShadowEffect.Distance = 10;
//Set angle
Label.Effect.OuterShadowEffect.Direction = 90f;
Step 5: Save the file.
ppt.SaveToFile("Shadow.pptx", FileFormat.Pptx2010);
Screenshot:
Full code:
using System.Drawing;
using Spire.Presentation;
using Spire.Presentation.Charts;
using Spire.Presentation.Collections;
using Spire.Presentation.Drawing;

namespace Add_Shadow_Effect_to_Chart_Datalabel
{
    class Program
    {
        static void Main(string[] args)
        {
            //Initialize a Presentation object
            Presentation ppt = new Presentation();
            //Load the PowerPoint file
            ppt.LoadFromFile(@"test.pptx");

            //Get the chart
            IChart chart = ppt.Slides[0].Shapes[0] as IChart;

            //Add a data label to the first chart series
            ChartDataLabelCollection dataLabels = chart.Series[0].DataLabels;
            ChartDataLabel Label = dataLabels.Add();
            Label.LabelValueVisible = true;

            //Add outer shadow effect to the data label

            Label.Effect.OuterShadowEffect = new OuterShadowEffect();
            //Set shadow color
            Label.Effect.OuterShadowEffect.ColorFormat.Color = Color.Yellow;
            //Set blur
            Label.Effect.OuterShadowEffect.BlurRadius = 5;
            //Set distance
            Label.Effect.OuterShadowEffect.Distance = 10;
            //Set angle
            Label.Effect.OuterShadowEffect.Direction = 90f;

            //Save the file
            ppt.SaveToFile("Shadow.pptx", FileFormat.Pptx2010);
        }
    }
}
How to rotate the shape on word document in C#
Spire.Doc supports to insert new shapes to the word document and from version 6.4.11, Spire.Doc public the property ShapeObject.Rotation to enable developers to rotate the shapes. This article will show you to how to rotate the shapes on the word document in C#.
Step 1: Create a new instance of word document and load the document from file.
Document doc = new Document();
doc.LoadFromFile("Sample.docx");
Step 2: Get the first section from file.
Section section = doc.Sections[0];
Step 3: Traverse the word document and set the shape rotation as 10.
foreach (Paragraph para in section.Paragraphs)
{
    foreach (DocumentObject obj in para.ChildObjects)
    {
        if (obj is ShapeObject)
        {
            (obj as ShapeObject).Rotation = 10.0;
        }
    }
}
Step 4: Save the document to file.
doc.SaveToFile("Result.docx", FileFormat.Docx);
Effective screenshot after rotate the shapes:

Full codes:
using Spire.Doc;
using Spire.Doc.Documents;
using Spire.Doc.Fields;
namespace Rotate
{
    class Program
    {
        static void Main(string[] args)
        {
            Document doc = new Document();
            doc.LoadFromFile("Sample.docx");

            Section section = doc.Sections[0];

            foreach (Paragraph para in section.Paragraphs)
            {
                foreach (DocumentObject obj in para.ChildObjects)
                {
                    if (obj is ShapeObject)
                    {
                        (obj as ShapeObject).Rotation = 10.0;
                    }
                }
            }

            doc.SaveToFile("Result.docx", FileFormat.Docx);
        }
    }
}
Set Transparent Color for Images in Word in C#
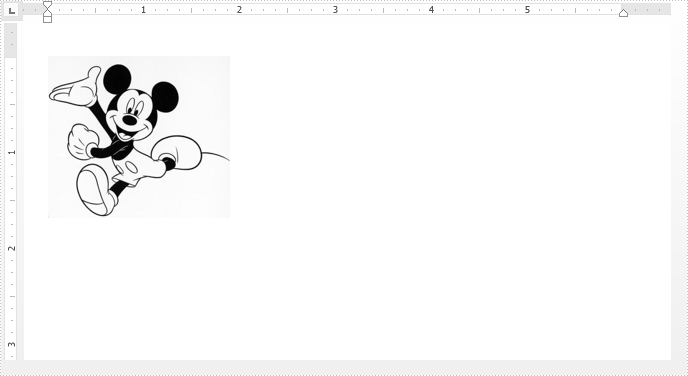
This tutorial is going to show you how to make a color of a image transparent using Spire.Doc.
Below screenshot shows an example image with black and white colors:
Detail steps:
Step 1: Instantiate a Document object and Load the Word file.
Document doc = new Document();
doc.LoadFromFile("Input.docx");
Step 2: Get the first Paragraph in the first section.
Paragraph paragraph = doc.Sections[0].Paragraphs[0];
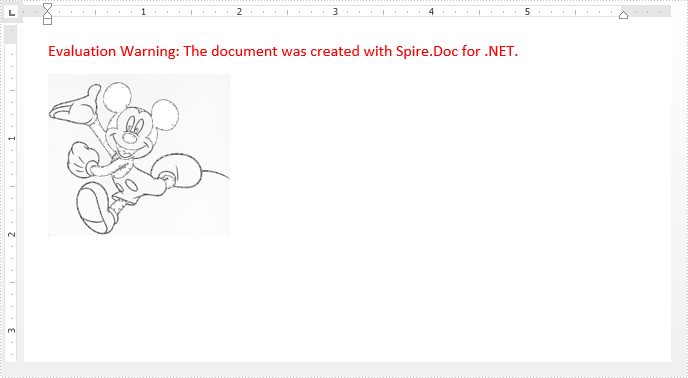
Step 3: Set the black color of the image(s) in the paragraph to transperant.
foreach (DocumentObject obj in paragraph.ChildObjects)
{
    if (obj is DocPicture)
    {
        (obj as DocPicture).TransparentColor = Color.Black;
    }
}
Step 4: Save the file.
doc.SaveToFile("Result.docx", FileFormat.Docx2013);
Screenshot:
Full code:
using Spire.Doc;
using Spire.Doc.Documents;
using Spire.Doc.Fields;
using System.Drawing;
namespace Transeperant
{
    class Program
    {
        static void Main(string[] args)
        {
            //Instantiate a Document object
            Document doc = new Document();
            //Load the Word file
            doc.LoadFromFile("Input.docx");

            //Get the first paragraph in the first section
            Paragraph paragraph = doc.Sections[0].Paragraphs[0];

            //Set the black color of the image(s) in the paragraph to transperant
            foreach (DocumentObject obj in paragraph.ChildObjects)
            {
                if (obj is DocPicture)
                {
                    (obj as DocPicture).TransparentColor = Color.Black;
                }
            }

            //Save the file
            doc.SaveToFile("Result.docx", FileFormat.Docx2013);
        }
    }
}
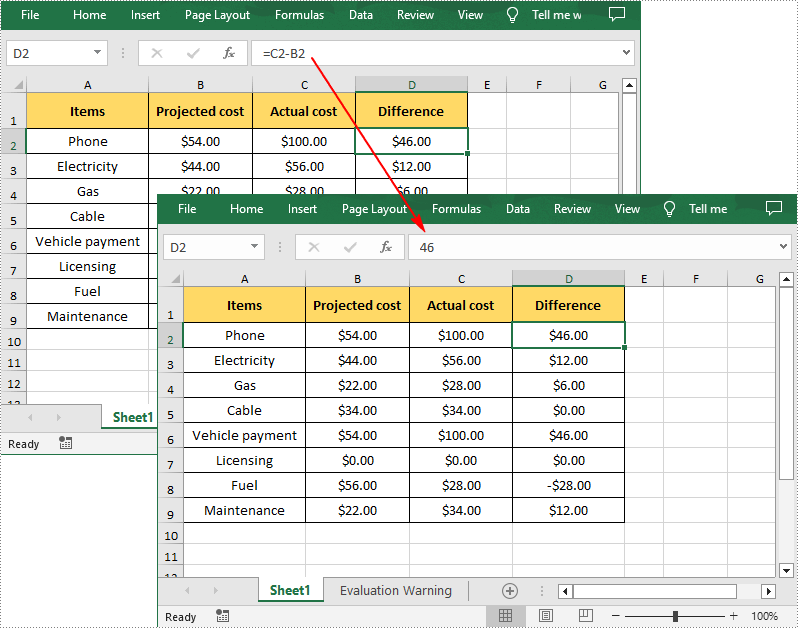
C#: Remove Formulas but Keep Values in Excel
When you need to share an Excel file with others but don't want to give them access to the underlying formulas, converting the formulas to numeric values ensures that the recipients can view and work with the calculated results without altering the original calculations. In this article, you will learn how to programmatically remove formulas from cells in Excel but keep the values using Spire.XLS for .NET.
Install Spire.XLS for .NET
To begin with, you need to add the DLL files included in the Spire.XLS for .NET package as references in your .NET project. The DLL files can be either downloaded from this link or installed via NuGet.
PM> Install-Package Spire.XLS
Remove Formulas from Excel Cells but Keep Values in C#
MS Excel provides the "Paste Values" function to help remove formulas while keeping the values. To implement the same functionality in C# through code, refer to the below steps.
- Create a Workbook instance.
- Load a sample Excel file using Workbook.LoadFromFile() method.
- Loop through the worksheets in the file, and then loop through the cells in each sheet.
- Determine whether the cell contains a formula using CellRange.HasFormula property.
- If yes, get the formula value using CellRange.FormulaValue property. Then clear the original formula in the cell and fill it with the formula value using CellRange.Value2 property.
- Save the result file using Workbook.SaveToFile() method.
- C#
using Spire.Xls;
using System;
namespace RemoveFormulas
{
    class Program
    {
        static void Main(string[] args)
        {
            //Create a Workbook instance
            Workbook workbook = new Workbook();

            //Load an Excel file
            workbook.LoadFromFile("Sample.xlsx");

            //Loop through worksheets
            foreach (Worksheet sheet in workbook.Worksheets)
            {
                //Loop through cells
                foreach (CellRange cell in sheet.Range)
                {
                    //Determine whether the cell contain formula
                    if (cell.HasFormula)
                    {
                        //If yes, get the formula value in the cell
                        Object value = cell.FormulaValue;

                        //Clear cell content
                        cell.Clear(ExcelClearOptions.ClearContent);

                        //Fill the formula value into the cell
                        cell.Value2 = value;
                    }
                }
            }

            //Save the result file
            workbook.SaveToFile("DeleteFormula.xlsx", ExcelVersion.Version2016);
        }
    }
}
Apply for a Temporary License
If you'd like to remove the evaluation message from the generated documents, or to get rid of the function limitations, please request a 30-day trial license for yourself.
Create Multiple Slide Maters and Apply Them to Individual Slides in C#, VB.NET
When you want to use multiple themes in one presentation, you’ll need multiple slide masters. In this article, you will learn how create additional slide masters and apply them to different slides, by using Spire.Presentation with C# and VB.NET.
Step 1: Create a PowerPoint document and insert four slides to it. There are five slides in total including the default slide.
Presentation ppt = new Presentation();
for (int i = 0; i < 4; i++)
{
    ppt.Slides.Append();
}
Step 2: Get the first default slide master.
IMasterSlide first_master = ppt.Masters[0];
Step 3: Append another slide master.
ppt.Masters.AppendSlide(first_master);
IMasterSlide second_master = ppt.Masters[1];
Step 4: Set different background image for the two slide masters.
string pic1 = @"C:\Users\Administrator\Desktop\image-1.png";
string pic2 = @"C:\Users\Administrator\Desktop\image-2.png";
RectangleF rect = new RectangleF(0, 0, ppt.SlideSize.Size.Width, ppt.SlideSize.Size.Height);
first_master.SlideBackground.Fill.FillType = FillFormatType.Picture;
IEmbedImage image1 = first_master.Shapes.AppendEmbedImage(ShapeType.Rectangle, pic1, rect);
first_master.SlideBackground.Fill.PictureFill.Picture.EmbedImage = image1 as IImageData;
second_master.SlideBackground.Fill.FillType = FillFormatType.Picture;
IEmbedImage image2 = second_master.Shapes.AppendEmbedImage(ShapeType.Rectangle, pic2, rect);
second_master.SlideBackground.Fill.PictureFill.Picture.EmbedImage = image2 as IImageData;
Step 5: Apply the first master with layout to the first slide.
ppt.Slides[0].Layout = first_master.Layouts[1];
Step 6: Apply the second master with layout to other slides.
for (int i = 1; i < ppt.Slides.Count; i++)
{
    ppt.Slides[i].Layout = second_master.Layouts[8];
}
Step 7: Save the file.
ppt.SaveToFile("result.pptx", FileFormat.Pptx2013);
Output:
Full Code:
using Spire.Presentation;
using Spire.Presentation.Drawing;
using System.Drawing;
namespace  CreateMultipleMaster
{
    class Program
    {
        static void Main(string[] args)
        {
            Presentation ppt = new Presentation();
            ppt.SlideSize.Type = SlideSizeType.Screen16x9;
            for (int i = 0; i < 4; i++)
            {
                ppt.Slides.Append();
            }

            IMasterSlide first_master = ppt.Masters[0];
            ppt.Masters.AppendSlide(first_master);
            IMasterSlide second_master = ppt.Masters[1];

            string pic1 = @"C:\Users\Administrator\Desktop\image-1.png";
            string pic2 = @"C:\Users\Administrator\Desktop\image-2.png";
            RectangleF rect = new RectangleF(0, 0, ppt.SlideSize.Size.Width, ppt.SlideSize.Size.Height);
            first_master.SlideBackground.Fill.FillType = FillFormatType.Picture;
            IEmbedImage image1 = first_master.Shapes.AppendEmbedImage(ShapeType.Rectangle, pic1, rect);
            first_master.SlideBackground.Fill.PictureFill.Picture.EmbedImage = image1 as IImageData;
            second_master.SlideBackground.Fill.FillType = FillFormatType.Picture;
            IEmbedImage image2 = second_master.Shapes.AppendEmbedImage(ShapeType.Rectangle, pic2, rect);
            second_master.SlideBackground.Fill.PictureFill.Picture.EmbedImage = image2 as IImageData;

            ppt.Slides[0].Layout = first_master.Layouts[1];
            for (int i = 1; i < ppt.Slides.Count; i++)
            {
                ppt.Slides[i].Layout = second_master.Layouts[8];
            }
            ppt.SaveToFile("result.pptx", FileFormat.Pptx2013);

            }
        }
    }
Imports Spire.Presentation
Imports Spire.Presentation.Drawing
Imports System.Drawing
Namespace CreateMultipleMaster
	Class Program
		Private Shared Sub Main(args As String())
			Dim ppt As New Presentation()
			ppt.SlideSize.Type = SlideSizeType.Screen16x9
			For i As Integer = 0 To 3
				ppt.Slides.Append()
			Next

			Dim first_master As IMasterSlide = ppt.Masters(0)
			ppt.Masters.AppendSlide(first_master)
			Dim second_master As IMasterSlide = ppt.Masters(1)

			Dim pic1 As String = "C:\Users\Administrator\Desktop\image-1.png"
			Dim pic2 As String = "C:\Users\Administrator\Desktop\image-2.png"
			Dim rect As New RectangleF(0, 0, ppt.SlideSize.Size.Width, ppt.SlideSize.Size.Height)
			first_master.SlideBackground.Fill.FillType = FillFormatType.Picture
			Dim image1 As IEmbedImage = first_master.Shapes.AppendEmbedImage(ShapeType.Rectangle, pic1, rect)
			first_master.SlideBackground.Fill.PictureFill.Picture.EmbedImage = TryCast(image1, IImageData)
			second_master.SlideBackground.Fill.FillType = FillFormatType.Picture
			Dim image2 As IEmbedImage = second_master.Shapes.AppendEmbedImage(ShapeType.Rectangle, pic2, rect)
			second_master.SlideBackground.Fill.PictureFill.Picture.EmbedImage = TryCast(image2, IImageData)

			ppt.Slides(0).Layout = first_master.Layouts(1)
			For i As Integer = 1 To ppt.Slides.Count - 1
				ppt.Slides(i).Layout = second_master.Layouts(8)
			Next
			ppt.SaveToFile("result.pptx", FileFormat.Pptx2013)

		End Sub
	End Class
End Namespace
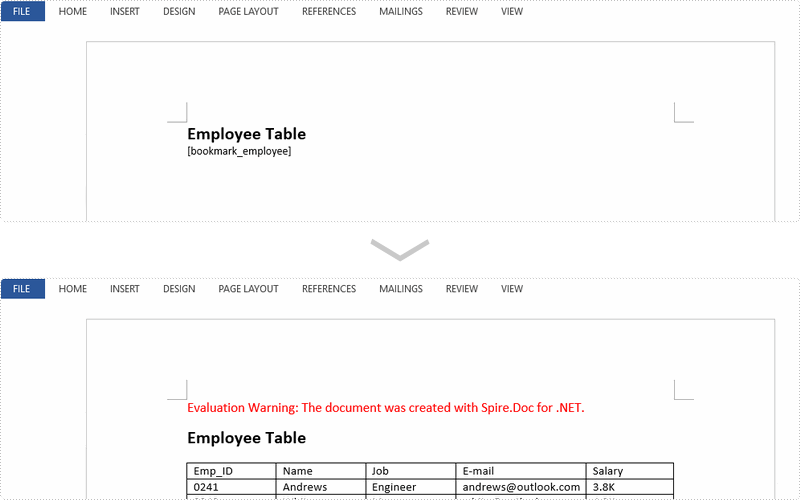
Replace Bookmark with a Table in Word Documents in C#, VB.NET
Bookmarks are a great way to specify important locations on a Word document. Spire.Doc supports to access the bookmarks within the document and insert objects such as text, image and table at the bookmark location. This article will show you how to access a specific bookmark and replace the current bookmark content with a table.
Step 1: Load a template Word document.
Document doc = new Document();
doc.LoadFromFile(@"C:\Users\Administrator\Desktop\employee.docx");
Step 2: Create a Table object.
Table table = new Table(doc,true);
Step 3: Fill the table with sample data.
DataTable dt = new DataTable();
dt.Columns.Add("id", typeof(string));
dt.Columns.Add("name", typeof(string));
dt.Columns.Add("job", typeof(string));
dt.Columns.Add("email", typeof(string));
dt.Columns.Add("salary", typeof(string));
dt.Rows.Add(new string[] { "Emp_ID", "Name", "Job", "E-mail", "Salary" });
dt.Rows.Add(new string[] { "0241","Andrews", "Engineer", "andrews@outlook.com" ,"3.8K"});
dt.Rows.Add(new string[] { "0242","White", "Manager", "white@outlook.com","4.2K" });
dt.Rows.Add(new string[] { "0243","Martin", "Secretary", "martin@gmail.com", "3.5K" });
table.ResetCells(dt.Rows.Count, dt.Columns.Count);
for (int i = 0; i < dt.Rows.Count; i++)
{
    for (int j = 0; j < dt.Columns.Count; j++)
    {
        table.Rows[i].Cells[j].AddParagraph().AppendText(dt.Rows[i][j].ToString());
    }
}
Step 4: Get the specific bookmark by its name.
BookmarksNavigator navigator = new BookmarksNavigator(doc);
navigator.MoveToBookmark("bookmark_employee");
Step 5: Create a TextBodyPart instance and add the table to it.
TextBodyPart part = new TextBodyPart(doc);
part.BodyItems.Add(table);
Step 6: Replace the current bookmark content with the TextBodyPart object.
navigator.ReplaceBookmarkContent(part);
Step 7: Save the file.
doc.SaveToFile("output.docx", FileFormat.Docx2013);
Result:
Full Code:
using Spire.Doc;
using Spire.Doc.Documents;
using System.Data;
namespace ReplaceBookmark
{
    class Program
    {

        static void Main(string[] args)
        {

            Document doc = new Document();
            doc.LoadFromFile(@"C:\Users\Administrator\Desktop\employee.docx");

            Table table = new Table(doc, true);
            DataTable dt = new DataTable();
            dt.Columns.Add("id", typeof(string));
            dt.Columns.Add("name", typeof(string));
            dt.Columns.Add("job", typeof(string));
            dt.Columns.Add("email", typeof(string));
            dt.Columns.Add("salary", typeof(string));
            dt.Rows.Add(new string[] { "Emp_ID", "Name", "Job", "E-mail", "Salary" });
            dt.Rows.Add(new string[] { "0241", "Andrews", "Engineer", "andrews@outlook.com", "3.8K" });
            dt.Rows.Add(new string[] { "0242", "White", "Manager", "white@outlook.com", "4.2K" });
            dt.Rows.Add(new string[] { "0243", "Martin", "Secretary", "martin@gmail.com", "3.5K" });
            table.ResetCells(dt.Rows.Count, dt.Columns.Count);
            for (int i = 0; i < dt.Rows.Count; i++)
            {
                for (int j = 0; j < dt.Columns.Count; j++)
                {
                    table.Rows[i].Cells[j].AddParagraph().AppendText(dt.Rows[i][j].ToString());
                }
            }

            BookmarksNavigator navigator = new BookmarksNavigator(doc);
            navigator.MoveToBookmark("bookmark_employee");
            TextBodyPart part = new TextBodyPart(doc);
            part.BodyItems.Add(table);
            navigator.ReplaceBookmarkContent(part);
            doc.SaveToFile("output.docx", FileFormat.Docx2013);
            System.Diagnostics.Process.Start("output.docx");

        }
    }
}
Imports Spire.Doc
Imports Spire.Doc.Documents
Imports System.Data
Namespace ReplaceBookmark
	Class Program

		Private Shared Sub Main(args As String())

			Dim doc As New Document()
			doc.LoadFromFile("C:\Users\Administrator\Desktop\employee.docx")

			Dim table As New Table(doc, True)
			Dim dt As New DataTable()
			dt.Columns.Add("id", GetType(String))
			dt.Columns.Add("name", GetType(String))
			dt.Columns.Add("job", GetType(String))
			dt.Columns.Add("email", GetType(String))
			dt.Columns.Add("salary", GetType(String))
			dt.Rows.Add(New String() {"Emp_ID", "Name", "Job", "E-mail", "Salary"})
			dt.Rows.Add(New String() {"0241", "Andrews", "Engineer", "andrews@outlook.com", "3.8K"})
			dt.Rows.Add(New String() {"0242", "White", "Manager", "white@outlook.com", "4.2K"})
			dt.Rows.Add(New String() {"0243", "Martin", "Secretary", "martin@gmail.com", "3.5K"})
			table.ResetCells(dt.Rows.Count, dt.Columns.Count)
			For i As Integer = 0 To dt.Rows.Count - 1
				For j As Integer = 0 To dt.Columns.Count - 1
					table.Rows(i).Cells(j).AddParagraph().AppendText(dt.Rows(i)(j).ToString())
				Next
			Next

			Dim navigator As New BookmarksNavigator(doc)
			navigator.MoveToBookmark("bookmark_employee")
			Dim part As New TextBodyPart(doc)
			part.BodyItems.Add(table)
			navigator.ReplaceBookmarkContent(part)
			doc.SaveToFile("output.docx", FileFormat.Docx2013)
			System.Diagnostics.Process.Start("output.docx")

		End Sub
	End Class
End Namespace
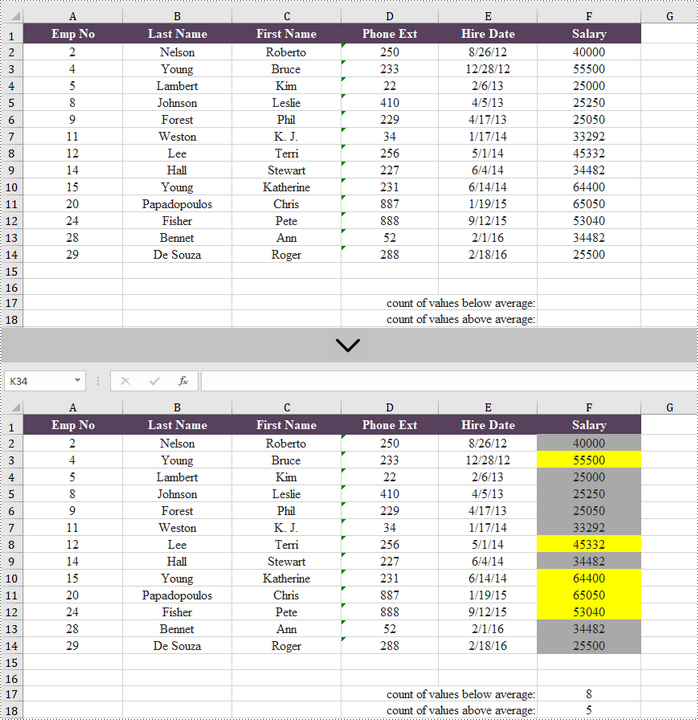
C#/VB.NET: Highlight Values Above or Below Average in Excel
If you want to find values that are higher or lower than the average, you don't have to calculate the average, and then check those that are higher or lower. Using conditional formatting in Excel, you can automatically highlight those numbers. In this article, you will learn how to highlight values above average or below average with conditional formatting, by using Spire.XLS for .NET.
Install Spire.XLS for .NET
To begin with, you need to add the DLL files included in the Spire.XLS for .NET package as references in your .NET project. The DLL files can be either downloaded from this link or installed via NuGet.
PM> Install-Package Spire.XLS
Highlight Values Above or Below Average in Excel
Below are the steps to highlight values above or below average in Excel using Spire.XLS for .NET.
- Create a Workbook object.
- Load an Excel file using Workbook.LoadFromFile() method.
- Get a specific worksheet from the workbook through Workbook.Worsheets[index] property.
- Add a conditional formatting to the worksheet using Worksheet.ConditionalFormats.Add() method and return an object of XlsConditionalFormats class.
- Set the cell range where the conditional formatting will be applied using XlsConditionalFormats.AddRange() method.
- Add an average condition using XlsConditionalFormats.AddAverageCondition() method, specify the average type to above and change the background color of the cells that meet the condition to yellow.
- Add another average condition to change the background color of the below average values to dark gray.
- Save the workbook to an Excel file using Workbook.SaveToFile() method.
- C#
- VB.NET
using Spire.Xls;
using Spire.Xls.Core;
using Spire.Xls.Core.Spreadsheet.Collections;
using System.Drawing;

namespace HighlightValuesAboveAndBelowAverage
{
    class Program
    {
        static void Main(string[] args)
        {
            //Create a Workbook object
            Workbook workbook = new Workbook();

            //Load an Excel file
            workbook.LoadFromFile(@"C:\Users\Administrator\Desktop\sample.xlsx");

            //Get the first worksheet
            Worksheet sheet = workbook.Worksheets[0];

            //Add a conditional format to the worksheet
            XlsConditionalFormats format = sheet.ConditionalFormats.Add();

            //Set the range where the conditional format will be applied
            format.AddRange(sheet.Range["F2:F14"]);

            //Add a condition to highlight the top 2 ranked values
            IConditionalFormat condition1 = format.AddAverageCondition(AverageType.Above);
            condition1.BackColor = Color.Yellow;

            //Add a condition to highlight the bottom 2 ranked values
            IConditionalFormat condition2 = format.AddAverageCondition(AverageType.Below);
            condition2.BackColor = Color.DarkGray;

            //Get the count of values below average
            sheet.Range["F17"].Formula = "=COUNTIF(F2:F14,\"<\"&AVERAGE(F2:F14))";

            //Get the count of values above average
            sheet.Range["F18"].Formula = "=COUNTIF(F2:F14,\">\"&AVERAGE(F2:F14))";

            //Save the workbook to an Excel file
            workbook.SaveToFile("HighlightValues.xlsx", ExcelVersion.Version2016);
        }
    }
}
Apply for a Temporary License
If you'd like to remove the evaluation message from the generated documents, or to get rid of the function limitations, please request a 30-day trial license for yourself.
Set Position of Chart Data Labels in PowerPoint in C#
Spire.Presentation supports to set the default position (e.g. Outside End, Center, Inside End, Inside base etc.) of data labels through ChartDataLabel.Position property, it also supports to set custom position of data labels using "ChartDataLabel.X" and "ChartDataLabel.Y" properties. This article is going to elaborate how we can set default and custom position of data labels using Spire.Presentation.
Detail steps:
Step 1: Initialize a Presentation object and load the PowerPoint file.
Presentation ppt = new Presentation();
ppt.LoadFromFile(@"Input.pptx");
Step 2: Get the chart.
IChart chart = ppt.Slides[0].Shapes[0] as IChart;
Step 3: Add data label to the chart and set its id.
ChartDataLabel label1 = chart.Series[0].DataLabels.Add();
label1.ID = 0;
Step 4: Set the position of data label.
//Set the default position of data label. This position is relative to the data markers.
//label1.Position = ChartDataLabelPosition.OutsideEnd;

//Set custom position of data label. This position is relative to the default position.
label1.X = 0.1f;
label1.Y = -0.1f;
Step 5: Set the properties of data label.
//Set label value visible
label1.LabelValueVisible = true;
//Set legend key invisible
label1.LegendKeyVisible = false;
//Set category name invisible
label1.CategoryNameVisible = false;
//Set series name invisible
label1.SeriesNameVisible = false;
//Set Percentage invisible
label1.PercentageVisible = false;

//Set border style and fill style of data label
label1.Line.FillType = Spire.Presentation.Drawing.FillFormatType.Solid;
label1.Line.SolidFillColor.Color = Color.Blue;
label1.Fill.FillType = Spire.Presentation.Drawing.FillFormatType.Solid;
label1.Fill.SolidColor.Color = Color.Orange;
Step 6: Save the file.
ppt.SaveToFile(@"Output.pptx", FileFormat.Pptx2013);
Screenshot:
Default position (Outside End):
Custom position:
Full code:
using Spire.Presentation;
using Spire.Presentation.Charts;
using System.Drawing;

namespace Set_Position_of_Chart_Data_Label_in_PPT
{
    class Program
    {
        static void Main(string[] args)
        {
            //Initialize a Presentation object
            Presentation ppt = new Presentation();
            //Load the PowerPoint file
            ppt.LoadFromFile(@"Input.pptx");

            //Get the chart
            IChart chart = ppt.Slides[0].Shapes[0] as IChart;

            //Add data label to chart and set its id
            ChartDataLabel label1 = chart.Series[0].DataLabels.Add();
            label1.ID = 0;

            //Set the default position of data label. This position is relative to the data markers.
            //label1.Position = ChartDataLabelPosition.OutsideEnd;

            //Set custom position of data label. This position is relative to the default position.
            label1.X = 0.1f;
            label1.Y = -0.1f;

            //Set label value visible
            label1.LabelValueVisible = true;
            //Set legend key invisible
            label1.LegendKeyVisible = false;
            //Set category name invisible
            label1.CategoryNameVisible = false;
            //Set series name invisible
            label1.SeriesNameVisible = false;
            //Set Percentage invisible
            label1.PercentageVisible = false;

            //Set border style and fill style of data label
            label1.Line.FillType = Spire.Presentation.Drawing.FillFormatType.Solid;
            label1.Line.SolidFillColor.Color = Color.Blue;
            label1.Fill.FillType = Spire.Presentation.Drawing.FillFormatType.Solid;
            label1.Fill.SolidColor.Color = Color.Orange;

            //Save the file
            ppt.SaveToFile(@"Output.pptx", FileFormat.Pptx2013);
        }
    }
}
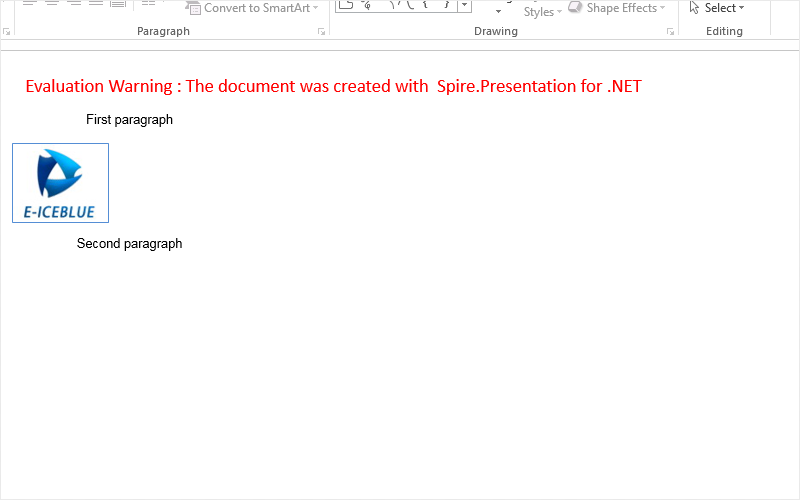
Insert HTML with image into the Presentation slides in C#
We have already demonstrated how to use Spire.Presentation to insert HTML formatted text to PowerPoint slide. Now from Spire.Presentation 3.4.1, it supports to insert html (including text, image, audio and video) into presentation slides and each html tag will be added to the slide as a separate shape. The following code snippets demonstrate how to.
Step 1: Create an instance of Presentation class.
Presentation ppt = new Presentation();
Step 2: Get the shapes on the first slide.
ShapeList shapes = ppt.Slides[0].Shapes;
Step 3: Add contents to shape from HTML code, which includes text and image.
shapes.AddFromHtml("<html><div><p>First paragraph</p><p><img src='https://cdn.e-iceblue.com/Logo.jpg'/></p><p>Second paragraph </p></html>");
Step 4: Save the document to file.
ppt.SaveToFile("Result.pptx", FileFormat.Pptx2010);
Effective screenshot:
Full codes of how to insert HTML into the Presentation slides:
using Spire.Presentation;
using Spire.Presentation.Collections;
namespace InsertHTML
{
class Program
{
static void Main(string[] args)
{
Presentation ppt = new Presentation();
ShapeList shapes = ppt.Slides[0].Shapes;
shapes.AddFromHtml("First paragraph

Second paragraph
");
ppt.SaveToFile("Result.pptx", FileFormat.Pptx2010);
}
}
}
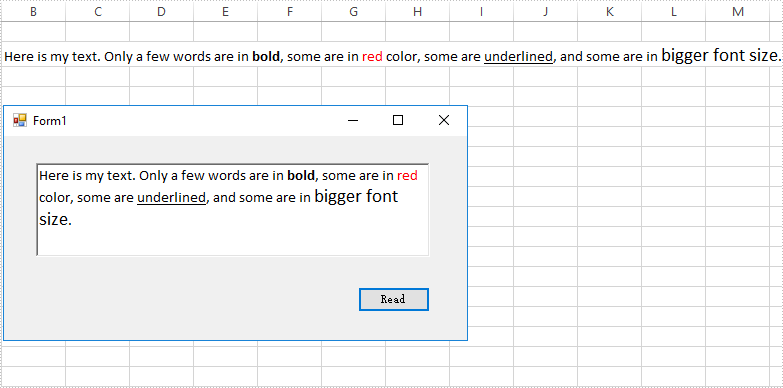
Read Rich Text from an Excel Cell in C#, VB.NET
Using Spire.XLS, you're able to apply multiple fonts in a single cell in order to create rich-formatted text within the cell, you can also extract the formatted text from the cell(s) in an existing Excel document. The following code snippets will show you how to read rich text from an Excel cell in C# and VB.NET.
Step 1: Create a Workbook instance and load a sample Excel file.
Workbook wb = new Workbook();
wb.LoadFromFile(@"C:\Users\Administrator\Desktop\Sample.xlsx");
Step 2: Get the first worksheet.
Worksheet sheet= wb.Worksheets[0];
Step 3: Get the rtf text from the specified cell.
richTextBox1.Rtf = sheet.Range["B2"].RichText.RtfText;
Output:
Full Code:
private void btn_read_Click(object sender, EventArgs e)
{
    Workbook wb = new Workbook();
    wb.LoadFromFile(@"C:\Users\Administrator\Desktop\Sample.xlsx");
    Worksheet sheet= wb.Worksheets[0];
    richTextBox1.Rtf = sheet.Range["B2"].RichText.RtfText;
}
Private  Sub btn_read_Click(ByVal sender As Object, ByVal e As EventArgs)
    Dim wb As Workbook =  New Workbook()
    wb.LoadFromFile("C:\Users\Administrator\Desktop\Sample.xlsx")
    Dim sheet As Worksheet =  wb.Worksheets(0)
    richTextBox1.Rtf = sheet.Range("B2").RichText.RtfText
End Sub