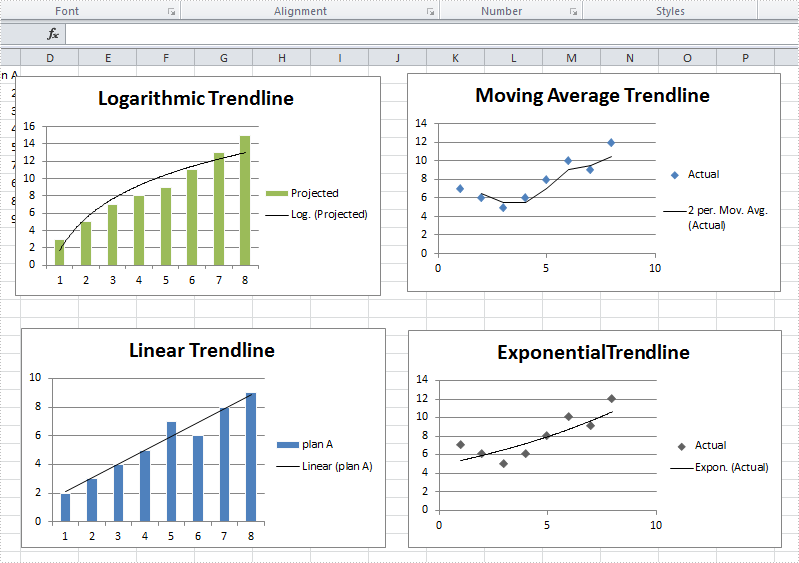
A trendline is used to show the trend of data series and predict future tendency. Totally, there are six different types: linear trendline, logarithmic trendline, polynomial trendline, power trendline, exponential trendline, and moving average trendline. We may choose different trendline based on the data type we have for different trendline has different advantages to show trend.
For example, a linear trendline works well to show the increase or decrease of data at a steady rate while a logarithmic trendline is often used to show the rate of change in the data increases or decreases quickly and then levels out.
Spire.XLS supports to add all of those six trendlines in charts. This article is going to show how to add trendlines in visual studio.
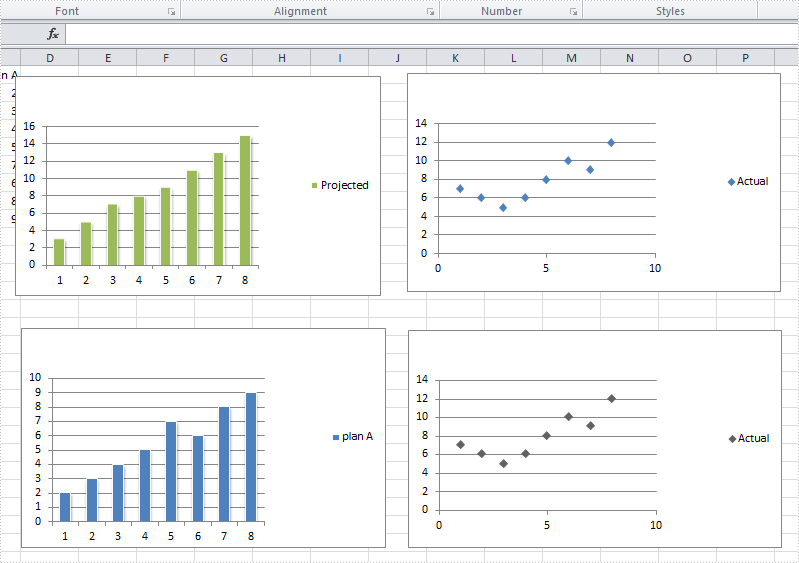
Before adding trendlines
After adding trendlines
Step 1: Load the workbook and create a sheet
Workbook workbook = new Workbook();
workbook.LoadFromFile("S2.xlsx");
Worksheet sheet = workbook.Worksheets[0];
Step 2: Select targeted chart, add trendline and set its type
//select chart and set logarithmic trendline
Chart chart = sheet.Charts[0];
chart.Series[0].TrendLines.Add(TrendLineType.Logarithmic);
//select chart and set moving_average trendline
Chart chart1 = sheet.Charts[1];
chart1.Series[0].TrendLines.Add(TrendLineType.Moving_Average);
//select chart and set linear trendline
Chart chart2 = sheet.Charts[2];
chart2.Series[0].TrendLines.Add(TrendLineType.Linear);
//select chart and set exponential trendline
Chart chart3 = sheet.Charts[3];
chart3.Series[0].TrendLines.Add(TrendLineType.Exponential);
Step 3: Save and launch the document
workbook.SaveToFile("S3.xlsx", ExcelVersion.Version2010);
System.Diagnostics.Process.Start("S3.xlsx");
Full code:
using System;
using System.Collections.Generic;
using System.Linq;
using System.Text;
using Spire.Xls;

namespace TradeLine
{
    class Program
    {
        static void Main(string[] args)
        {
            Workbook workbook = new Workbook();
            workbook.LoadFromFile("S2.xlsx");
            Worksheet sheet = workbook.Worksheets[0];


            Chart chart = sheet.Charts[0];
            chart.Series[0].TrendLines.Add(TrendLineType.Logarithmic);

            Chart chart1 = sheet.Charts[1];
            chart1.Series[0].TrendLines.Add(TrendLineType.Moving_Average);

            Chart chart2 = sheet.Charts[2];
            chart2.Series[0].TrendLines.Add(TrendLineType.Linear);

            Chart chart3 = sheet.Charts[3];
            chart3.Series[0].TrendLines.Add(TrendLineType.Exponential);

            workbook.SaveToFile("S3.xlsx", ExcelVersion.Version2010);
            System.Diagnostics.Process.Start("S3.xlsx");

        }
    }
}
Please note that we cannot add a trendline to data series in a stacked, 3-D, radar, pie, surface, or doughnut chart because those types of chart don't support trendline.