By default, Microsoft PowerPoint automatically hides the data labels when we create a series chart on presentation slide. In order to make your readers have an intuitive understanding of your chart, you can choose to set formatting of label to display series name, category name, value, percentage and adjust its displayed position. In this article, I would like to show you how to format data labels in PowerPoint presentation via Spire.Presentation.
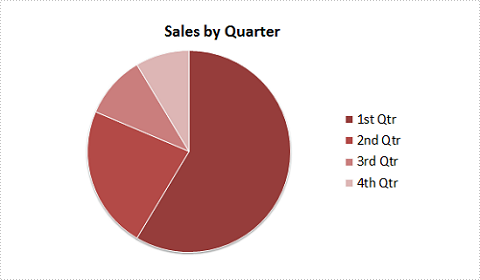
In the class of Spire.Presentation.Charts.ChartDataLabel, it contains properties like LabelValueVisible, PercentageVisible, SeriesNameVisible, CategoryNameVisible, Position and etc , which will enable us to easily manage the data labels formatting as you desired. Look at the pie chart below, it is not that informative if it doesn’t display data labels.
Now, let's format pie chart to display percentages in data labels with following code snippet:
Step 1: Create a new instance of Presentation class and load test the file that contains the pie chart.
Presentation ppt = new Presentation();
ppt.LoadFromFile("Test.pptx");
Step 2: Get the chart from presentation slide.
IChart chart = ppt.Slides[0].Shapes[0] as IChart;
Step 3: Get chart's series.
ChartSeriesFormatCollection sers = chart.Series;
Step 4: Set the position of legend on chart.
chart.ChartLegend.Position = ChartLegendPositionType.TopRight;
Step 5: Initialize four instance of series label and set parameters of each label.
ChartDataLabel cd1 = sers[0].DataLabels.Add();
cd1.PercentageVisible = true;
cd1.Position = ChartDataLabelPosition.Center;

ChartDataLabel cd2 = sers[0].DataLabels.Add();
cd2.PercentageVisible = true;
cd2.Position = ChartDataLabelPosition.Center;

ChartDataLabel cd3 = sers[0].DataLabels.Add();
cd3.PercentageVisible = true;
cd3.Position = ChartDataLabelPosition.Center;

ChartDataLabel cd4 = sers[0].DataLabels.Add();
cd4.PercentageVisible = true;
cd4.Position = ChartDataLabelPosition.Center;
Step 6: Save the changes to a new .pptx file.
ppt.SaveToFile("Result.pptx", FileFormat.Pptx2007);
Result:

Full Code:
using Spire.Presentation;
using Spire.Presentation.Charts;
using Spire.Presentation.Collections;

namespace FormatData
{

    class Program
    {
        static void Main(string[] args)
        {

            Presentation ppt = new Presentation();
            ppt.LoadFromFile("Test.pptx");

            IChart chart = ppt.Slides[0].Shapes[0] as IChart;
            ChartSeriesFormatCollection sers = chart.Series;
            chart.ChartLegend.Position = ChartLegendPositionType.TopRight;

            ChartDataLabel cd1 = sers[0].DataLabels.Add();
            cd1.PercentageVisible = true;
            cd1.Position = ChartDataLabelPosition.Center;
            ChartDataLabel cd2 = sers[0].DataLabels.Add();
            cd2.PercentageVisible = true;
            cd2.Position = ChartDataLabelPosition.Center;
            ChartDataLabel cd3 = sers[0].DataLabels.Add();
            cd3.PercentageVisible = true;
            cd3.Position = ChartDataLabelPosition.Center;
            ChartDataLabel cd4 = sers[0].DataLabels.Add();
            cd4.PercentageVisible = true;
            cd4.Position = ChartDataLabelPosition.Center;

            ppt.SaveToFile("Result.pptx", FileFormat.Pptx2007);

        }
    }
}
Imports Spire.Presentation
Imports Spire.Presentation.Charts
Imports Spire.Presentation.Collections

Namespace FormatData

	Class Program
		Private Shared Sub Main(args As String())

			Dim ppt As New Presentation()
			ppt.LoadFromFile("Test.pptx")

			Dim chart As IChart = TryCast(ppt.Slides(0).Shapes(0), IChart)
			Dim sers As ChartSeriesFormatCollection = chart.Series
			chart.ChartLegend.Position = ChartLegendPositionType.TopRight

			Dim cd1 As ChartDataLabel = sers(0).DataLabels.Add()
			cd1.PercentageVisible = True
			cd1.Position = ChartDataLabelPosition.Center
			Dim cd2 As ChartDataLabel = sers(0).DataLabels.Add()
			cd2.PercentageVisible = True
			cd2.Position = ChartDataLabelPosition.Center
			Dim cd3 As ChartDataLabel = sers(0).DataLabels.Add()
			cd3.PercentageVisible = True
			cd3.Position = ChartDataLabelPosition.Center
			Dim cd4 As ChartDataLabel = sers(0).DataLabels.Add()
			cd4.PercentageVisible = True
			cd4.Position = ChartDataLabelPosition.Center

			ppt.SaveToFile("Result.pptx", FileFormat.Pptx2007)

		End Sub
	End Class
End Namespace