Knowledgebase (2337)
Children categories
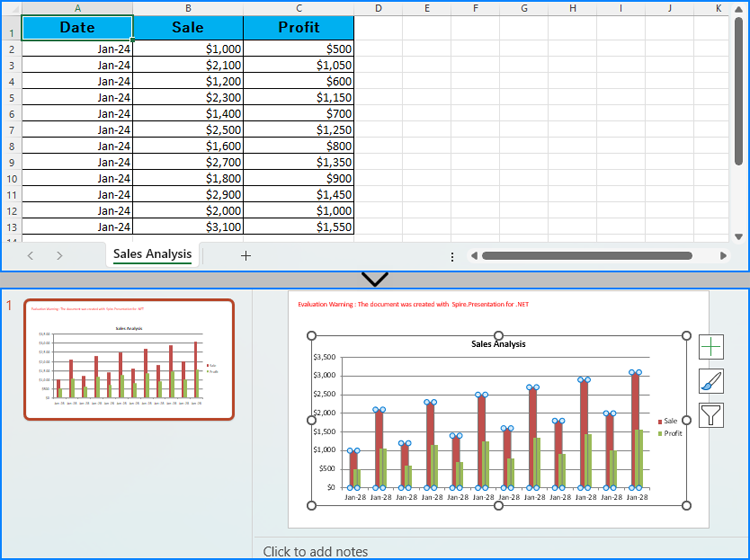
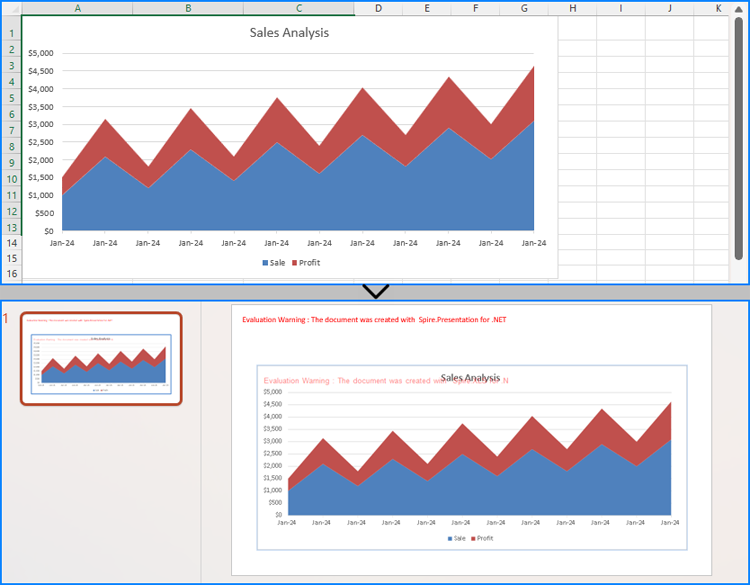
Creating charts in PowerPoint slides is a powerful way to enhance presentations by visually representing complex information, making it easier for audiences to grasp key insights. By reading Excel data directly to generate charts, you can streamline the data entry process and ensure data accuracy. Or, if you want to use charts from Excel files directly in PowerPoint presentations, you can directly insert them as pictures into PowerPoint slides, thus maximizing the original formatting and appearance. This article will show how to create charts in PowerPoint slides from Excel data using Spire.Office for .NET in .NET programs.
- Create Charts in PowerPoint Slides with Excel Data using C#
- Insert Excel Charts into PowerPoint Slides as Images using C#
Install Spire.Office for .NET
To begin with, you need to add the DLL files included in the Spire.Office for.NET package as references in your .NET project. The DLL files can be either downloaded from this link or installed via NuGet.
PM> Install-Package Spire.Office
Create Charts in PowerPoint Slides with Excel Data using C#
Developers can read data from Excel worksheets with Spire.XLS for .NET and then create charts in PowerPoint slides with Spire.Presentation for .NET using the read data as the charts' data source. The detailed steps for creating charts in PowerPoint presentations with Excel file data are as follows:
- Create an instance of Presentation class.
- Create an instance of Workbook class and load an Excel file using Workbook.LoadFromFile() method.
- Get the first slide in the presentation through Presentation.Slides[] property and create a chart in the first slide of the presentation using ISlide.Shapes.AppendChart() method.
- Clear the default dummy data using IChart.ChartData.Clear() method.
- Get the first worksheet in the workbook through Workbook.Worksheets[] property.
- Iterate through rows in the worksheet and then the columns in the worksheet:
- Get the cell values in the worksheet through Worksheet.AllocatedRange[].Value2 property and set them as the values of the chart’s data through IChart.ChartData[].Value property.
- Set the chart title using properties under IChart.ChartTitle property.
- Set the chart series labels and category labels through IChart.Series.SeriesLabel and IChart.Categories.CategoryLabels properties.
- Set the series values through IChart.Series[].Values property.
- Set the number format of the axis through IChart.PrimaryCategoryAxis.NumberFormat and IChart.PrimaryValueAxis.NumberFormat properties.
- Set the style of the chart through IChart.ChartStyle property.
- Save the presentation using Presentation.SaveToFile() method.
- C#
using Spire.Presentation;
using Spire.Presentation.Charts;
using Spire.Xls;
using System.Drawing;
using FileFormat = Spire.Presentation.FileFormat;
using IChart = Spire.Presentation.Charts.IChart;

namespace PresentationChartExcelData
{
    class Program
    {
        public static void Main(string[] args)
        {
            // Create an instance of Presentation class
            Presentation presentation = new Presentation();

            // Set the slide size
            presentation.SlideSize.Type = SlideSizeType.Screen16x9;

            // Create an instance of Workbook class and load an Excel file
            Workbook workbook = new Workbook();
            workbook.LoadFromFile("Sample.xlsx");

            // Get the first worksheet in the workbook
            Worksheet sheet = workbook.Worksheets[0];

            // Create a chart in the presentation
            RectangleF rect = new RectangleF(50, 100, presentation.SlideSize.Size.Width - 100, presentation.SlideSize.Size.Height - 150);
            ISlide slide = presentation.Slides[0];
            IChart chart = slide.Shapes.AppendChart(ChartType.ColumnClustered, rect);

            // Clear the default dummy data
            chart.ChartData.Clear(0, 0, 5, 5);

            // Iterate through the rows in the worksheet
            for (int i = 0; i < sheet.AllocatedRange.RowCount; i++)
            {
                // Iterate through the columns in the worksheet
                for (int j = 0; j < sheet.AllocatedRange.ColumnCount; j++)
                {
                    // Set the cell values in the worksheet as the values of the chart data
                    chart.ChartData[i, j].Value = sheet.AllocatedRange[i + 1, j + 1].Value2;
                    // Copy number formats
                    chart.ChartData[i, j].NumberFormat = sheet.AllocatedRange[i + 1, j + 1].NumberFormat;
                }
            }

            // Set the chart title
            chart.ChartTitle.TextProperties.Text = sheet.Name;
            chart.ChartTitle.TextProperties.IsCentered = true;
            chart.ChartTitle.Height = 25;
            chart.HasTitle = true;

            // Set the series labels and category labels
            chart.Series.SeriesLabel = chart.ChartData["B1", "C1"];
            chart.Categories.CategoryLabels = chart.ChartData["A2", "A" + sheet.AllocatedRange.RowCount];

            // Set the series values
            chart.Series[0].Values = chart.ChartData["B2", "B" + sheet.AllocatedRange.RowCount];
            chart.Series[1].Values = chart.ChartData["C2", "C" + sheet.AllocatedRange.RowCount];

            // Set the number format of the axis
            chart.PrimaryCategoryAxis.NumberFormat = sheet.AllocatedRange["A2"].NumberFormat;
            chart.PrimaryValueAxis.NumberFormat = sheet.AllocatedRange["B2"].NumberFormat;

            // Set the style of the chart
            chart.ChartStyle = ChartStyle.Style2;

            // Set the overlap and gap width
            chart.OverLap = 50;
            chart.GapWidth = 200;

            // Save the presentation
            presentation.SaveToFile("output/PresentationChartExcelData.pptx", FileFormat.Pptx2019);
            presentation.Dispose();
            workbook.Dispose();
        }
    }
}
Insert Excel Charts into PowerPoint Slides as Images using C#
To insert an existing chart from an Excel worksheet into a PowerPoint slide while maintaining its appearance and formatting precisely, the Workbook.SaveChartAsImage() method can be employed. This method allows the Excel chart to be saved as an image, which can then be added to the slide. The specific steps are as follows:
- Create an instance of Presentation class.
- Create an instance of Workbook class and load an Excel file using Workbook.LoadFromFile() method.
- Save a chart in a worksheet as an image using Workbook.SaveChartAsImage() method.
- Embed the image into the presentation using Presentation.Images.Append() method.
- Add the image to a slide using Presentation.Slides[].AppendEmbedImage() method.
- Save the presentation using Presentation.SaveToFile() method.
- C#
using Spire.Presentation;
using Spire.Presentation.Drawing;
using Spire.Xls;
using System.Drawing;
using FileFormat = Spire.Presentation.FileFormat;

namespace PresentationChartExcelChart
{
    class Program
    {
        public static void Main(string[] args)
        {
            // Create an instance of Presentation class
            Presentation presentation = new Presentation();

            // Set the slide size
            presentation.SlideSize.Type = SlideSizeType.Screen16x9;

            // Create an instance of Workbook class and load an Excel file
            Workbook workbook = new Workbook();
            workbook.LoadFromFile("Sample.xlsx");

            // Save the first chart in the first worksheet as an image
            Image image = workbook.SaveChartAsImage(workbook.Worksheets[0], 0);

            // Embed the image into the presentation
            IImageData imageData = presentation.Images.Append(image);

            // Add the image to the first slide
            RectangleF rect = new RectangleF(50, 120, presentation.SlideSize.Size.Width - 100, presentation.SlideSize.Size.Height - 170);
            presentation.Slides[0].Shapes.AppendEmbedImage(ShapeType.Rectangle, imageData, rect);

            // Save the presentation
            presentation.SaveToFile("output/PresentationChartExcelChart.pptx", FileFormat.Pptx2019);
            presentation.Dispose();
            workbook.Dispose();
        }
    }
}
Apply for a Temporary License
If you'd like to remove the evaluation message from the generated documents, or to get rid of the function limitations, please request a 30-day trial license for yourself.
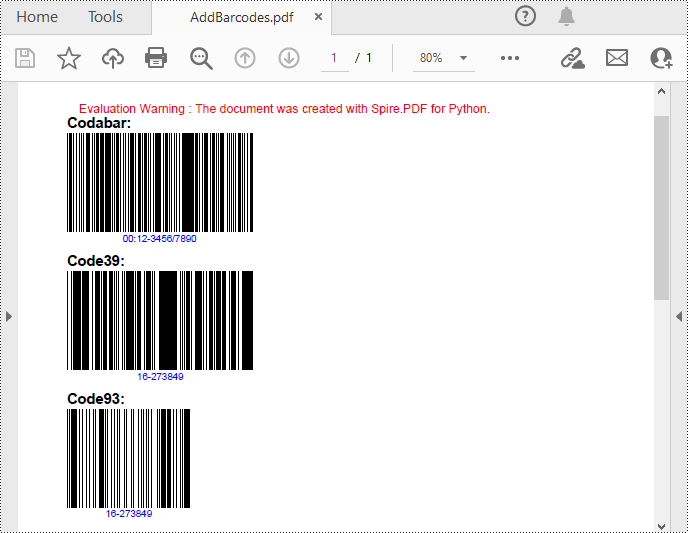
Barcodes in PDFs can facilitate quicker data retrieval and processing. You can add barcodes to PDF files that contain detailed information such as the document's unique identifier, version number, creator, or even the entire document content. When scanned, all information is decoded immediately. This instant access is invaluable for businesses dealing with large volumes of documents, as it minimizes the time and effort required for manual searching and data entry. In this article, you will learn how to add barcodes to PDF in Python using Spire.PDF for Python and Spire.Barcode for Python.
Install Spire.PDF for Python
This scenario requires Spire.PDF for Python and Spire.Barcode for Python. They can be easily installed in your Windows through the following pip command.
pip install Spire.PDF
pip install Spire.Barcode
If you are unsure how to install, please refer to this tutorial: How to Install Spire.PDF for Python on Windows
Add Barcodes to PDF in Python
Spire.PDF for Python support several 1D barcode types represented by different classes, such as PdfCodabarBarcode, PdfCode11Barcode, PdfCode32Barcode, PdfCode39Barcode, PdfCode93Barcode.
Each class provides corresponding properties for setting the barcode text, size, color, etc. The following are the steps to draw the common Codabar, Code39 and Code93 barcodes at the specified locations on a PDF page.
- Create a PdfDocument object.
- Add a PDF page using PdfDocument.Pages.Add() method.
- Create a PdfTextWidget object and draw text on the page using PdfTextWidget.Draw() method.
- Create PdfCodabarBarcode, PdfCode39Barcode, PdfCode93Barcode objects.
- Set the gap between the barcode and the displayed text through the BarcodeToTextGapHeight property of the corresponding classes.
- Sets the barcode text display location through the TextDisplayLocation property of the corresponding classes.
- Set the barcode text color through the TextColor property of the corresponding classes.
- Draw the barcodes at specified locations on the PDF page using the Draw(page: PdfPageBase, location: PointF) method of the corresponding classes.
- Save the result PDF file using PdfDocument.SaveToFile() method.
- Python
from spire.pdf.common import *
from spire.pdf import *

# Create a PDF document
pdf = PdfDocument()

# Add a page
page = pdf.Pages.Add(PdfPageSize.A4())

# Initialize y-coordinate
y = 20.0

# Create a true type font
font = PdfTrueTypeFont("Arial", 12.0, PdfFontStyle.Bold, True)

# Draw text on the page
text = PdfTextWidget()
text.Font = font
text.Text = "Codabar:"
result = text.Draw(page, 0.0, y)
page = result.Page
y = result.Bounds.Bottom + 2

# Draw Codabar barcode on the page
Codabar = PdfCodabarBarcode("00:12-3456/7890")
Codabar.BarcodeToTextGapHeight = 1.0
Codabar.EnableCheckDigit = True
Codabar.ShowCheckDigit = True
Codabar.TextDisplayLocation = TextLocation.Bottom
Codabar.TextColor = PdfRGBColor(Color.get_Blue())
Codabar.Draw(page, PointF(0.0, y))
y = Codabar.Bounds.Bottom + 6

# Draw text on the page
text.Text = "Code39:"
result = text.Draw(page, 0.0, y)
page = result.Page
y = result.Bounds.Bottom + 2

# Draw Code39 barcode on the page
Code39 = PdfCode39Barcode("16-273849")
Code39.BarcodeToTextGapHeight = 1.0
Code39.TextDisplayLocation = TextLocation.Bottom
Code39.TextColor = PdfRGBColor(Color.get_Blue())
Code39.Draw(page, PointF(0.0, y))
y = Code39.Bounds.Bottom + 6

# Draw text on the page
text.Text = "Code93:"
result = text.Draw(page, 0.0, y)
page = result.Page
y = result.Bounds.Bottom + 2

# Draw Code93 barcode on the page
Code93 = PdfCode93Barcode("16-273849")
Code93.BarcodeToTextGapHeight = 1.0
Code93.TextDisplayLocation = TextLocation.Bottom
Code93.TextColor = PdfRGBColor(Color.get_Blue())
Code93.QuietZone.Bottom = 5.0
Code93.Draw(page, PointF(0.0, y))

# Save the document
pdf.SaveToFile("AddBarcodes.pdf")
pdf.Close()
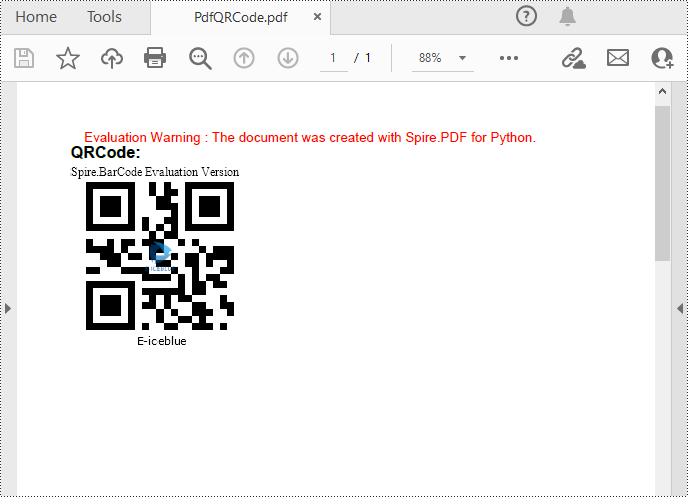
Add QR Codes to PDF in Python
To add 2D barcodes to a PDF file, the Spire.Barcode for Python library is required to generate QR code first, and then you can add the QR code image to the PDF file with the Spire.PDF for Python library. The following are the detailed steps.
- Create a PdfDocument object.
- Add a PDF page using PdfDocument.Pages.Add() method.
- Create a BarcodeSettings object.
- Call the corresponding properties of the BarcodeSettings class to set the barcode type, data, error correction level and width, etc.
- Create a BarCodeGenerator object based on the settings.
- Generate QR code image using BarCodeGenerator.GenerateImage() method.
- Save the QR code image to a PNG file.
- Draw the QR code image at a specified location on the PDF page using PdfPageBase.Canvas.DrawImage() method.
- Save the result PDF file using PdfDocument.SaveToFile() method.
- Python
from spire.pdf.common import *
from spire.pdf import *
from spire.barcode import *

# Create a PdfDocument instance
pdf = PdfDocument()
# Add a page
page = pdf.Pages.Add()

# Create a BarcodeSettings object
settings = BarcodeSettings()

# Set the barcode type to QR code
settings.Type = BarCodeType.QRCode
# Set the data of the QR code
settings.Data = "E-iceblue"
settings.Data2D = "E-iceblue"
# Set the width of the QR code
settings.X = 2
# Set the error correction level of the QR code
settings.QRCodeECL = QRCodeECL.M
# Set to show QR code text at the bottom
settings.ShowTextOnBottom = True

# Generate QR code image based on the settings
barCodeGenerator = BarCodeGenerator(settings)
QRimage = barCodeGenerator.GenerateImage()

# Save the QR code image to a .png file
with open("QRCode.png", "wb") as file:
    file.write(QRimage)

# Initialize y-coordinate
y = 20.0

# Create a true type font
font = PdfTrueTypeFont("Arial", 12.0, PdfFontStyle.Bold, True)

# Draw text on the PDF page
text = PdfTextWidget()
text.Font = font
text.Text = "QRCode:"
result = text.Draw(page, 0.0, y)
page = result.Page
y = result.Bounds.Bottom + 2

# Draw QR code image on the PDF page
pdfImage = PdfImage.FromFile("QRCode.png")
page.Canvas.DrawImage(pdfImage, 0.0, y)

# Save the document
pdf.SaveToFile("PdfQRCode.pdf")
pdf.Close()
Apply for a Temporary License
If you'd like to remove the evaluation message from the generated documents, or to get rid of the function limitations, please request a 30-day trial license for yourself.
Superscript and subscript are formatting options that allow you to raise or lower characters in relation to the main text. Superscript is typically used for mathematical expressions, footnotes, ordinal indicators (such as "1st" or "2nd"), and chemical formulas. Subscript is commonly employed in chemical equations, mathematical notation, and certain linguistic elements. By adding superscripts and subscripts, you can enhance the readability and professionalism of your documents, especially in scientific, mathematical, and technical writing. In this article, we will demonstrate how to add superscripts and subscripts to Word documents in Python using Spire.Doc for Python.
- Add Superscript and Subscript Text to Word in Python
- Apply Superscript and Subscript Formatting to Existing Text in Word in Python
Install Spire.Doc for Python
This scenario requires Spire.Doc for Python and plum-dispatch v1.7.4. They can be easily installed in your Windows through the following pip command.
pip install Spire.Doc
If you are unsure how to install, please refer to this tutorial: How to Install Spire.Doc for Python on Windows
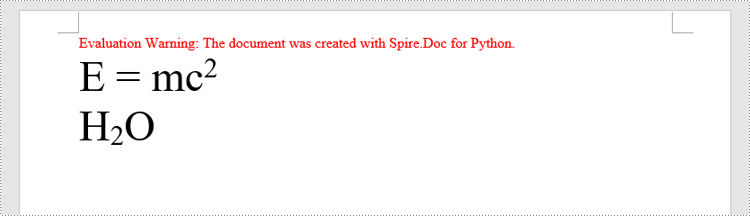
Add Superscript and Subscript Text to Word in Python
You can add text to a paragraph using the Paragraph.AppentText() method. After that, you can apply superscript or subscript formatting to the text through the TextRange.CharacterFormat.SubSuperScript property. The detailed steps are as follows.
- Create an object of the Document class.
- Add a section to the document using Document.AddSection() method.
- Add a paragraph to the section using Section.AddParagraph() method.
- Add normal text to the paragraph using Paragraph.AppendText() method.
- Add superscript or subscript text to the paragraph using Paragraph.AppendText() method.
- Apply superscript or subscript formatting to the superscript or subscript text using TextRange.CharacterFormat.SubSuperScript property.
- Save the resulting document using Document.SaveToFile() method.
- Python
from spire.doc import *
from spire.doc.common import *

# Create a Document instance
document = Document()
# Add a section to the document
section = document.AddSection()

# Add a paragraph to the section
paragraph = section.AddParagraph()

# Add normal text to the paragraph
paragraph.AppendText("E = mc")
# Add superscript text to the paragraph
superscript_text = paragraph.AppendText("2")
# Apply superscript formatting to the superscript text
superscript_text.CharacterFormat.SubSuperScript = SubSuperScript.SuperScript

# Start a new line
paragraph.AppendBreak(BreakType.LineBreak)

# Add normal text to the paragraph
paragraph.AppendText("H")
# Add subscript text to the paragraph
subscript_text = paragraph.AppendText("2")
# Apply subscript formatting to the subscript text
subscript_text.CharacterFormat.SubSuperScript = SubSuperScript.SubScript
# Add normal text to the paragraph
paragraph.AppendText("O")

# Set the font size for the text in the paragraph
for i in range(paragraph.Items.Count):
    item = paragraph.Items[i]
    if isinstance(item, TextRange):
        text_range = item
        text_range.CharacterFormat.FontSize = 36

# Save the resulting document
document.SaveToFile("AddSuperscriptAndSubscriptText.docx", FileFormat.Docx2013)
document.Close()
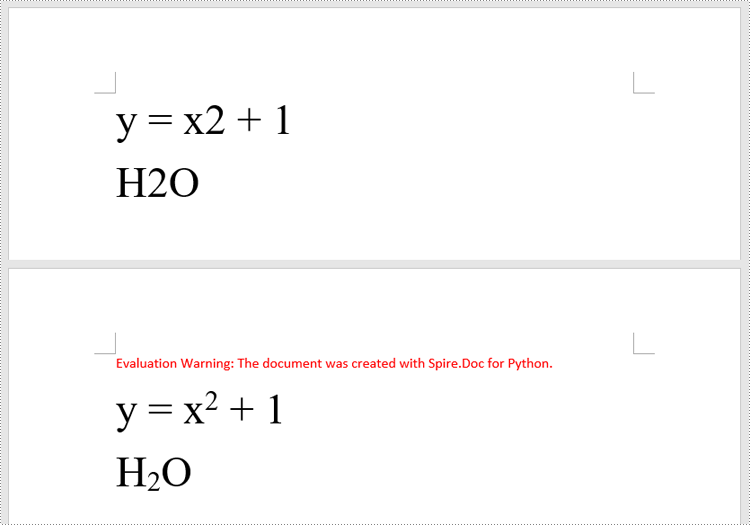
Apply Superscript and Subscript Formatting to Existing Text in Word in Python
To apply superscript or subscript formatting to a specific text, you need to search for the text using the Document.FindAllString() method, then apply superscript or subscript formatting to the instances of that text through the TextRange.CharacterFormat.SubSuperScript property. The detailed steps are as follows.
- Create an object of the Document class.
- Load a Word document using Document.LoadFromFile() method.
- Find a specific text in the document using Document.FindAllString() method. This method will return a list of TextSelection objects, each representing an instance of the text in the document.
- Get the first instance of the text as a single text range using TextSelection.GetAsOneRange() method, then apply superscript formatting to the text range by setting the TextRange.CharacterFormat.SubSuperScript property to SubSuperScript.SuperScript.
- Get the second instance of the text as a single text range using TextSelection.GetAsOneRange() method, then apply subscript formatting to the text range by setting the TextRange.CharacterFormat.SubSuperScript property to SubSuperScript.SubScript.
- Save the resulting document using Document.SaveToFile() method.
- Python
from spire.doc import *
from spire.doc.common import *

# Create a Document instance
document = Document()
# Load a Word document
document.LoadFromFile("Sample.docx")

# Find a specific number in the document
text_selections = document.FindAllString("2", False, False)

# Apply superscript formatting to the first instance of the number
superscript_text = text_selections[0].GetAsOneRange()
superscript_text.CharacterFormat.SubSuperScript = SubSuperScript.SuperScript

# Apply subscript formatting to the second instance of the number
subscript_text = text_selections[1].GetAsOneRange()
subscript_text.CharacterFormat.SubSuperScript = SubSuperScript.SubScript

# Save the resulting document
document.SaveToFile("ApplySuperscriptAndSubscriptFormatting.docx", FileFormat.Docx2013)
document.Close()
Apply for a Temporary License
If you'd like to remove the evaluation message from the generated documents, or to get rid of the function limitations, please request a 30-day trial license for yourself.